WAGES: NEW DEVELOPMENTS
Edited by
Péter Galasi
Gábor Kézdi
INTRODUCTION
Péter Galasi & Gábor Kézdi
In the 2002 volume of The Hungarian Labour Market, part I of the “In Focus” section focused on how wages evolved during the post-communist transformation of Hungary. In the initial years of the transition, real wages dropped slightly when compared to other former socialist countries during the “transformational recession”, while unit labour costs increased under the influence of a combination of factors. In the second half of the 1990’s both real earnings and wage costs dropped significantly. The resulting rise in prof- its helped to pave the way for re-launching economic growth, which triggered a climb in real wages. Another definitive development of the transformation decade was a steady widening of inequalities in earnings, extremely rapid by international comparison. The gap grew particularly large within industries – between groups with different education levels and between different types of companies.
The 2002 study argues that company level decisions and bargaining gained the dominant role in setting wages. The shape of relative earnings increas- ingly reflected differences in companies’ ability to pay and in the bargaining positions of workers. One decade after the collapse of the socialist system, the Hungarian labour market looks like a well-functioning labour market, in which earnings are related primarily to productivity. From the perspective of the labour market transition is thus over. That of course does not mean the emergence of a frictionless competitive labour market. Some of the problems have their origins deep in the past, like increased regional inequalities or the size of public sector employment. At the same time, new developments and policies produce additional problems that create a more complex labour mar- ket picture. The significant rise in the minimum wage and the wages of pub- lic sector employees, and the extraordinary expansion of higher education all might have their effect on wages.
Five years after the first In Focus section on the same topic, we take anoth- er close look at Hungarian wages. Some studies in the present section ana- lyze how new developments and policies affect wages. Other studies examine whether transition-related trends continued into the 2000’s. And yet other studies address questions that were not previously analyzed.
The first study by Hedvig Horváth, Péter Hudomiet and Gábor Kézdi looks at the role of in-kind benefits in total labour income in Hungary. These ben- efits include car and cellular phone usage, representation expenses, meals-, clothing- and transport subsidies, etc. The literature has paid less attention to these issues so far in Hungary, in part because of the lack of adequate data. In this study the authors use earnings and in-kind benefits data from a detailed (albeit relatively small) household survey, the Monitor survey of Tárki. They find that both the likelihood of receiving benefits and the amount received is strongly positively related to earnings, which implies that firms do not use benefits for compensating lower earnings but rather treat them as part of total remuneration. As a consequence, inequality in terms of total labour income is larger than in terms of earnings. The results also imply that conclusions drawn from standard earnings regressions hold for the more broadly defined labour income. An important exception is that returns to education are greater if measured in broader income terms than in earnings.
In the second study, Gábor Kőrösi analyzes the factors determining inter- firm differences in average wage rates, with an emphasis on firm-level wage dynamics. The study identifies the main determinants shaping inter-firm wage differences in Hungary over the past decade. It also shows the factors that did not seem to play a significant role in spite of their importance in the interna- tional literature. The overall picture emerging from the estimates shows that rent sharing (i.e. the split of productivity gains between employers and em- ployees) is present in all Hungarian firms, although the extent varies consid- erably across industries. Rent sharing is influenced not only by differences in technology but also the market environment that firms face. In the early years of the post-communist transition the degree of rent sharing was significantly higher than in market economies, and has decreased considerably since. The high degree of rent sharing may seem paradoxical at first sight as it is usually accompanied by strong labour unions. Hungarian unions are, on the other hand, relatively weak. It is therefore likely that some transition-specific fac- tors played an important role in the early years.
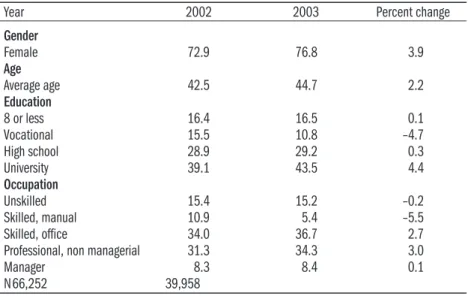
The third study, by Álmos Telegdy, analyzes the wage differences between the public and private sectors during the period of 2000–2004, in the mid- dle of which the wages of public employees were raised significantly and as a result their average wage increased by 36 percent in real value. Consequently, the average wage in the public sector surpassed that of the business sector by 18 percent. Wage differences by education and occupation are significant. The
highest relative wage throughout the period is related to the least educated employees and to the ones who occupy positions requiring unskilled labour.
Employees graduated from college or university have the lowest relative wages (–25 percent in 2004). However, after controlling for other observable fac- tors (age and gender being the most important), wages in the public sector in 2004 are found to be higher in virtually all education or occupation catego- ries than in the business sector. The only category for which this is not true is college and university graduates, but the difference here is a mere 3.7 per- cent. According to these findings the government has not only levelled the wages in the public and business sectors but also pays a wage premium to the majority of its employees. That most likely has major consequences for the whole of the Hungarian labour market.
The fourth study, written by Péter András Szabó, looks at whether, and how, regional earnings differences have changed since the turn of the century.
Data suggest that regional earnings and labour cost differentials are moder- ate between 1998 and 2004. The wage gain of the poorest region compared to the most developed part of the country does not exceed 6 per cent by the end of the period. All these results show that labour cost differentials do not play a dominant role in a firms’ migration decisions, since a moderate wage gain might not provide enough incentive for a firm to relocate. In the de- pressed regions, however, the recruiting and screening costs are lower due to the (relatively) abundant labour supply. Thus the less developed regions may have other characteristics that foster formation of companies to a greater ex- tent than the slight gain in earnings (Köllő 2003). Hence rural development policy should not concentrate only on “raw” differentials in earnings and la- bour costs but also on factors that affect the regional distribution of earnings, such as education or unemployment.
The fifth study, written by Gábor Kertesi and János Köllő, looks at the la- bour market value of higher education degrees. The economic transformation following the political transition brought about a spectacular increase in re- turns to higher education. It also brought about a rapid growth of the supply of graduates. As a result, limits to demand will sooner or later put an end to the upward trend in the rising returns. According to conventional wisdom in Hungary, graduate degrees have already entered a steep decline. The au- thors contrast that with detailed evidence using the data available before May 2005. They conclude that the earnings advantage – very large by international comparison – in the rapidly rejuvenating professions of the business and cleri- cal-administrative sectors has indeed diminished. Meanwhile, the position of the young graduates in the public sector was significantly improved by the pay-rise in 2002. Despite the following decline, their relative earnings are still higher than in the period before the expansion of the higher education.
In summary, higher education degrees can still be considered exceptionally
good investments in Hungary taking into account the current earnings, job prospects and individual costs of education.
Julia Varga, in the sixth study, analyzes the composition and earnings of public school teachers. The level of skills in an economy is crucial for its growth, and teachers in state schools play an important role in the produc- tion of skills. Hiring and keeping highly skilled schoolteachers has become very difficult in Hungary in the past twenty years as their relative earnings steadily declined. Using large datasets, the author documents the trends in earnings and (measurable) skill composition between 1992 and 2004, a pe- riod that includes the significant raising of the salaries of public employ- ees. Relative wage of schoolteachers declined steadily until 2002, especially compared to young college graduates employed in the private sector. At the same time, the average age in the profession rose significantly. As a result of the general raising of public sector wages in 2002, older teachers’ wages have become pretty close to wages of older private sector employees. At the same time, young schoolteachers’ wages continue to lag behind considerably. This naturally fed back to the career choice of potential teachers. The results sug- gest that during the entire period, self-selection has led to a declining aver- age quality of the pool of teachers’ college entrants and the pool of entrants to the profession itself.
In the seventh study, Márton Csillag examines male-female earnings differ- ences between 1986 and 2002 and relates those to occupational and firm-level gender segregation. His analysis shows that while towards the end of commu- nism gender disparities in occupational composition were a major factor in sustaining gender wage gap, following the transition male and female work, however, becomes less strictly defined and that working in a feminized occu- pation does not, necessarily, entail a wage penalty. The author argues there- fore, that the current gender wage gap in Hungary is not due to occupational exclusion coupled with an undervaluation of female work. It is rather a result of women being paid less than their male counterparts in a given occupation and firm. The available evidence is not enough to tell whether that is due to differences in productivity or discriminatory practices, and so further research is needed on the subject.
The last study, by Péter Galasi, takes another look at a hotly debated ques- tion in post-transition Hungary: the effect of the expansion of higher edu- cation on the employment and wages of young graduates. The author makes use of a unique dataset of fresh graduates in order to analyze their earnings mobility at the turn of the century. Most of them obtained other higher- education degrees, participated in training courses, and accumulated addi- tional labour market experience. Some of them could also ameliorate their position in terms of better job/education matching. The author finds, how- ever, that these developments did not necessarily result in higher wages. An
initial 5-year university diploma implies some wage premium over an initial 4-year college diploma even at the time of the second observation, and the premium remains the same whether college-diploma holders obtain anoth- er higher-education degree or not. Moreover, the results show that the wage gain attributable to a second higher-education diploma in addition to an ini- tial university diploma is not higher than the one due to a university diploma with no additional higher-education degree. Some types (and combinations of types) of education (business/economics, law, informatics, technical sci- ences) produce a wage advantage as compared to one degree in agricultural sciences, but these gains seem to be the same for all combinations of types of education. Language courses and short-term courses in business/econom- ics also result in wage gains. Job/education mismatch in itself does not affect earnings, only transition from one state of mismatch to another (from over- education to under-education and from under-education to over-education) implies lower wages. As regards labour market experience, unemployment negatively influences earnings. It seems that, at least in the short run, addi- tional human-capital accumulation might go hand in hand with earnings losses as well as gains.
1. IN-KIND BENEFITS IN HUNGARY
Hedvig Horváth, Péter Hudomiet & Gábor Kézdi
This study looks at the role of in-kind benefits in total labour income in Hungary. These benefits include car and cellular phone usage, representa- tion expenses, meals-, clothing- and transport subsidies, etc. The literature has paid less attention to these issues so far in Hungary, in part because of the lack of adequate data. In this study we use earnings and in-kind benefits data from a detailed (albeit relatively small) household survey, the Monitor survey of Tárki.
We raise two closely related questions in this study. The first question con- siders who receives in-kind benefits in Hungary, why, and of what kind. It is possible that, because of compensating differentials, those who earn more might expect less in-kind benefits. In this case, inequality measured solely by earnings would overestimate total labour income inequality. Compensating differentials may occur if, for exogenous reasons, in-kind benefits are higher in some occupations than in others, and employers use other earnings compo- nents (wages, bonuses) to compensate for the differential. Of course, a positive correlation is also possible, i.e. higher wages may coincide with higher in-kind benefits. In this latter case, inequality measured solely by earnings would un- derestimate total labour income inequality. This latter case may occur if the tax cost of in-kind benefits is smaller. Our results support the second case.
Although on average the ratio of in-kind benefits to total labour income is small, there is a significant positive relationship between wages and in-kind benefits. Moreover, determinants of in-kind benefits match the determinants of earnings, indicating that overall, the role of in-kind benefits is very similar to that of other earnings components.
Our second question considers how total labour income is affected by the most commonly used covariates in earnings functions (gender, education, etc.). This question is rather technical and tries to examine whether conclu- sions drawn from those estimates can be extended to total labour incomes as well. Given our answer to the first question, it is not surprising that we find a strong confirmative answer. The estimated parameters of the standard Mincer type regressions are quite similar in both cases, with the notable exception of
the effect of education. Returns to education on total labour income are even larger than on earnings itself.
In-kind benefits
Since 1998, Tárki Social Research Inc.1 has collected cross-sectional house- hold surveys called Household Monitor, generally every two years. In 2003, 2335 households were successfully interviewed. The main advantage to us of this survey is that, in addition to the usual measures of wages, bonuses and other monetary premiums,2 it contains detailed data on other sources of la- bour income: tips, secondary jobs, and in-kind benefits. The survey was car- ried out on a relatively small sample, and the data collection is based on self- assessment, which could affect reliability.
Table 1.1 contains simple descriptive statistics on the fraction of recipients of the different types of labour income. As far as in-kind benefits are concerned, the relevant information is given in monetary intervals (under 30,000 HUF, 30,000–60,000 HUF, etc.) For the descriptive statistics, we have simply as- signed the midpoint of the category, but for the detailed analysis we shall al- low for interval-coding.
Table 1.1: Partaking in the different income components (panel A) and the ratio of them to total income (panel B). Tárki Monitor 2003 (N=1752)
Tips Payments
on invoice Secondary
jobs In-kind
benefits Monetary earnings A. What fraction receives it? (Per cent)
Top managers 0.0 6.3 13.5 79.7 100.0
Middle managers 7.3 10.9 3.9 81.3 100.0
Junior managers 14.8 2.9 8.8 72.6 100.0
White-collar employees 2.8 9.7 7.5 77.9 100.0
Other white-collar workers 6.2 4.8 2.7 74.6 100.0
Skilled workers 6.4 1.6 1.9 61.4 100.0
Agricultural labourers 0.0 0.0 0.0 57.5 100.0
Semi-, unskilled workers 3.8 1.6 0.8 66.4 100.0
TOTAL: 5.5 3.7 3.1 66.4 100.0
B. What is the average fraction of the income component in total labour income? (Per cent)
Top managers 0.0 0.4 4.3 4.9 90.3
Middle managers 0.1 5.0 2.1 4.4 88.4
Junior managers 0.9 0.1 3.4 4.4 91.2
White-collar employees 0.0 1.2 1.9 3.5 93.4
Other white-collar workers 1.1 4.9 1.0 4.6 88.4
Skilled workers 0.5 0.3 0.6 2.8 95.8
Agricultural labourers 0.0 0.0 0.0 2.0 98.1
Semi-, unskilled workers 0.7 0.6 0.5 2.4 95.9
Total: 0.5 1.6 1.3 3.5 93.1
1 www.tarki.hu/en
2 Earnings include bonuses and premiums. The exact definition is described below.
The most important message of Table 1.1 is that labour income is more than primary job monetary earnings for most Hungarians. Payment on invoice is most frequent for middle managers, junior managers get the most tips, and a non-negligible fraction of managers and other white-collar employees have second jobs. Two-thirds of Hungarian employees receive some in-kind ben- efits, the higher qualified the job is the more so. At the same time, based on our estimates from the Tárki Monitor survey, the fraction of these to total labour income seems to be quite small. The total income of blue-collar work- ers is nearly the same as their monetary earnings. It is possible that data on monetary earnings are more reliable than those other components and sys- tematic underestimation is more pronounced there. As we have only self-re- ported data, we cannot check this potential bias.
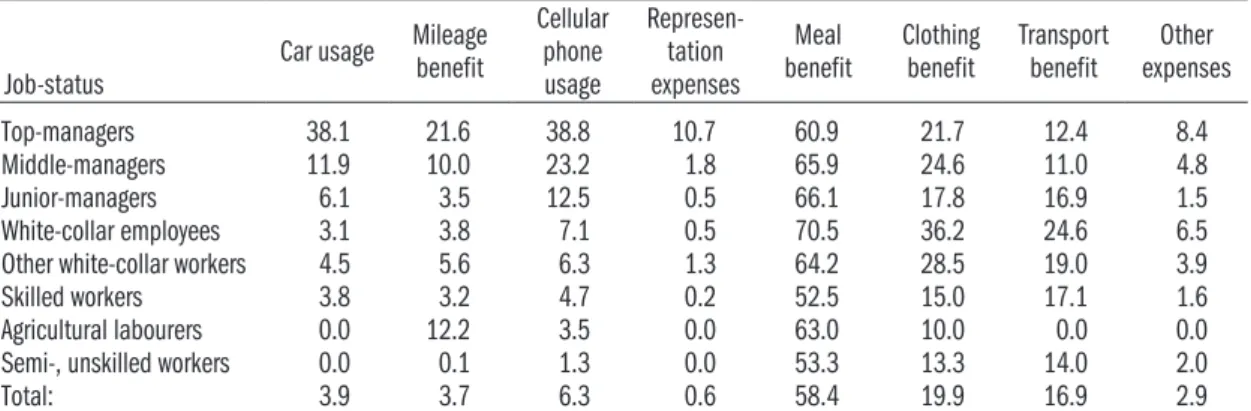
The survey also has data, although without monetary equivalent, on different types of in-kind benefits. Table A1.1 (in the appendix) contains these by em- ployment status. Among them, meal benefit is the most frequent one: 50 to 70 per cent of employees in all jobs receive it. Clothing is less frequent but is also
*distributed rather homogenously (10–36 percent), and, excluding agricultural workers, the same is true for the transport benefit (11–25 percent). Car usage is mainly given to white-collar and to some extent to skilled workers.
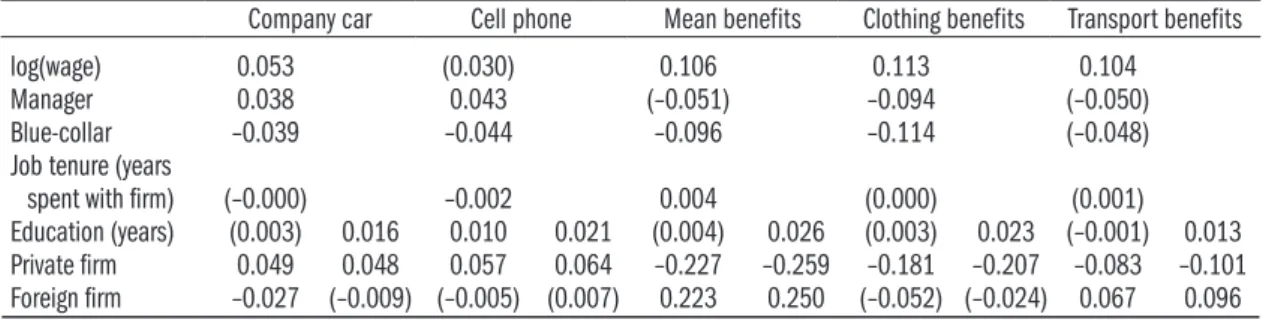
In what follows, we look at the probability of receiving in-kind benefits in a more systematic way, by estimating probit probability models. For each type of benefit, we run two models. In the first model, we control for log wage, job characteristics and job tenure besides the usual Mincer-type explanatory variables (gender, potential experience, education, ownership of the firm, re- gional location and type of settlement). We address three questions in these models. (a) Is the (partial) correlation between wages and benefits positive or negative? (b) Are the effects of job characteristics and job tenure signifi- cant after controlling for wages? (c) Are the effects of the Mincer type vari- ables significant after controlling for wages? The second type of model fea- tures the standard Mincer type variables only. We run those models in order to see whether the estimated effects are similar for different types of in-kind benefits. Table 1.2 shows the estimated effects of the most important vari- ables. The table presents the average partial effects (average effect of different explanatory variables on the independent variables).
There is a significant positive link between wages and the probability of re- ceiving in-kind benefits. The narrower models show that the effects of educa- tion on any type of in-kind benefits are always significant, positive, and sub- stantial except for company car usage and transport benefits. Nevertheless, this relationship disappears or almost disappears if we control for wages. The complete models (not reported here) also show that while labour market ex- perience is not significant, the gender effect on benefits is similar to the one on wages: women can expect less of both. These results suggest that in-kind
benefits supplement wages and move along with them. Our results therefore support the second possibility in the introduction: benefits are very much like monetary components of earnings and there is no evidence for compen- sating differentials.
Table 1.2: Probit models for the probability of receiving different kinds of in-kind benefits.
Average partial effects on probabilities. Tárki Monitor 2003
Company car Cell phone Mean benefits Clothing benefits Transport benefits
log(wage) 0.053 (0.030) 0.106 0.113 0.104
Manager 0.038 0.043 (–0.051) –0.094 (–0.050)
Blue-collar –0.039 –0.044 –0.096 –0.114 (–0.048)
Job tenure (years
spent with firm) (–0.000) –0.002 0.004 (0.000) (0.001)
Education (years) (0.003) 0.016 0.010 0.021 (0.004) 0.026 (0.003) 0.023 (–0.001) 0.013 Private firm 0.049 0.048 0.057 0.064 –0.227 –0.259 –0.181 –0.207 –0.083 –0.101 Foreign firm –0.027 (–0.009) (–0.005) (0.007) 0.223 0.250 (–0.052) (–0.024) 0.067 0.096 Note: Parameters in brackets are not significant at 5 percent.
Other results from the models are also interesting. First, the effect of job status and job tenure do not disappear completely even when we control for wages. This can reflect the nature of within-firm incentives, but it can also mean that, besides measured current wages, these variables can also predict long-term (permanent) wages. In the latter case, these variables are signifi- cant after controlling for current wages, but they would not be significant if we could control for permanent wages. Second, firm ownership matters. Our models suggest that domestic private firms give less meal and transport ben- efits to their employees than either foreign or public firms. It seems therefore that domestic private firms do not make use of the legal possibilities of giving such benefits. Furthermore, we can see that public firms give more clothing benefit and less car and cellular phone usage.
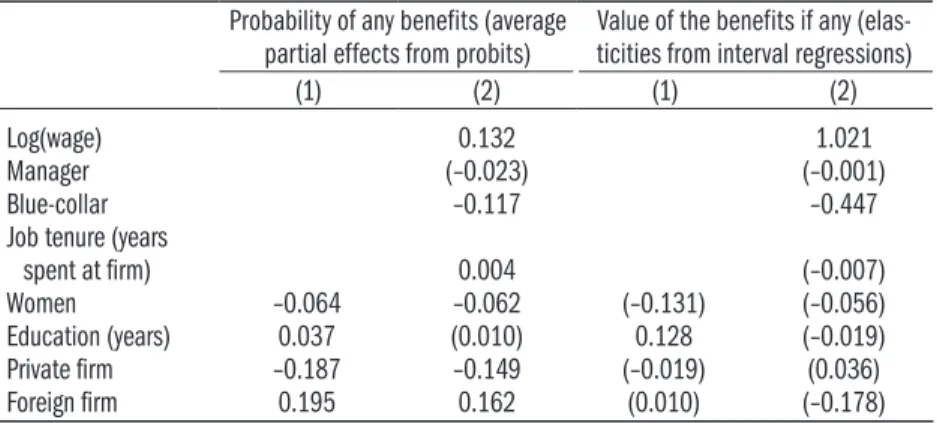
Recall from Table 1.1 that the share of in-kind benefits within total labour income is quite small. Therefore, we have estimated models that examine the amount of benefits together. Our main question is that if somebody gets any kind of benefits, what is their monetary equivalent. In addition, we have also examined the factors that can affect the probability of receiving any kind of benefits. Both questions refer to the benefits together, because the survey does not provide information about the amount of the benefits one by one. For the second question we have used probit models. These models estimate the relationship between the explanatory variables and the probability of receiv- ing any kind of benefits. For the first question we have used ordered probit models, because the survey only provides data on the interval in which the monetary equivalents of the benefits are (0–30,000 HUF; 30,000–60,000 HUF; etc.) This latter method is also called interval regression because it is an ordered probit with known thresholds (see Wooldridge, 2002, pp. 508.)
For easier interpretations, we have used the logarithms of the category-mar- gins. In this way the estimated parameters of the interval regressions can be directly interpreted: they show the percentage increase of the value of ben- efits (conditional on having received any) associated with a one unit change in the independent variable.
Just as in the previous case, we estimated two models for both the probabil- ity and the magnitude of benefits. The first one contains the standard Mincer type variables; the second one has the job description and job tenure (years spent with the firm) variables. The most important results are shown in Ta- ble 1.3 and the complete output is in Table A1.2 in the appendix. We show here models with education measured by completed school years; results from models with degrees of qualification are very similar.
Table 1.3: Probability of receiving any benefits (probit) and value of the benefits if any (interval regression). Tárki Monitor 2003, Hungary
Probability of any benefits (average
partial effects from probits) Value of the benefits if any (elas- ticities from interval regressions)
(1) (2) (1) (2)
Log(wage) 0.132 1.021
Manager (–0.023) (–0.001)
Blue-collar –0.117 –0.447
Job tenure (years
spent at firm) 0.004 (–0.007)
Women –0.064 –0.062 (–0.131) (–0.056)
Education (years) 0.037 (0.010) 0.128 (–0.019)
Private firm –0.187 –0.149 (–0.019) (0.036)
Foreign firm 0.195 0.162 (0.010) (–0.178)
Note: Parameters in brackets are not significant at 5 percent.
For complete output see Table A1.2.
Women are 7 per cent less likely to receive in-kind benefits even if we con- trol for job status, tenure and earnings. Domestic private enterprises are less likely to give in-kind benefits, by 20 per cent (16 per cent in model 2), than state-owned ones or foreign private firms (the latter two are about as likely to give). Model 2 implies that 1 per cent higher earnings are associated with 0.15 per cent more likely benefits. Blue-collar workers receive benefits with a 13 percent smaller probability, and each 2.5 years spent at the company in- creases the chance of benefits by 1 percentage point.
The value of benefits (if positive) does not correlate with ownership. Edu- cation matters more for benefits than for earnings: returns to education here are 13 per cent, compared to 9 per cent in the standard Mincer type regres- sions (see later) but conditional on earnings, it has no effect on benefits. Con- ditional on earnings and job characteristics, neither gender, nor education seems to matter. One per cent higher earnings are associated with benefits
higher by the very same 1 percent. Blue-collar workers, however, receive half as much even if they receive any.
These results suggest two important conclusions. First, blue-collar jobs are associated with significantly less likely and smaller benefits, even when we con- trol for earnings and education. Second, earnings and benefits move closely together: benefits are related to the marginal product of work the very same way wages do, as a first approximation (that is to say, except that blue-collar jobs seem to have an extra penalty).
Mincer-type regressions for earnings and total labour income including in-kind benefits
Most studies on Hungarian earnings use the wage-tariff data surveys.3 The first study using the data was Kertesi and Köllő (1997a). In the In Focus chap- ter of the present volume all studies are based on Wage-tariff surveys except for that of Péter Galasi.
Wage-tariff surveys were carried out in 1986, 1989 and yearly from 1992, they contain data on earnings and basic demographical information. The sam- ple covers all public sector workers and a large representative sample of private sector workers at enterprises, together with some data on the plant and the enterprise. Earnings data contain wages and yearly bonuses and premiums.
The remarkable value of the wage-tariff surveys is in their size (hundreds of thousands of employees each year) and the possibility to match them with employers’ data (e.g. with balance sheets).
All data in the wage-tariff surveys are provided by the employer. Earnings are thus more precise than those gained from household surveys (Kézdi, 1998). At the same time, employer provided data have their drawbacks as well. For one thing, families and households are impossible to link. For an- other, we have the data from one single employer even if a worker has more jobs (or, to be more precise, each record is about one job, and employers are not possible to identify). In addition, wage-tariff does not have information on in-kind benefits.
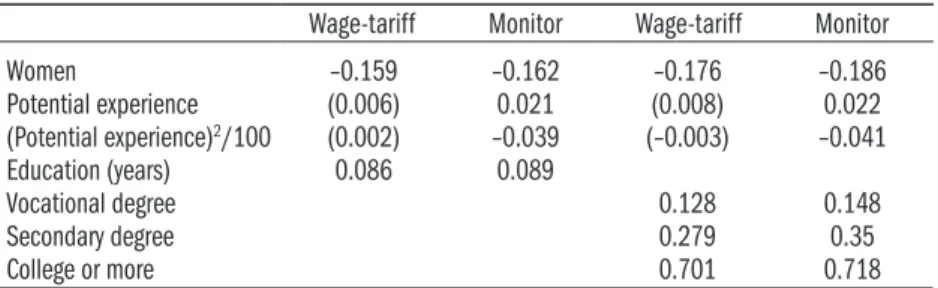
Below, we compare the most important results of Mincer type regressions from the 2003 wage tariff survey and the 2003 Tárki Monitor survey.4 First, for a benchmark comparison, we run standard Mincer-type regressions on earnings using variables that are available in both surveys. Average after tax earnings are about 15 percent lower in the self-reported data, which is very similar to the 20 per cent difference in the wage tariff – household survey comparison measured, for the 1980’s, by Kézdi (1998). Table 1.4 shows the main results of the basic models that can be estimated from both surveys (for complete results, see Table A1.3 in the appendix).
3 The data-owner of the Wage- tariff surveys is the Employment Office (Foglalkoztatási Hivatal), and IE-HAS provided the yearly harmonized data suitable for analysis. The work was lead by János Köllő and the final harmo- nized version was put together by Mónika Bálint. Original data files can be analyzed accord- ing to the agreement with the Employment Office, while the cleared, harmonized, complete and re-weighted database can be analyzed in accordance with agreements with IE-HAS and the consent of the Employment Office. See more details at www.
econ.core.hu
4 In the wage tariff survey, after- tax earnings mean the monthly wage in May, 2003 plus one twelfth of 2002 yearly bonuses and premiums, also after tax. In the Monitor survey, respondents report their average after-tax monthly wage between October 2002 and September 2003 and the after-tax value of bonuses and premiums received during the very same period (the latter we divided by twelve).
Table 1.4: Mincer-type earnings regressions, comparable samples of full-time workers. Wage-tariff 2003 and Tárki Monitor 2003
Wage-tariff Monitor Wage-tariff Monitor
Women –0.159 –0.162 –0.176 –0.186
Potential experience (0.006) 0.021 (0.008) 0.022
(Potential experience)2/100 (0.002) –0.039 (–0.003) –0.041
Education (years) 0.086 0.089
Vocational degree 0.128 0.148
Secondary degree 0.279 0.35
College or more 0.701 0.718
Notes: Linear regression models; the dependent variable is the logarithm of net monthly wage.
Parameters in brackets are not significant at 5 percent. Robust standard errors.
For complete output see Table A1.3.
The explanatory power of the models are of the usual order, though R-squares for Wage-tariff regressions are systematically lower. All coefficients are very close except for potential labour market experience, which is not significant in Wage-tariff-regressions.
If we change the logarithm of net monthly wages to the logarithm of net hourly wages as the dependent variable of the model, gender difference de- creases considerably but still remains significant. The most important result for us, however, is that although the return to experience is different, gender wage difference and the return to education are nearly the same in the two samples. This is remarkable, especially if we take into account how different the circumstances of the two surveys are.5
After having established comparability, we can analyze what happens if we run regressions of total labour income on the left-hand side instead of month- ly earnings. Full labour income consists of the monthly wage, yearly bonuses and premiums projected to one month, and tips, payment for invoice, income from second jobs, and the monetary value of in-kind benefits (recall that the latter include company car, cellular phone, meal, clothing, transport benefits).
Table 1.5 shows the main results.
Returns to experience are the same in the two models, gender differences are a little bit greater (men may count on more benefits) but the difference is not significant. On the other hand, returns to education are significantly larger in terms of total labour income than earnings only. The coefficient on educa- tion is about 10 percent higher whether it is measured by completed years or degrees – in the latter case, in addition, the difference is nearly 10 percent in all categories. Table A4 also shows that full labour income is lower at Hun- garian private companies than at foreign- or state-owned firms.
The results of Mincer type regressions run on the Monitor database are in line with those of the probit models described in the previous part. They re- port that if the left-hand-side variable contains all the benefits besides mon-
5 Regional differences, how- ever, differ significantly in the two datasets. One important reason for that may be the fact that while Wage-tariff reports the place of employment Moni- tor reports the place where the individual lives. Henceforth, because of commuters the two variables might show signifi- cant deterioration (e.g. in Pest county). Differences between Hungarian and foreign firms are very much alike (they are a bit lower in Monitor), state- and private-owned differences, how- ever, are much lower in Monitor.
Ownership is defined differ- ently in the two surveys, and in a household survey it is likely to be much noisier.
etary earnings, the results are basically the same, except for education, the returns of which are about 10 per cent stronger.
Table 1.5: Net monthly wages and net monthly total incomes.
Results of Mincer type regressions. Tárki Monitor, 2003.
Earnings Total labour income (incl.
benefits) Earnings Total labour income (incl.
benefits)
Women –0.162 –0.165 –0.186 –0.193
Potential experience 0.021 0.022 0.022 0.023
(Potential experience)2/100 –0.039 –0.039 –0.041 –0.041
Education (years) 0.089 0.098
Vocational degree 0.148 0.161
Secondary degree 0.350 0.385
College or more 0.718 0.796
Notes: Linear regression models; the dependent variables are the logarithms of earn- ings or total labour income.
Parameters in brackets are not significant at 5 percent. Robust standard errors.
For total output see Table A1.4.
Conclusion
Two questions were raised at the beginning of this chapter. The first asked who receives in-kind benefits in Hungary, why and of what type. We answered the question using the Monitor household survey of Tárki. The most impor- tant results are the following. The most frequent in-kind benefit is meals and clothing, though other benefits (e.g. company cars and cellular phones) may also be frequent depending on the type of job. Both the likelihood of receiv- ing benefits and the amount received is strongly positively related to earnings, which implies that inequality in terms of total labour income is larger than in terms of earnings. Benefits are related to the marginal product of labour in the same way wages are, implying that firms do not use benefits for compensating lower earnings but rather treat them as similar parts of total remuneration.
However we also found that blue-collar workers receive significantly less ben- efits than their white-collar colleagues with a similar level of earnings.
The second question was whether conclusions drawn from standard earnings regressions hold for more broadly defined labour income. The results here are in line with the ones seen before. Determinants of broad labour income are very similar to determinants of earnings, with one notable exception: returns to education are ten per cent larger if one looks at broad labour income.
Appendix
Table A1.1: Sharing in the different kinds of in-kind benefits. Tárki Monitor 2003, % (N=1752)
Job-status Car usage Mileage
benefit
Cellular phone usage
Represen- tation expenses
Meal
benefit Clothing
benefit Transport
benefit Other expenses
Top-managers 38.1 21.6 38.8 10.7 60.9 21.7 12.4 8.4
Middle-managers 11.9 10.0 23.2 1.8 65.9 24.6 11.0 4.8
Junior-managers 6.1 3.5 12.5 0.5 66.1 17.8 16.9 1.5
White-collar employees 3.1 3.8 7.1 0.5 70.5 36.2 24.6 6.5
Other white-collar workers 4.5 5.6 6.3 1.3 64.2 28.5 19.0 3.9
Skilled workers 3.8 3.2 4.7 0.2 52.5 15.0 17.1 1.6
Agricultural labourers 0.0 12.2 3.5 0.0 63.0 10.0 0.0 0.0
Semi-, unskilled workers 0.0 0.1 1.3 0.0 53.3 13.3 14.0 2.0
Total: 3.9 3.7 6.3 0.6 58.4 19.9 16.9 2.9
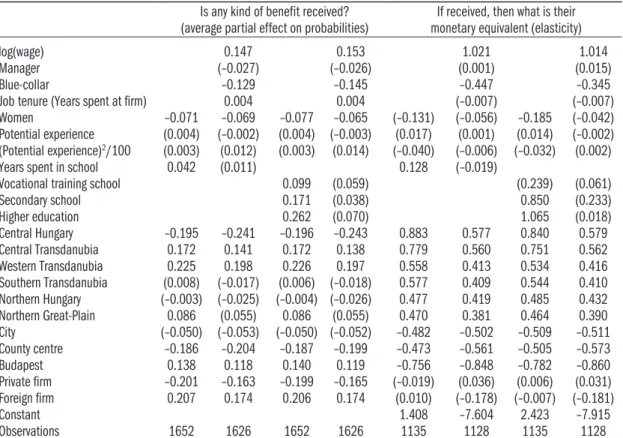
Table A1.2: Models for the probabilities of getting any kinds of benefit and of their amount. Tárki Monitor 2003 Is any kind of benefit received?
(average partial effect on probabilities) If received, then what is their monetary equivalent (elasticity)
log(wage) 0.147 0.153 1.021 1.014
Manager (–0.027) (–0.026) (0.001) (0.015)
Blue-collar –0.129 –0.145 –0.447 –0.345
Job tenure (Years spent at firm) 0.004 0.004 (–0.007) (–0.007)
Women –0.071 –0.069 –0.077 –0.065 (–0.131) (–0.056) –0.185 (–0.042)
Potential experience (0.004) (–0.002) (0.004) (–0.003) (0.017) (0.001) (0.014) (–0.002) (Potential experience)2/100 (0.003) (0.012) (0.003) (0.014) (–0.040) (–0.006) (–0.032) (0.002)
Years spent in school 0.042 (0.011) 0.128 (–0.019)
Vocational training school 0.099 (0.059) (0.239) (0.061)
Secondary school 0.171 (0.038) 0.850 (0.233)
Higher education 0.262 (0.070) 1.065 (0.018)
Central Hungary –0.195 –0.241 –0.196 –0.243 0.883 0.577 0.840 0.579
Central Transdanubia 0.172 0.141 0.172 0.138 0.779 0.560 0.751 0.562
Western Transdanubia 0.225 0.198 0.226 0.197 0.558 0.413 0.534 0.416
Southern Transdanubia (0.008) (–0.017) (0.006) (–0.018) 0.577 0.409 0.544 0.410 Northern Hungary (–0.003) (–0.025) (–0.004) (–0.026) 0.477 0.419 0.485 0.432 Northern Great-Plain 0.086 (0.055) 0.086 (0.055) 0.470 0.381 0.464 0.390
City (–0.050) (–0.053) (–0.050) (–0.052) –0.482 –0.502 –0.509 –0.511
County centre –0.186 –0.204 –0.187 –0.199 –0.473 –0.561 –0.505 –0.573
Budapest 0.138 0.118 0.140 0.119 –0.756 –0.848 –0.782 –0.860
Private firm –0.201 –0.163 –0.199 –0.165 (–0.019) (0.036) (0.006) (0.031) Foreign firm 0.207 0.174 0.206 0.174 (0.010) (–0.178) (–0.007) (–0.181)
Constant 1.408 –7.604 2.423 –7.915
Observations 1652 1626 1652 1626 1135 1128 1135 1128
Notes: Column 2–5: probit models, average partial effects. Column 6–9: parameters of ordered probit models with known category-bounds (interval regressions).
Parameters in brackets are not significant at 5 percent.
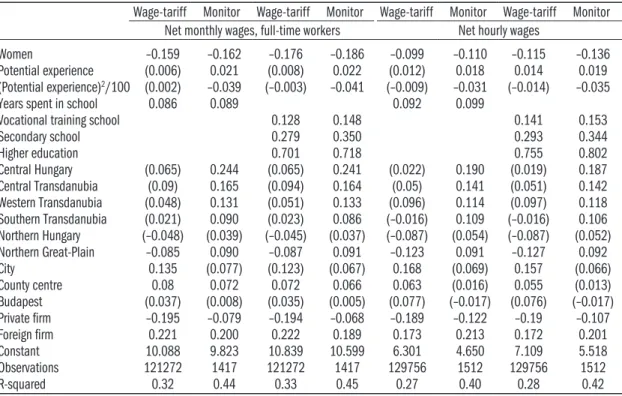
Table A1.3: Models for the net monthly wages of full-time workers, and for net hourly wages.
Wage-tariff 2003 and Tárki Monitor 2003
Wage-tariff Monitor Wage-tariff Monitor Wage-tariff Monitor Wage-tariff Monitor Net monthly wages, full-time workers Net hourly wages
Women –0.159 –0.162 –0.176 –0.186 –0.099 –0.110 –0.115 –0.136
Potential experience (0.006) 0.021 (0.008) 0.022 (0.012) 0.018 0.014 0.019 (Potential experience)2/100 (0.002) –0.039 (–0.003) –0.041 (–0.009) –0.031 (–0.014) –0.035
Years spent in school 0.086 0.089 0.092 0.099
Vocational training school 0.128 0.148 0.141 0.153
Secondary school 0.279 0.350 0.293 0.344
Higher education 0.701 0.718 0.755 0.802
Central Hungary (0.065) 0.244 (0.065) 0.241 (0.022) 0.190 (0.019) 0.187 Central Transdanubia (0.09) 0.165 (0.094) 0.164 (0.05) 0.141 (0.051) 0.142 Western Transdanubia (0.048) 0.131 (0.051) 0.133 (0.096) 0.114 (0.097) 0.118 Southern Transdanubia (0.021) 0.090 (0.023) 0.086 (–0.016) 0.109 (–0.016) 0.106 Northern Hungary (–0.048) (0.039) (–0.045) (0.037) (–0.087) (0.054) (–0.087) (0.052) Northern Great-Plain –0.085 0.090 –0.087 0.091 –0.123 0.091 –0.127 0.092
City 0.135 (0.077) (0.123) (0.067) 0.168 (0.069) 0.157 (0.066)
County centre 0.08 0.072 0.072 0.066 0.063 (0.016) 0.055 (0.013)
Budapest (0.037) (0.008) (0.035) (0.005) (0.077) (–0.017) (0.076) (–0.017)
Private firm –0.195 –0.079 –0.194 –0.068 –0.189 –0.122 –0.19 –0.107
Foreign firm 0.221 0.200 0.222 0.189 0.173 0.213 0.172 0.201
Constant 10.088 9.823 10.839 10.599 6.301 4.650 7.109 5.518
Observations 121272 1417 121272 1417 129756 1512 129756 1512
R-squared 0.32 0.44 0.33 0.45 0.27 0.40 0.28 0.42
Notes: Linear regression models; the dependent variables are the logarithms of the different types of income.
Parameters in brackets are not significant at 5 percent. Robust standard errors.
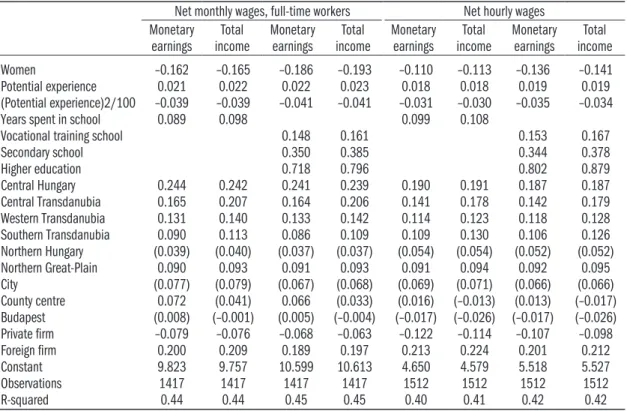
Table A1.4: Net monthly wages and net monthly total incomes.
Results of Mincer-type regressions. Tárki Monitor, 2003
Net monthly wages, full-time workers Net hourly wages Monetary
earnings Total
income Monetary
earnings Total
income Monetary
earnings Total
income Monetary
earnings Total income
Women –0.162 –0.165 –0.186 –0.193 –0.110 –0.113 –0.136 –0.141
Potential experience 0.021 0.022 0.022 0.023 0.018 0.018 0.019 0.019
(Potential experience)2/100 –0.039 –0.039 –0.041 –0.041 –0.031 –0.030 –0.035 –0.034
Years spent in school 0.089 0.098 0.099 0.108
Vocational training school 0.148 0.161 0.153 0.167
Secondary school 0.350 0.385 0.344 0.378
Higher education 0.718 0.796 0.802 0.879
Central Hungary 0.244 0.242 0.241 0.239 0.190 0.191 0.187 0.187
Central Transdanubia 0.165 0.207 0.164 0.206 0.141 0.178 0.142 0.179
Western Transdanubia 0.131 0.140 0.133 0.142 0.114 0.123 0.118 0.128
Southern Transdanubia 0.090 0.113 0.086 0.109 0.109 0.130 0.106 0.126
Northern Hungary (0.039) (0.040) (0.037) (0.037) (0.054) (0.054) (0.052) (0.052)
Northern Great-Plain 0.090 0.093 0.091 0.093 0.091 0.094 0.092 0.095
City (0.077) (0.079) (0.067) (0.068) (0.069) (0.071) (0.066) (0.066)
County centre 0.072 (0.041) 0.066 (0.033) (0.016) (–0.013) (0.013) (–0.017) Budapest (0.008) (–0.001) (0.005) (–0.004) (–0.017) (–0.026) (–0.017) (–0.026)
Private firm –0.079 –0.076 –0.068 –0.063 –0.122 –0.114 –0.107 –0.098
Foreign firm 0.200 0.209 0.189 0.197 0.213 0.224 0.201 0.212
Constant 9.823 9.757 10.599 10.613 4.650 4.579 5.518 5.527
Observations 1417 1417 1417 1417 1512 1512 1512 1512
R-squared 0.44 0.44 0.45 0.45 0.40 0.41 0.42 0.42
Notes: Linear regression models; the dependent variables are the logarithms of the different types of income.
Parameters in brackets are not significant at 5 percent. Robust standard errors.
2. DYNAMICS OF INTER-FIRM WAGE DIFFERENTIALS Gábor Kőrösi
Wage dynamics is an obviously important issue both for the employer and the employee. Until now the employee side was emphasized: wage differentials among Hungarian individuals and groups of employees have been extensively studied. This chapter analyses the factors determining inter-firm differences in average wage rates.
Firms react to changes in the corporate environment, and they adjust their behaviour to the new circumstances. A company simultaneously decides on several factors such as changes in the technology, production level, employ- ment and wages, although the implementation of these decisions may have different time horizons. For example, wage rates usually change at predeter- mined dates, conditional on agreement with trade unions or the company work council. Nevertheless, wage dynamics is inherently linked to other de- velopments at the firm and in its competitive environment.
Company level wage decisions typically concern the average wage and the level of dispersion around it. Thus it is inherently different from a Mincerian human capital model explaining wage differentials among individual employ- ees. The human capital model measures how individual skills are valued in the labour market, relative to a reference group. Obviously, the two levels change consistently: for example, company level average wage may change when the employment structure changes at the firm. Corporate wage decisions influ- ence average wage without shifts in employment structure.
Wage dynamics are analysed from a large panel of annual corporate fi- nancial accounts, covering the period between 1992 and 2003.6 The dataset contains 2356 observations for 1992. The sample size increases year by year, and by 2003 it covered 20076 firms. Sampling probability increases by firm size; thus, 65–77 percent of corporate employment is covered by the sample in each year. Coverage exceeds 80 percent in manufacturing employment in all years, but is more than 60 percent in other sectors, too.7
There is a substantial inter-firm dispersion of mean annual wages (per per- son). An important part of this dispersion shows up as regional wage dif- ferences. For example, the mean per capita wage of the corporate sector was
6 The dataset also contains ob- servations from previous years.
Those are used for lagged values and as instrumental variables.
7 Kőrösi (2005) provides detailed information on the characteris- tics of the sample.
more than twice as high in Budapest than in Bács-Kiskun county: 1936 vs.
9438 (wages + premiums). The prominence of Budapest is best reflected by the fact that even the highest county average (1309, Fejér) was below the na- tional average wage (1315) in the corporate sector.
Other classifications show similarly substantial differences in wages at groups of firms. Ownership seems to strongly influence wages: domestic pri- vate firms paid 1134, state-owned enterprises 1782, while foreign owned com- panies 2082 on average. Compared to these differences, sectoral dispersion is much smaller, at least if we look at a high level of the classification. When looking at differences in sectoral wage levels, concentration seems to be the most important factor: the mean wage is much higher in sectors with a very small number of firms. For example, the average wage at the five firms of the Extraction of crude petroleum and natural gas (NACE 11) sector was 3184, while the 20 firms of the Insurance (NACE 66) sector paid 5436 on average.
This suggests that sectoral concentration influences wage determination.
Most of these differences in average wages persisted over time, and they seem to tell an interesting story on their own. Still, we are interested in the dynamic process of corporate wage determination, in the importance of the factors driving the substantial dispersion in wage setting, and in the possible temporal changes in corporate wage policies, rather than in the above raw figures. Several alternative theoretical explanations were suggested in the lit- erature for explaining differences in corporate wage setting. We embedded the driving factors of the alternative theories into a uniform wage model, also allowing for the interactions of various terms.
Literature survey
The wage curve hypothesis of Blanchflower and Oswald (1994) offers a plau- sible explanation for the regional dispersion of average wages. They suggest that differences in regional unemployment rates strongly influence wage set- ting in the corporate sector. Köllő showed in the 2002 volume of the Hun- garian Labour Market the fast growing role of local unemployment in wage setting in the early 1990’s. Regional unemployment exerted an increasingly negative effect on wages in the competitive sectors.
Nickell and Wadhani (1990), in a seminal paper on British corporate wage determination, developed a dynamic adjustment model, where firms share the yields of productivity gains with their employees. This rent sharing is condi- tional on the financial position of the firm, as well as outside factors, e.g., the unemployment rate. Thus, the efficiency of corporate activities becomes one important factor in the bargaining process between the management and the employees. Following the Nickell and Wadhani (1990) model, many empiri- cal studies analysed the importance of insider power in corporate wage de- termination. One major explanatory factor of inter-firm wage dispersion is
8 All figures are annual wages, including premia, in HUF 1000 in 2003.
productivity. Trade unions usually can successfully refer to productivity gains at wage negotiations, and management typically is ready to share the yield of efficiency gains with employees.
Nickell et al. (1994) extended the previous model, incorporating the ef- fect of variables describing the intensity of product market competition and market position of the firm into the wage equation. They demonstrated that the favourable market position was also subject to a similar bargaining, and market power had a positive impact on wages in Britain. This positive impact also depended on firm size: trade unions were stronger at large firms, and thus, they had a stronger bargaining power against the management.9 Dominant firms were less likely to use unemployment pressure for limiting wage growth, thus making the wage curve effect conditional on firm size.
A well-known and robust result of Hungarian labour market studies is that the ownership of the employer plays an important role in wage differentials at employee level, and that cannot be attributed to standard explanatory vari- ables of the human capital model. Kertesi and Köllő (1997) and (2001) or Köllő (2002) also showed that ownership structure changed the effect of other factors determining individual wages: while wages were strongly influenced by firm size at foreign-owned companies, productivity differences were more important at domestic firms. Foreign-owned companies paid relatively larger wage premium in low-wage sectors; thus, sectoral wages are less dispersed at foreign-owned employers than at domestic ones. They attributed a substan- tial part of ownership related sectoral wage differences to this relative advan- tage of low-wage sectors.
Ownership-related differences were also observed in some other economies.
Dobbelaere (2001) showed that foreign-owned firms paid higher wages in Bulgaria, but those wages were independent of the efficiency, thus, they did not share rents with their employees. Wages at state-owned enterprises, how- ever, were strongly linked to productivity.10
This analysis differs from previous Hungarian wage studies in an important aspect: we look at wage dispersion at the firm, rather than at the employee level. The disadvantage of analysing average company wages is that assum- ing homogeneous labour we lose the human capital component of wage set- ting. However, due to the constraints of the available data, that is necessary for analysing the dynamic adjustment process of wage setting, as we cannot identify individuals over time in our sample. The most important deficiency of the human capital based wage models is that they are static, thus unable to handle the adjustment process. One major feature of transition economies is that agents have to cope with much larger shocks than in mature market economies, thus adjustment to changed circumstances is essential.
Several empirical papers, written on corporate wage setting in transition economies, used the above-formulated assumptions. Polish wage determina-
9 Several alternative mecha- nisms have been suggested for explaining why firm size (e.g., measured by the number of em- ployees) may have a positive in- fluence on corporate wages, c.f., Bayard and Troske (1999).
10 Foreign-owned firms seem to have different wage setting strat- egies in different transitional economies. Damijan and Kostevc (2002) analysed whether foreign investment had a positive effect on wage catch-up in transition economies. Their main result was heterogeneity: while they found a strong positive impact for Bulgaria and Hungary, the relationship was reversed in Es- tonia and Romania, and FDI had no significant effect on wages in Slovenia.
tion was especially extensively analysed. Grosfeld and Nivet (1997) and (1999) estimated wage equations for the period 1990–4, using a Polish corporate dataset.11 They found productivity as the main driving variable of inter-firm wage differentials. Sharing productivity rents varied with ownership struc- ture, and was strongly asymmetric: while productivity losses had no impact on wage setting, productivity gains significantly increased wages.
Christev and Fitzroy (2002) extended the above analysis of Polish wage determination to the period 1994–7, using a similar panel dataset. They paid special attention to the consequences of the privatisation process. Following the logic of the rent-sharing model, they analysed the wage effect of chang- es in productivity. Their results largely confirmed the previous findings, but they also found a significant wage effect of declining productivity in this later period, although rent-sharing remained asymmetric. However, the rent-shar- ing rules were different at fully privatised companies and at firms still having substantial state ownership.
Mickiewicz et al. (2005) further extended the scope of analysis. They used data from the period 1998–2001, but the more important extension is substantial: they tested several alternative hypotheses on the wage setting behaviour of Polish enterprises. They refined the analysis of the ownership structure: they not only distinguished majority private or state ownership, but also differentiated private ownership, whether the firm was privatised or de novo private enterprise. They also incorporated labour market conditions (e.g., regional unemployment or employment rates) into the model, which had an atypically strong effect on corporate wage setting behaviour, even in the short-run. These coefficients were way higher than any comparable effect estimated for mature market economies. Corporate efficiency had a relatively smaller effect on wages than outside labour market conditions. Private firms were especially unwilling to share the rents from productivity gains with their employees, and that was true for both privatised and de novo firms. Except for this minor difference, ownership did not seem to have a measurable ef- fect on corporate wage determination after taking labour market conditions into account. It may thus happen that the previously observed strong owner- ship effect (Grosfeld and Nivet [1997] and [1999], and Christev and Fitzroy [2002]) was due to the omission of these labour market conditions. It appears that the probability of private investment was strongly influenced by the la- bour market conditions, and as variables describing external conditions were omitted, ownership variables proxied their effect. The contradicting results of a simpler model in Bedi and Cieslik (2002) also suggest the endogeneity of the ownership structure. They interpreted their results supporting efficiency wage hypothesis, but their much stronger rent-sharing most probably is bi- ased by the oversimplified model specification. However, all Polish studies found a strong, sometimes extremely intensive rent sharing. Furthermore
11 All Polish wage studies used very similar corporate datasets, based on financial reports of companies listed at the Warsaw Stock Exchange. This is a highly and very specially selected sam- ple: most firms are large, and all firms started market oriented reorganisation, including at least partial privatisation prior to stock exchange listing. Even though some of these firms initially were in majority state ownership that never meant full state control: these firms already had some important private owners. Thus, this sample is far from being representative of the population of Polish firms, and empirical evidence derived from this information may be subject to strong selection bias.
an important lesson from the Polish empirical work is that corporate wage setting behaviour changed rapidly and substantially over time as transition progressed.
Hypotheses on Hungarian wage determination
The model specification, used for analysing the determinants of inter-firm wage differentials, is based on the surveyed theoretical and empirical litera- ture. The model explains the average real wage (incl. all premia) at the firm with a dynamic adjustment model. Such a dynamic model gives a more real- istic description of corporate behaviour: the firm, taking into account devel- opments in the circumstances, re-optimises its activity level, and decides on the necessary changes, thus adjusting its behaviour, including wage setting, to the new situation. We assume that this adjustment cannot be immediate on the labour market: rigidities of labour market regulation, the cost of ad- justment, and the institutional framework of inside bargaining jointly hinder the adjustment to the equilibrium wage (which is the marginal product of employed labour).
The first assumption of the model is that the company may share the rent of productivity gains (Nickell and Wadhani, 1990).12 This rent sharing may be influenced by the size of the firm, which is measured by the number of employees (Bayard and Troske, 1999). External product and labour market conditions may also influence rent sharing: strong competitive pressure may limit the willingness, indeed the ability of the firm for any bargain, while dominant position may make the firm more pliable13 (Nickell et al., 1994).
Firms in a favourable position on foreign markets, with high export com- mitments,14 may react to wage demands with larger flexibility (Abowd and Lemieux, 1993). Ownership structure may also impact the wage policy of the firm. Substantial local unemployment may limit the bargaining power of employees, forcing them to accept lower wages (Blanchflower and Oswald, 1994). All these factors may interact with each other. For example, in the in- itial model specification ownership, firm size, market position, or competi- tive pressure may influence rent sharing, or, indeed, the effect of any other factor. Obviously, the initial specification incorporated factors without real measurable impact on the wage dynamics. Irrelevant factors, interactions were eliminated using standard statistical hypothesis testing. This statisti- cal analysis was used for identifying the most important factors determining wage setting in Hungarian firms.
As output, employment and wage decisions are the consequences of the same optimization process at the firm, wage, employment, output, exports, productivity, and all related variables (for example, market share, or various interactions) were treated as endogenous variables. Differenced lagged vari-
12 Rent sharing may be consist- ent with efficiency wages: the company may want to attract better (i.e., more productive) labour by paying higher wages.
In this case the higher wage may only reflect the market return of the higher human capital of the new employees, which may be the precondition for (further) productivity improvements.
Thus, the positive wage effect of productivity growth may just be the consequence of the heterogeneity of labour. This means that productivity must be treated endogeneously even if we disregard the simultaneous nature of corporate decisions.
13 Competitive pressure was measured by two proxies: the market share of the firm within its four digit sector, and market concentration, also within four digit sectors.
14 Foreign exposure is measured by the share of export revenues within total output.
ables and sectoral indicators (related to the detailed sectoral classification) were used as instruments during the GMM estimation.
I also tested the homogeneity of corporate labour market behaviour with respect to differences over ownership, region, sector, size and time.15 I regu- larly found significant structural breaks according to sector and time, while wage setting almost always proved to be homogeneous with respect to the other factors. Thus, despite the fact that the statistical analysis was based on a panel dataset, I had to estimate annual sectoral wage equations, i.e., the same model was re-estimated for all sectors and for all years in the sample. The fi- nal model specification included the explanatory variables that proved to be significant in at least some of the estimated equations.16
Results
The first important result is that the wage setting behaviour of Hungarian firms was homogeneous with respect to the ownership structure and size, un- like in some other transition economies, e.g., in Bulgaria or Poland. That is also an important difference to previous Hungarian results, which were based on an augmented human capital model, using individual employee data. Owner- ship did influence the returns to human capital, but apparently these effects offset each other, thus they are not discernible at the company level. It is not surprising that corporate wage setting behaviour changed over time: transi- tion is the period of substantial behavioural adjustment. The general picture is that behavioural differences in wage determination in any year are related to the major technological differences, represented by the main sectoral clas- sification.17 It is interesting to note that sectoral differences in the raw wage data were much smaller than those related to ownership or region, still, the real behavioural differences are related to sector.
The empirical model specification was usually acceptable for the different annual sectoral models, except that they included many insignificant coef- ficients. The initial model specification consisted of 45 coefficients. Not sur- prisingly, the estimates were strongly influenced by multicollinearity among the variables: while most coefficients were individually and jointly insignifi- cant, the joint omission of all insignificant explanatory variables substantially changed some of the remaining coefficients. Thus, the final specification still included some coefficients, which were insignificant, but their omission would have changed the results. Also, explanatory variables, which proved to be sig- nificant in some cases, were kept in the model estimated for all subsamples, thus ensuring the comparability of the empirical models.
Lagged variables, especially the lagged wage, were essential explanatory fac- tors of the regression models. That indicates the importance of the dynamic adjustment process. Adjustment to the changed conditions was almost im- mediate in the “golden age” of very rapid growth in the period 1996–2000.
15 Obviously, when testing for a structural break, some cor- responding variables had to be omitted. For example, when test- ing ownership, the ownership related variables were excluded from the model.
16 Occasionally, there were also significant coefficients for the included variables in some estimated equations. As we esti- mated the same model over vari- ous samples (sectoral estimates for each year separately), it is no surprise that some coefficient es- timates seemed to be significant.
If we use 0.05 significance level, we expect that one in twenty coefficient estimates will seem to be different from 0 even if the true value is exactly 0. Thus, rarely significant explanatory variables were ignored.
17 Sectoral wage negotiations are almost unknown in the Hun- garian competitive sector, thus that cannot explain the sectoral heterogeneity of wage setting.
In this period the wage model could be simplified to a differenced equation, where wage changes are a function of changes in productivity and other vari- ables. Adjustment was hindered by the larger and less predictable shocks be- fore 1996 and after 2000, but was still much faster than in developed market economies. (C.f., Surányi and Kőrösi, 2003.)
Usually, productivity is the single most important explanatory variable of wage determination. The short-run coefficient is almost always significantly positive. The long-run elasticity is frequently uncertain. Its large standard error is mostly due to the rapid adjustment: in most cases it is the change of productivity rather than its level, which drives the development of inter-firm wage differentials. The short-run productivity coefficient is large by interna- tional comparison: a one percent gain in productivity may frequently yield up to half a percent wage increase, ceteris paribus, although with significant sectoral and temporal variations. This elasticity is much larger than the val- ues observed for mature market economies (typically not larger than 0.2), al- though much smaller than some Polish estimates (up to 2). Rent sharing was the largest and the most stable in some labour intensive manufacturing sectors (e.g., textile, clothing and footwear). Firms in more capital intensive manu- facturing sectors, such as the engineering and chemical industries, were less willing to share the benefits from the rapid productivity growth: the elastic- ity was insignificant in some years, and was usually smaller than in the light industries. The willingness to share the rent of productivity growth with their employees declined in all manufacturing sectors except in the light in- dustries, although with a very large variation. This trend is less visible in the non-manufacturing sectors, but those were usually characterised by lower rent sharing, except for services.
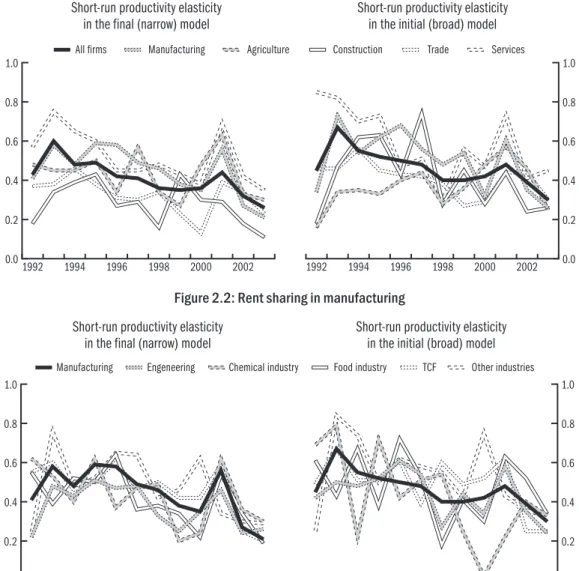
Although variables representing the market position of the firm, or com- petitive pressure were typically insignificant, both individually and jointly, they still frequently had a substantial impact on the value of the rent-sharing coefficient. Figure 2.1 depicts the development of short-run productivity elas- ticities, i.e., rent-sharing for the major sectors, while Figure 2.2 depicts the same for selected manufacturing sectors. The left-hand graph shows the time path of these coefficients after omitting the insignificant variables in both fig- ures, while the right-hand one shows the same values from the broad model, including all variables describing market position and competitive pressure.
The omission of these apparently completely irrelevant variables clearly biases the estimated rent-sharing coefficient downwards in a large part of the sam- ple period. Although market concentration or strong competitive pressure do not directly influence corporate wages, they limit the ability and/or will- ingness of the company to share the proceeds of productivity growth with its employees. (Still, even these downwards-biased estimates are high compared to the estimates for mature market economies.)
Figure 2.1: Rent sharing in major sectors Short-run productivity elasticity
in the final (narrow) model Short-run productivity elasticity in the initial (broad) model
Figure 2.2: Rent sharing in manufacturing Short-run productivity elasticity
in the final (narrow) model Short-run productivity elasticity in the initial (broad) model
0.0 0.2 0.4 0.6 0.8
1.0 All firms Manufacturing Agriculture Construction Trade Services
2002 2000 1998 1996 1994
1992 0.0
0.2 0.4 0.6 0.8 1.0
2002 2000 1998 1996 1994 1992
0.0 0.2 0.4 0.6 0.8 1.0
Other industries TCF
Food industry Chemical industry
Engeneering Manufacturing
2002 2000 1998 1996 1994
1992 0.0
0.2 0.4 0.6 0.8 1.0
2002 2000 1998 1996 1994 1992
The role of the ownership structure was also extensively studied. Neither own- ership variables, nor their interactions with other factors were significant in the initial specification. All ownership related variables could be omitted from the final specification; their omission did not change the statistical proper- ties of the estimated model. Still, I revisited the role of ownership after final- ising the specification for empirical analysis. Table 2.1 summarizes the for- eign ownership coefficients and their significance (LM-test), when the final specification was augmented by the foreign ownership indicator. Although the foreign ownership almost always has a positive effect on wages, when sig-