We examine the extent of the companies' social service and infrastructure and the companies' assessment of the quality of the public infrastructure and the regulatory environment. 8 See appendix 1 for the legal basis for the transfer of social assets from the companies to the municipalities.
Survey Design and Implementation and Sample Description
Survey Design and Implementation
The sample formed in this way should reflect the size structure of medium and large industrial companies in the region. Finally, a cleaning program was designed to reveal inconsistencies between the different parts of the questionnaire.
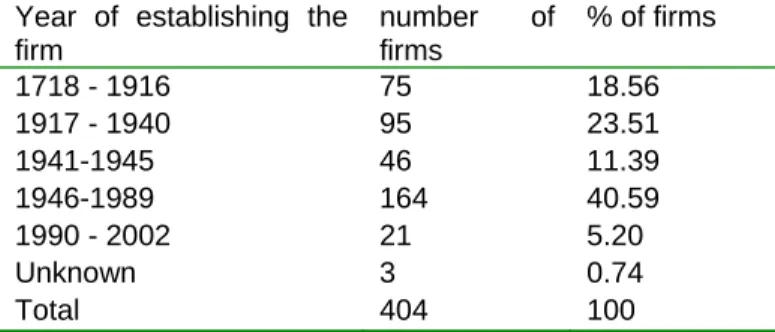
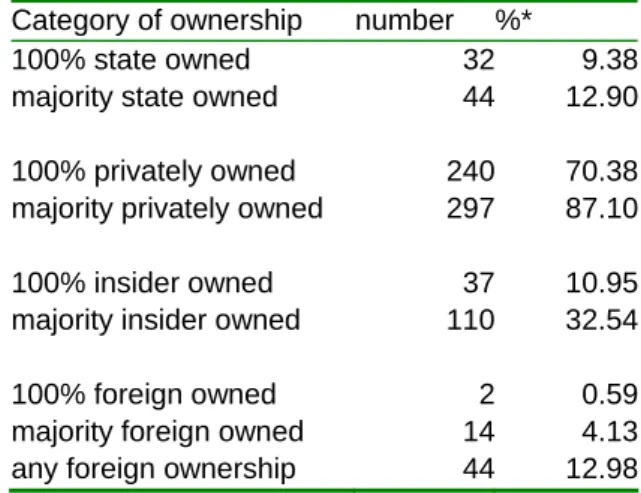
Sample description
Finally, the distribution of the companies in the sample by size (number of employees) is shown in Table 3.1. According to table 3.3, almost 7% of companies are in the form of a state-owned enterprise (unitary).
Firms and the provision of social services in Russia 1. Social assets and services: within or outside the firm
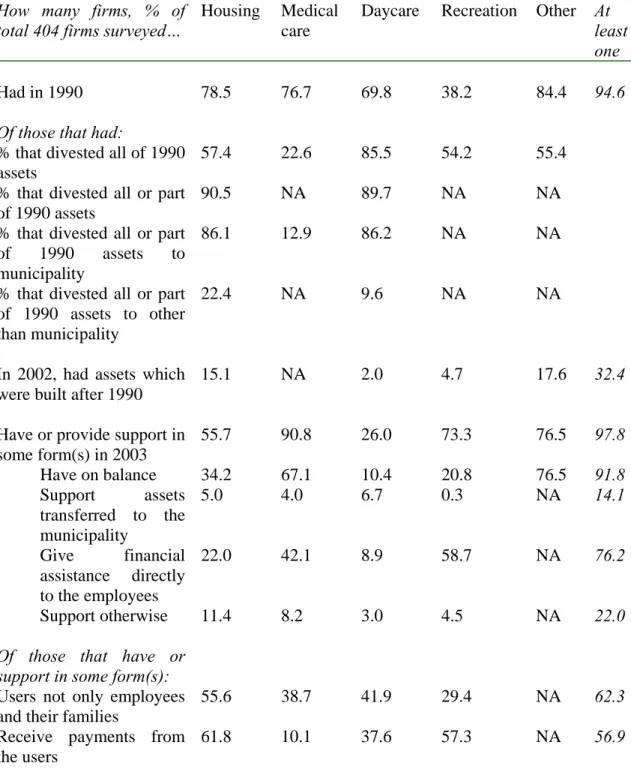
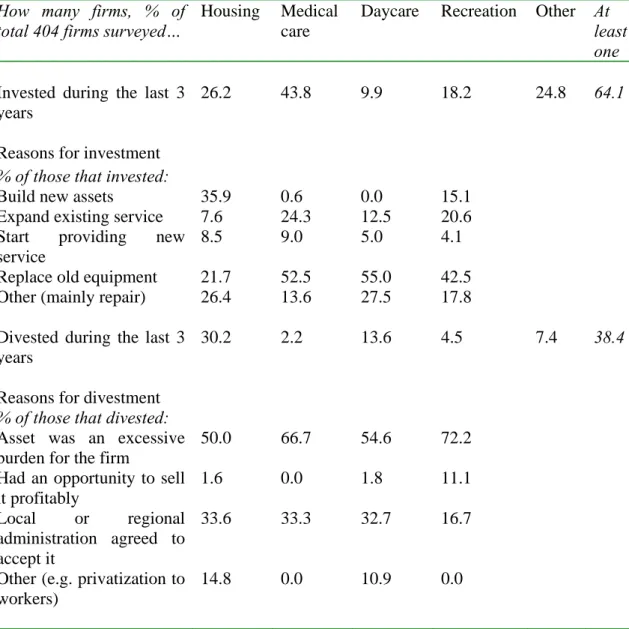
Provision of social services in 1990-2003
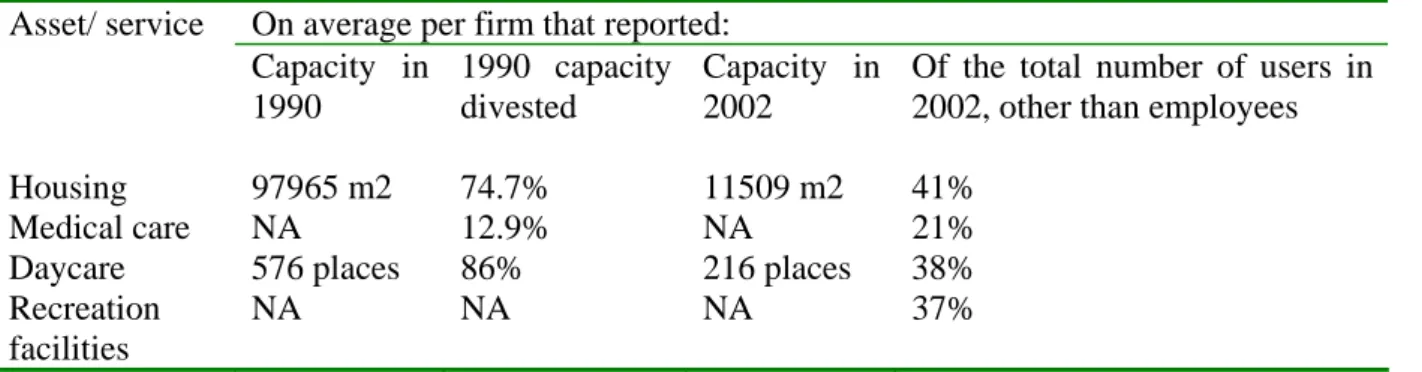
It is also surprising that in more than half of the companies that offer this benefit, the users are not only employees and their families. Finally, 18% still operate pioneer camps and 16% cultural facilities, which is less than half of the companies engaged in this activity in 1990.
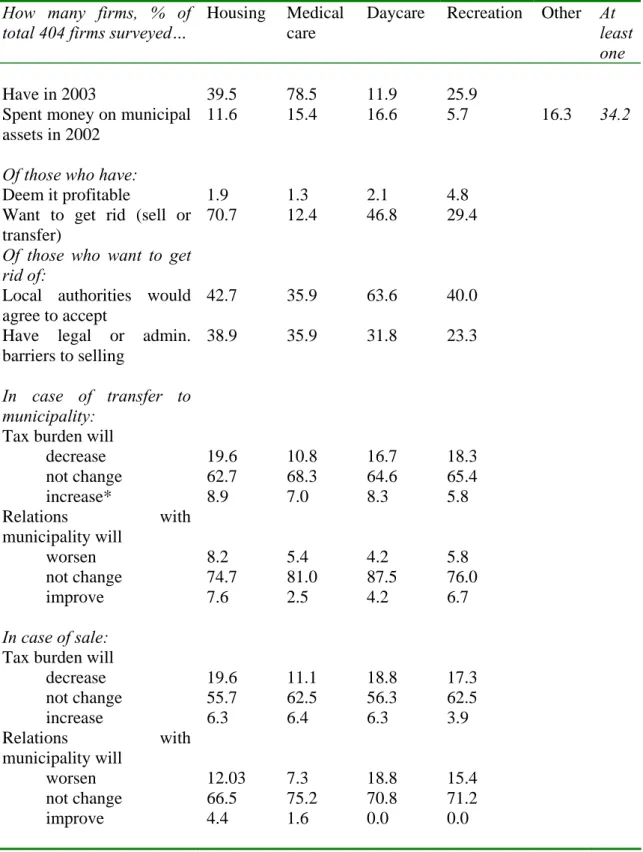
Trends in social assets and service provision
Of the companies that provided certain services in 2003, less than 5% of general managers per asset considered these services profitable. In relation to their wage bill, social services seem more important for the less educated part of the population.
Firms and infrastructure
Heating
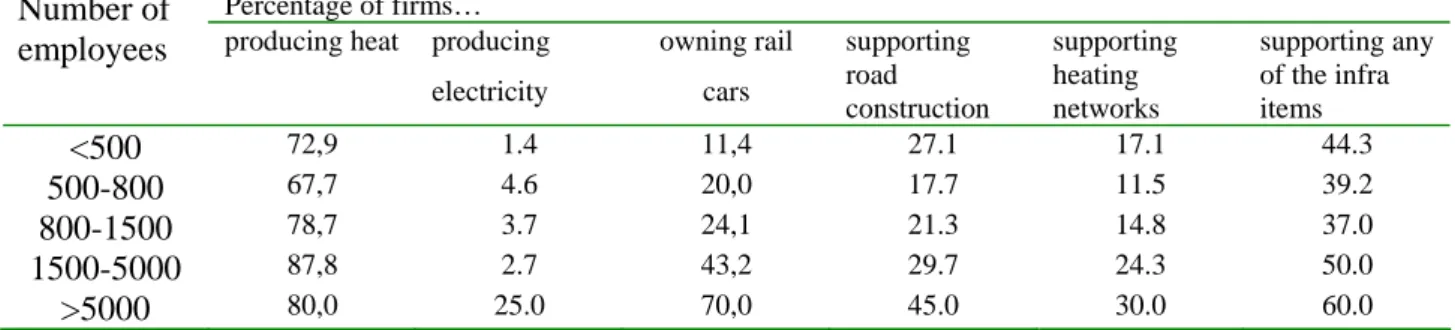
In conclusion, the companies' social conscience, if any, appears to be at least partially coerced or mandated by their relationships with the municipality. Companies also seem increasingly willing to retain their employees by offering part of the compensation package in the form of fringe benefits rather than just monetary salaries. Three quarters of the companies surveyed produce heat, and the majority cover all their own needs.
Over half of the 300 firms that produce heat also sell it to external users, mainly local housing entities and other firms in the same city. Approximately one third of firms that sell heat do so for commercial reasons (ie it makes a profit for the firm). For most firms the main reasons were traditions or social responsibility as the enterprise may be the only heating provider for its neighborhood.
Mainly as a result of this self-sustaining production, interruptions in heat delivery in 2002 occurred in only 10% of the enterprises interviewed and on average they were not considered a significant obstacle to firm operations (Table 5.5). Less than 60 % of the managers think their tax burden will remain unchanged in the event of a sale or a transfer of their heating boilers (see Table 5.4).
Electricity
The median duration of all interruptions in the heat supply during the year 2002 was one week. Several large companies continue to supply heat to their neighborhood, even though it does not generate any profit for them. The reason is clearly that the district heating systems are built around the local large power stations, and the companies cannot afford to let their village freeze.
More than a third of companies had experienced interruptions in electricity supply in 2002, and half of these companies believed that the interruptions had a significant impact on their operations (Table 5.5). The chief engineers estimated that losses due to interruptions in electricity supply were extremely small. Second, our findings may mean that the existing electricity generation and distribution system works so well that companies do not need to consider alternatives.
Thirdly, it must be remembered that we still do not know about the connections between large companies and local energy companies. Large companies can not only be large customers, but also significant owners in some local energy companies.
Other items of infrastructure
Russian firms do not seem to consider the quality of the infrastructure to be a major obstacle to their operations. A distinguishing feature from most OECD countries is that many firms contribute directly to the construction and maintenance of public infrastructure. In total, 43% of surveyed enterprises provide some form of support for one or more types of public infrastructure listed in table 5.7.
Since on average more than 60% of the companies' transport needs are covered by road transport and only about 37% of their needs are covered by railways, the perceived low quality of roads may be an indication that transport is somewhat problematic for adults. firms. Given the vast distances and inherited industrial geography in Russia, the transportation of both inputs and outputs is an important issue for large enterprises. More than 40% of respondents said that their firm has its own railway lines, with 49 firms owning more than 10 km of rails.
Every sixth company owns its own railway wagons, but only a few own significant quantities (i.e. over 10 wagons). As would be expected, the average size of a firm that owns railcars or railroads is significantly larger than the sample mean.
Firms and regulatory environment
Overall summary statistics
At many of the companies surveyed, regulatory agencies occupy a significant portion of top management's working time (Table 6.2). Directors of more than 50% of companies spend more than two weeks a year talking to authorities about public infrastructure issues. Directors in about a third of companies spend more than two weeks a year dealing with each of the following authorities: licensing, certification and customs.
The chief engineer spends more than two weeks per year dealing with fire and SES inspections in 30 and 26% of firms, respectively. The personnel manager allocates more than two weeks of his/her time to labor regulation agencies in almost half of the companies. Almost half of the firms in our sample were granted tax extensions during the three years prior to the survey (Table 6.5).
Ten, eight and six% of the firms thought that they were very influential in setting laws and regulations at the local, regional and federal levels respectively. Twelve, fourteen and twenty-one% of the firms answered that their competitors are very influential in setting laws and regulations that affect their own business at the local, regional and federal government levels, respectively.
Size and regulatory environment
Thus, the few firms that receive direct government support in our sample are likely to receive it in different forms. The firms that call themselves influential at one level of government are both very likely to think that they are influential at other levels of government and to think that (although significantly less so) their competitors are also influential. In our sample, as one would expect, size matters a lot for firms' actual involvement in capture, as well as for their perceptions of whether or not other firms have an influence on the institutional environment, especially at the municipal and regional levels.
Regional variation and regulatory environment
Performance, investment, finance, competition, and the relation to housing and heating
- Sales and profits
- Investment and finance
- Liquidity
- Direction of sales
- Competition
- Barter
- Interactions with housing and heating
There are no noticeable differences in the number of profitable enterprises between the federal districts in 2002. There are also some differences between federal districts: companies in the south, the Volga region and the Far East receive loans less often. Companies in the North-West and Far-East Federal Districts are relatively more export-oriented (Figure 7.4).
On the other hand, there is much more industrial variation in the market share (figure 7.5). Companies in the power and fuel, building materials and food processing sectors report having the smallest share of the national market. The median number of competitors in the companies' main markets (as defined by the companies themselves) is 10 (average 33, maximum 500).
Among the federal districts, demand is reportedly the least elastic in the Volga region (38% of companies said demand would fall by more than 10%). On the other hand, the more elastic the demand, the fewer companies support heating in the local area.
Concluding remarks
Based on these findings, it is not clear which types of firms provide relatively more housing and heating. Some correlations (ownership, liquidity) tend to show that traditional types of firms provide these services more often. On the other hand, the firms that provide these services do not seem to suffer it in terms of profit.
How do you think, to what extent, does your company or other structures (domestic competitors, foreign competitors, trade unions) influence the process of creation and approval of legal and regulatory acts at the municipal/regional/federal level. Figures show percentage of companies that rate influence as high). If firm owned, percentage of firms that provide any form of support to maintenance or construction of municipal heating.

Legal Basis for the Transfer of Social Assets to Municipalities 24
The adoption of the Government of the Russian Federation No. 235 on March 7, 1995 aimed to clarify these issues. It expanded the list of assets that could not be privatized and should be transferred to municipalities (mainly infrastructure objects, such as sewage and water supply systems, boilers, heat and electricity networks, servicing infrastructure departments and social objects, etc.). At the time when the mass privatization was already close to the end, the law defined that objects to be transferred to the municipality should be included in the privatization program as a separate list.
The adoption of a privatization plan for a company then effectively initiated the process of transferring these assets to municipal ownership. Additional problems and issues that arose during the process of municipalization of social assets were resolved through several minor legal acts issued by various government agencies at all levels of government and in some cases through courts.
Survey preparation: questionnaire and pilot interviews
3 companies in Nizhnyi Novgorod, 4 companies in Vladimir in chemicals, machine building, food, textile, printing and transport. Main results: the social sphere is still important in the companies, the infrastructure is smaller, all financial and accounting information must be asked to the accountant. Main results: Reduction of the number of accounting questions in particular, design of a screening procedure to be used with the day-to-day manager to find the right people to answer the other parts.
After several rounds of revisions, GfK Russia continued to test the questionnaire in a few companies before launching the final version in April 2003 for interviewer training and subsequent rollout of the survey in the regions. The Goskomstat database does not contain employment information for the year 2000 for the companies in this region.
Costs and Income from Social Services in 2002 (accounting figures relative to wage bill, percentages)