DOCTORAL (PhD) THESIS
GERGŐ GYALOG
KAPOSVÁR UNIVERSITY
FACULTY OF ECONOMIC SCIENCE
2019
2
KAPOSVÁRUNIVERSITY FACULTY OF ECONOMIC SCIENCE
Doctoral School for Management and Organizational Sciences
Head of Doctoral School:
PROF. DR. IMRE FERTŐ Doctor of Sciences
Supervisor:
DR.HABIL.BÉLA CSUKÁS Candidate of Sciences
MODEL-BASED ANALYSISOF HUNGARIAN POND AQUACULTURE
Written by:
GERGŐ GYALOG
KAPOSVÁR 2019
DOI: 10.17166/KE2019.007
Content
1. BACKGROUND OF THE RESEARCH, OBJECTIVES ... 1
2. MATERIALS AND METHODS... 3
3. RESULTS ... 8
3.1. Econometric model ... 8
3.2. Results of the pond farm simulation model ... 11
4. CONCLUSIONS ... 19
5. NEW SCIENTIFIC RESULTS ... 22
6. PUBLICATIONS IN THE FIELD OF THE DISSERTATION ... 24
1
1. BACKGROUND OF THE RESEARCH, OBJECTIVES
Aquaculture has been the fastest growing food production sector in the world since 1980, with an annual growth rate of 8.2% far above the average annual growth rate of 2 to 4% in other agricultural sectors. However, as a rapidly developing, but also young industry, it is increasingly faced with the global challenges of food production. Demand for food is steadily increasing with rising global population and income, on the one hand, while further increase in food production is constrained by climate change and the scarcity of available water, land and genetic resources, mineral nutrients, energy sources, as well as the increasingly stringent regulation of their use, on the other. The tension between food demand and constraints in supply encourages farmers to make more efficient use of resources and optimize input management.
Traditionally, the development efforts are supported by disciplinary fields of agricultural research, but recently interdisciplinary research activities involving economic component also contribute to this process. In addition to this, recent development of engineering modelling, agro-informatics, increasing amount of data from research and industrial farming systems, enabled model-based research to contribute to the understanding food production systems.
Apart from global challenges, the European carp farmers face region specific and technology specific problems. Unlike marine aquaculture, pond aquaculture did not reduce unit production costs by exploiting economies of scale. Using a labour-intensive technology, pond farmers are forced by rapid increase in wages and recent labour shortages to re-think production technology and input management.
2
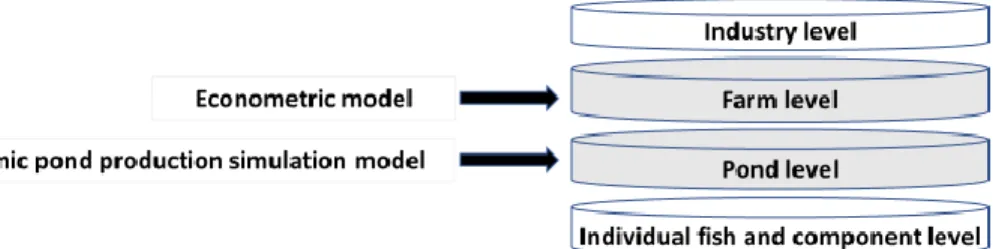
Thus, the general objective of the present work is to use model-based research approaches to determine the optimal input use in Hungarian pond farming both at farm and pond level (Fig. 1).
Figure 1. Potential levels of model-based analysis of pond aquaculture production. The models I used are linked with associated levels shaded.
Connected to my general objective, I set out the following specific aims for my research:
1. By using econometric tools, I analyse the contribution of main inputs of production (current assets, workforce, machinery, ponds) to yields and production growth.
2. I investigate whether economies of scale exist in Hungarian pond farming 3. By developing a dynamic simulation model for biological, technological and environmental processes at pond level, I investigate the impact of different feeding and stocking strategies on carp yields.
4. I use model simulations to identify those pond management strategies i) which minimize unit costs of carp production; and ii) which maximize per- hectare profits
5. In addition, I use the simulation model to quantify the impacts of climate change on carp yields and on economics of carp farming.
3
2. MATERIALS AND METHODS
As described in the previous section, my research was based on two different methodological bases: i) econometric model studies; and ii) a pond dynamic process model exploring the detailed biological and technological relationships.
The farm level data required for the econometric analysis of Hungarian pond fish production has been provided by the Research Institute of Agricultural Economics (AKI) under a research cooperation. Two datasets were used for the parameterization of production functions: (i) data on harvested quantity, stocked biomass, feed use, pond area and employment were available from the official annual production statistics collected by AKI from all farms; ii) machinery data were extracted from a survey which was conducted by AKI in 2014 with the aim of assessing the use of machinery and durable equipment used in carp farming. By matching the two datasets I generated a secondary database containing 51 farms for which both types of data were available.
Following a preliminary analysis, 7 farms were discarded from further research because the net Common carp yields were negative in their case, which implies that these farms are either affected by extreme mortality or specialize in the storage of biomass and market it in summer during the peak price period. In either case, data from these farms must not be taken into account in an econometric model which assumes typical farming technology. As a result, data from 44 farms were used for the quantitative analysis in this study. These farms accounted for 60% of common carp production in Hungary. The selection of input variables for the model was driven by the availability of data, as well as by practical considerations. It was not the intention of this part of research to model pure biological interactions in the production process, rather my main focus was to demonstrate how major groups of production factors such as raw materials, fixed capital (machinery) and labour costs affect
4
productivity. In addition to this, I tried to reduce the number of input variables in order to minimize parameter estimation problems due to multicollinearity.
Due to these concerns I combined inputs representing raw materials, namely feed and stocking material, into one explanatory variable. Similarly, I created one explanatory variable for farm labour, combining data on full-time, part- time and occasional employees. With large machinery equipment I created a combined variable representing four types of machines used for pond maintenance and for the logistics of feeding and livestock. Pond area was the fourth explanatory variable in the model. For the mathematical expression of the production function the most widely used functional form, known as the Cobb-Douglas type, was selected. Two equations were parameterized to model both per-farm production and per-hectare production. The Cobb-Douglas models specified with the variables outlined above can be expressed in logarithmic form as follows:
Ln Yi = α0 + α1 Ln(RMi) + α2 Ln(Li) + α3 Ln(Mi) + α4 Ln(Pi) + εi (CD-1) Ln yi = β0 + β1 Ln(rmi) + β2 Ln(li) + β3 Ln(mi) + εi (CD-2) where Y is the gross production of Common carp per farm, RM is a combined variable for feed and Common carp stocking material inputs (used as a proxy for raw materials), L is the labour input, M represents the large machinery and P is the pond surface, while y, rm, l and m are their respective values calculated on a per hectare basis. The sum of individual production elasticities in Equation (1) is considered a measure of economies of scale: if it is less than 1 then diseconomies of scale will occur; if it is bigger than unity it implies the existence of economies of scale. Models were parametrized using both ordinary least squares (OLS) method and quantile regression method.
In the process model-based approach, in collaboration with my Supervisor’s research group, I implemented the methodology of Direct Computer Mapping based Programmable Structures for modelling and dynamic simulation of
5 pond aquaculture. Basic characteristic of the method is that building elements of various process systems (states and transitions) can be directly mapped onto an executable program code. In Programmable Structures complex process models can be generated automatically from two general state and transition meta-prototypes, as well as from the declaration of the process network (described according to a defined syntax). Local programs can be edited in the graphical interface of the model. Generation and execution of the models are supported by the general purpose declarative kernel of the simulator. A pond farming simulation model was developed to simulate market-size carp production under the assumptions of 7 months long production period, cereal based supplemental feeding and bi-culture stock management. Further model assumptions with respect to technology and input management (e.g.
fertilization, feeding schedule, water management, average weight of carp, etc.) were determined by industry practice and, in some cases, by recommendations of literature. 80 different model simulations were made, so that several technological variants could be analysed: 10 different stocking strategies (from 110 kg/ha to 450 kg/ha) and 8 different feeding levels (1 t/ha and 4 t/ha) were considered.
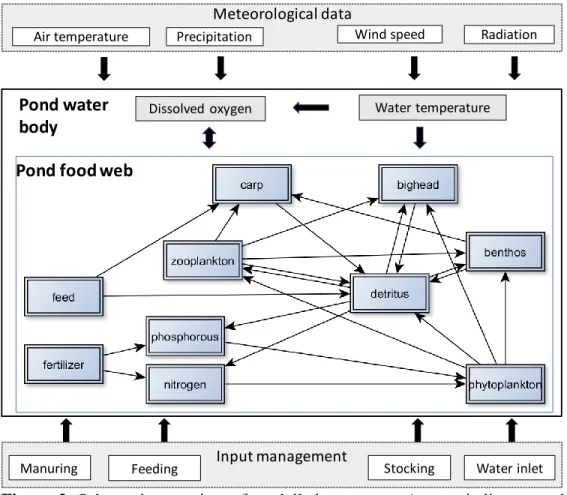
The schematic structure of the model is shown in Fig. 2, demonstrating that the external forcing factors of the model are input management and meteorology.
The model tested for both historic (2006-16) meteorological data and forecasted climate data (2017-2065) generated by the NORESM-1 climate model for the RCP4.5 scenario. Meteorological data referred to a geographic location near Szeged. In the analysis of different climate regimes, the yearly effects were filtered out by calculating 11-year moving averages of model outputs. Current climatic conditions were analysed by averaging model runs for the years 2006-2016, while the effects of the future climate were examined for two time horizons: 2025-2035 (short-run) and 2045-2055 (long run).
6
Figure 2. Schematic overview of modelled processes. Arrows indicate pond food web relationships and environmental impacts.
Applying the method of Direct Computer Mapping based Programmable Structure, we generated the dynamic simulation model of the above described model elements. In this procedure, we described the structure of the pond food web and the linked physical processes. Utilizing this description, as well as the two general state and transition meta-prototypes, we generated the GraphML model, consisting 20 states and 15 transition elements. Finally, we developed the functionality-describing prototypes in form of local programs (for the 8 state 12 transition prototypes), required for model calculations. Regarding transition prototypes, approximately 5-15 equations describe daily changes at each level of the food-web (e.g. phytoplankton, zooplankton, benthos, etc.).
For the state elements we calculated the daily changes of the given element Pond water
body
Dissolved oxygen Water temperature
Input management
Water inlet Stocking
Feeding Manuring
Meteorological data
Air temperature Precipitation Wind speed Radiation
Pond food web
7 (e.g. individual weight and number of carps, dissolved oxygen, etc.), in line with the prescribed daily time step of the model.
The validity of the pond farming simulation model was tested against data obtained from one of the largest Hungarian pond farm, SzegedFish Kft.
Hydrological results (water level, evaporation) were validated for the period 2006-16, while carp yields were validated for 2010-2016.
One of the specific aims of my research was to determine the optimum intensity of feeding and stocking based on the results of the pond farming simulation model. For economic optimization, I considered two alternative objective functions: i) unit cost of carp production (Ft/kg), which was to be minimized; and ii) the profit per hectare (Ft/ha) which was to be maximized.
For the calculation of production costs, the harvested and stocking quantities, as well as the amounts of feed, fertilizer and water use were given by model output. Labour requirement was estimated as a function of production intensity based on the data of the farms involved in the econometric survey. The unit price of each input (including capital costs) was determined on the basis of prevalent market prices. Optimization was done numerically: the simulation model was run for 80 different technological options and, based on the model output, I selected the options that minimize unit cost and also those that maximize the profit per hectare.
8
3. RESULTS
3.1. Econometric model
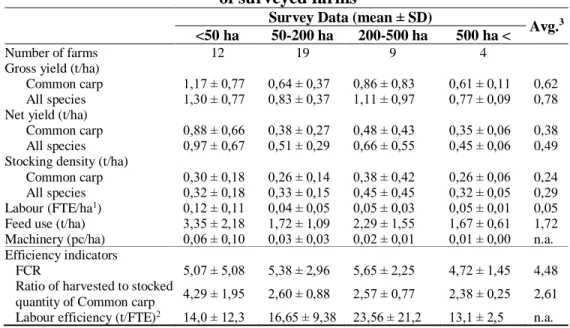
Table 3 presents the yields, the per-hectare input use and the production efficiency of the farms surveyed. These indicators provide an overview on the farming technology and production intensity used by different farm sizes.
Mean values of per hectare input use and yields are higher for smaller farms (<50 ha) and lower for larger farms (>500 ha). Standard deviation is relatively large in the group of the smallest farms, but there is little variation among the large farms. The national industry averages for most indicators, representing the most conventional method of carp farming in Hungary, are very similar to those of large farms (>500 ha).
Table 1. Yields, use of inputs and productivity indicators of surveyed farms
1 Full-time Equivalent (FTE);
2 Calculated as gross production of Common carp per FTE;
3 Industry-level averages are calculated from aggregate data reported for 2014
The OLS estimated coefficients of the production functions are presented in Table 4. The sum of individual production elasticities in Model 1 is 0.97. The delta method t-test shows that this value statistically is not significantly
Survey Data (mean ± SD)
Avg.3
<50 ha 50-200 ha 200-500 ha 500 ha <
Number of farms 12 19 9 4
Gross yield (t/ha)
Common carp 1,17 ± 0,77 0,64 ± 0,37 0,86 ± 0,83 0,61 ± 0,11 0,62 All species 1,30 ± 0,77 0,83 ± 0,37 1,11 ± 0,97 0,77 ± 0,09 0,78 Net yield (t/ha)
Common carp 0,88 ± 0,66 0,38 ± 0,27 0,48 ± 0,43 0,35 ± 0,06 0,38 All species 0,97 ± 0,67 0,51 ± 0,29 0,66 ± 0,55 0,45 ± 0,06 0,49 Stocking density (t/ha)
Common carp 0,30 ± 0,18 0,26 ± 0,14 0,38 ± 0,42 0,26 ± 0,06 0,24 All species 0,32 ± 0,18 0,33 ± 0,15 0,45 ± 0,45 0,32 ± 0,05 0,29 Labour (FTE/ha1) 0,12 ± 0,11 0,04 ± 0,05 0,05 ± 0,03 0,05 ± 0,01 0,05 Feed use (t/ha) 3,35 ± 2,18 1,72 ± 1,09 2,29 ± 1,55 1,67 ± 0,61 1,72 Machinery (pc/ha) 0,06 ± 0,10 0,03 ± 0,03 0,02 ± 0,01 0,01 ± 0,00 n.a.
Efficiency indicators
FCR 5,07 ± 5,08 5,38 ± 2,96 5,65 ± 2,25 4,72 ± 1,45 4,48
Ratio of harvested to stocked
quantity of Common carp 4,29 ± 1,95 2,60 ± 0,88 2,57 ± 0,77 2,38 ± 0,25 2,61 Labour efficiency (t/FTE)2 14,0 ± 12,3 16,65 ± 9,38 23,56 ± 21,2 13,1 ± 2,5 n.a.
9 different from 1. Based on this, the null hypothesis of constant returns to scale cannot be rejected, so what we can conclude is that there are no economies of scale within the pre-harvest stage of carp farming.
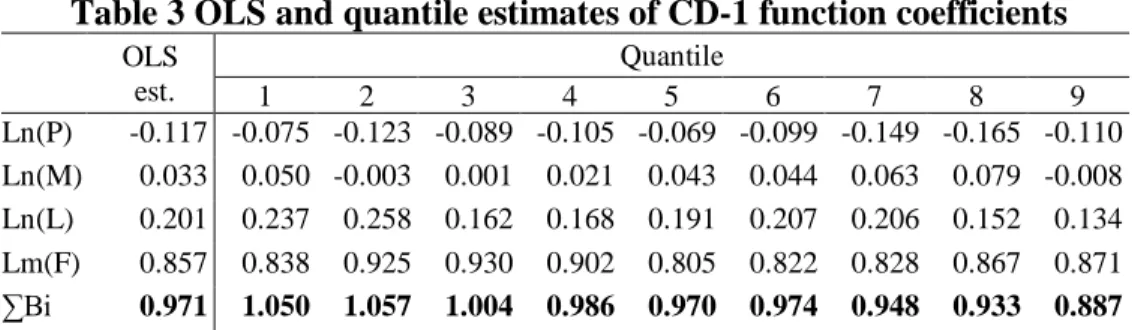
Table 3 presents quantile regression coefficients for each quantile ranging from the 1st decile to 9th decile and OLS regression.The returns to scale estimate for the median (5th decile) is 0.97, identical to that of the OLS estimate, implying that the presence of possible extreme values in the data did not biased the OLS estimation of returns to scale estimation. Further results suggest that groups of smaller farms exhibit a constant/slightly positive return to scale (the sum of coefficients is 1.05-1.06 at the lower quantiles), while there are diseconomies of scale among the larger farms (the sum of coefficients is 0.89 at the largest quantile).
Table 2. Estimated values of coefficients and related statistics of the Cobb-Douglas production functions (using OLS regression)
CD-1: Per-farm production (Ln Y) CD-2: Per-hectare production (Ln y) Variables Parameter values (and SD) Variables Parameter values (and SD)
Constant -0,011 (0,666) Constant -0,094 (0,652)
Ln(RM) 0,857 (0,069)*** Ln(rm) 0,859 (0,069)***
Ln(L) 0,201 (0,065)** Ln(l) 0,219 (0,060)**
Ln(M) 0,033 (0,022) Ln(m) 0,034 (0,023)
Ln(P) -0,117 (0,089)
R2 0,956 R2 0,808
F-value 231,7*** F-value 61,48***
*** 1% and ** 5% level of significance
Table 3 OLS and quantile estimates of CD-1 function coefficients
OLS est.
Quantile
1 2 3 4 5 6 7 8 9
Ln(P) -0.117 -0.075 -0.123 -0.089 -0.105 -0.069 -0.099 -0.149 -0.165 -0.110 Ln(M) 0.033 0.050 -0.003 0.001 0.021 0.043 0.044 0.063 0.079 -0.008 Ln(L) 0.201 0.237 0.258 0.162 0.168 0.191 0.207 0.206 0.152 0.134 Lm(F) 0.857 0.838 0.925 0.930 0.902 0.805 0.822 0.828 0.867 0.871
∑Bi 0.971 1.050 1.057 1.004 0.986 0.970 0.974 0.948 0.933 0.887
A∑Bi represents the sum of the coefficients of input variables except the constant
10
Marginal Value Products (MVP) of inputs were calculated so that constraints and opportunities in pond farming could be analysed. The MVP was computed for each farm as the product of the market value of common carps and the partial derivate of CD-1 with respect to the variable concerned. Results show that marginal value product (MVP) of raw materials is considerably higher than its unit cost, meaning that it is worth intensifying production. Further analysis shows that the availability of the workforce constrains the development of those farms that use more intensive technologies. The MVP of labour is higher than the cost of an additional FTE in the case of the majority of farms with higher yields than the industry average. For the rest of the farms this is not the case. The parameter estimates for Model 2 shed light on the main sources of production intensity. These show that raw material and labour are significant determinants of carp yields, while machinery is not.
There is a link between the results of econometric analysis and the descriptive statistics presented in Table 1. Relatively high standard deviations suggest that carp production technology is heterogeneous. Small and medium-sized farms optimise their production technology by adapting a more extensive or a more intensive method of farm management, subject to their comparative advantages and/or the site-specific constraints which limit production intensity. This heterogeneity in the production technologies followed by farmers means that pond farming processes cannot be easily standardised and repeated over several production units, which would be a prerequisite for the existence of economies of scale. The fact that smaller farms on average use more intensive production technology is analogous to general agriculture farming patterns in developing countries. Higher overall production efficiency of farms operating on less than 50 hectares is a driver of diseconomies of scale and it is an important phenomenon that helps to interpret the results of the econometric analysis.
11 Although the sum of production elasticities in Model 1 is not statistically significantly different from 1, there is some evidence in the econometric analysis that there are diseconomies of scale (i.e. larger farms are in the rising portion of the average cost curve). By comparing the coefficient of capital (0.03) with the coefficient of labour (0.20), it can be concluded that technologies in carp aquaculture are rather labour-intensive and capital-saving.
This supports the view that there are no economies of scale in this sector, as economies can be exploited in those technologies that are capital intensive and labour-saving. The results of this study are in line with the experience from other agriculture sectors of the Central and Eastern European region. The existence of an inverse relationship between farm size and output per unit of cultivated land (physical yield) has been observed for several sectors.
3.2. Results of the pond farm simulation model
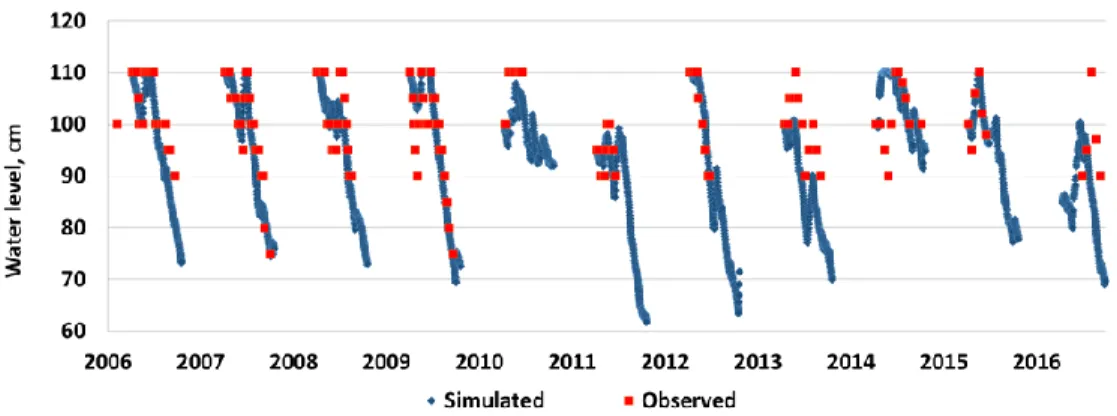
As a test for validity of the evaporation model, Fig. 3 compares measured and model calculated water levels in one of the fishponds of SzegedFish Ltd.
during the period 2006-2016. It can be seen that the model gave a good match with the observed data over the majority of the years. Major difference between measured and modelled data appeared in periods when excess water occurred, which is associated with rising groundwater levels and lateral infiltration of water into the ponds.
Comparison of observed and modelled carp yields is shown in Fig. 4. The model gave a very good match for 4 of the 7 production seasons studied. The biggest difference between the model output and real harvest result was in 2015, a year when the carp weight gain ratio was an unusually low with a value of 1.27. As this is considerably lower than the industry-level average, there must have been disease outbreak or high bird predation this year, which hindered the success of farming. As described in the definition of the boundary
12
conditions of the model, these factors are outside the scope of the model, so the model is not supposed to give an accurate estimate for such a year.
Figure 3. Comparison of observed and model calculated water levels in Pond No. III. of Szegedfish Ltd.
Figure 4. Model calculated carp biomass growth matched with stocked and harvested quantities of carpin Pond No. III of Szegedfish Ltd.
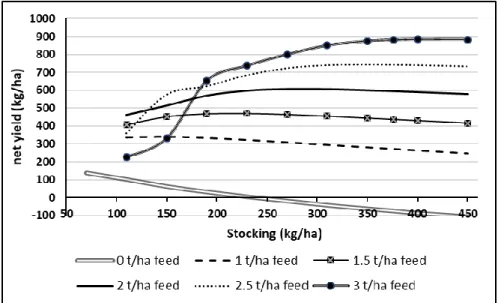
Model simulations for per hectare net yields are shown in Fig. 5 so that the suitability of the model for mapping basic principles of ecosystems are demonstrated. Fish ponds can be understood as input-controlled agro- ecosystems, analogously to natural ecosystems. In such systems, at a given level of nutrient availability there is a biomass density (and a corresponding stocking density) providing a maximum biomass growth; stocking less or more than this level results in lower yields. Should farmers stock more than the carrying capacity of the pond, the biomass growth would be negative, because available quantity of nutrients cannot provide enough energy to compensate destructive metabolic processes (catabolism). The higher the quantity of
13 available nutrients (i.e. the more feed is given by the producer), the higher will be the stocking density, corresponding with maximum biomass growth. If the model simulates reasonably the ecological processes in fish ponds, the curves generated by model output reflect the previously described rules. Fig. 5 shows that the curvature of the net yield graphs is reasonable so it can be stated that the model is capable of capturing and mapping basic principles of pond ecosystems. It can be seen that the higher the feeding intensity is, the higher the yields are, and the maximum point on each curve moves to the right as feeding level is increased.
Figure 5. Model simulations for net carp yields as a function of the stocking density under different feeding scenarios.
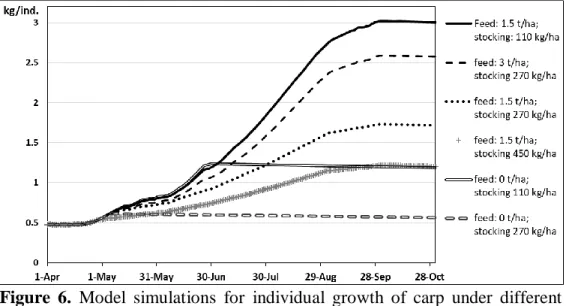
Fig. 6 shows the results of model simulations for individual growth under different technological options. Most of the curves have an inflection point in the July period, which means that growth is slowing down from that time. This is in line with the practical experience that this is the time when the zooplankton biomass is depleted in the ponds. From August, external feeding contributes to the majority of weight gain of carp.
14
Figure 6. Model simulations for individual growth of carp under different technological scenarios assuming a stocking weight of 475 g on 1 April Over the past 10 to 15 years, consumer preferences for carps in Hungary have shifted towards larger individual sizes. Producers should choose a stocking and feeding strategy that result in an average individual weight over 2 kg so that the majority of the harvested fish meet market requirements. Table 3 shows model predictions on mean individual weight under different technological options.
Table 4. Model simulations on mean carp individual weight (kg/ind.) at harvest assuming a stocking weight of 475 g
Feeding level (kg/ha)
0 1000 1500 2000 2500 3000 3500 4000
Stocking density (kg/ha)
70 1.31
110 1.01 2.54 2.91 3.26 2.69 1.95 1.56 1.22
150 0.81 2.05 2.50 2.75 3.04 2.04 1.51 1.17
190 0.70 1.72 2.16 2.49 2.66 2.78 1.89 1.24
230 0.64 1.50 1.90 2.24 2.48 2.62 2.49 1.65
270 0.59 1.34 1.70 2.02 2.30 2.47 2.53 2.31
310 0.56 1.22 1.54 1.84 2.11 2.33 2.46 2.45
350 0.54 1.13 1.42 1.69 1.95 2.18 2.35 2.45
400 0.52 1.04 1.29 1.54 1.78 2.00 2.20 2.34
450 0.51 0.97 1.20 1.43 1.64 1.85 2.04 2.21
Comment: Technological options resulting in individual weights meeting consumer preferences (> 2 kg/ind.) are indicated by a grey background.
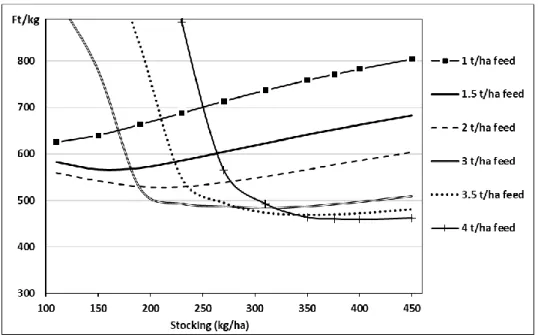
15 Fig. 7 shows the calculations of unit production costs, following the model results. These calculations include only the direct costs incurred during pre- harvest farming, while indirect costs and post-harvest costs (warehousing, transport, processing, sales) are not accounted for. The farming technology that results in minimized unit cost is represented by a feeding rate of 4 t/ha and a stocking density of 400 kg/ha if capital costs are not taken into account, and by a feeding rate of 4 t/ha and a stocking density of 450 kg/ha if capital costs are included in the calculations. Calculations of per hectare profits shows that only those farming technologies can generate a positive financial result which are characterized by a feeding level higher than 2 t/ha.
Figure 7. Calculations of unit cost of production (including capital costs) as function of stocking density under different feeding strategies The economic calculations based on the output of the pond farming simulation model are in line with the econometric model results in that the intensification would improve the economic results for the majority of Hungarian carp farms.
Like the entire agricultural sector, pond farming will also be affected by climate change. This effect is enhanced by the extensive nature of production technology, by high exposure to weather conditions and by strong reliance on
16
water resources. Model outputs highlight that carp-based pond aquaculture will be both positively and negatively impacted by climate change. Model forecasts show that evaporation will not increase significantly in the short term (2025- 35) and it will rise by about 10 cm in the long run (2045-55). By contrast, the supplementary water requirement of ponds (which is calculated from evaporation and precipitation) will not increase monotonically: in short term it will increase by 1000-1400 m3/ha, while in the long run the additional water demand will drop back to 500-700 m3/ha.
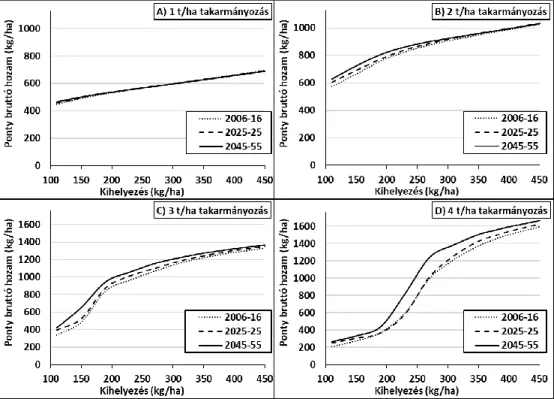
In addition to hydrological processes, climate change also affects yields through metabolic processes and dissolved oxygen levels. Fig. 8 shows simulations of gross carp yields for the reference period (2006-16) and for forecasted climate in 2026-35 and 2046-55 under RCP4.5 scenario of NORESM climate model. Being a warm-water species, carp under properly managed conditions, is forecasted to grow faster. This is mainly attributed to i) increased appetite and growth potential of carp (warming weather affects positively the anabolic activity); and ii) increased food availability (warmer temperature enhances plankton formation). However, there is a large difference in climate change impacts between different management scenarios.
Higher feeding rates are associated with bigger growth in yields: warming temperature positively influences the anabolic activity of carp and its capability to take up food; thus, more intensive feeding is required to meet increased nutrient demand and to exploit growth potential. Increment in yields is higher for strategies with lower stocking densities, because enhanced plankton productivity can be fully exploited with more extensive technologies, when predation pressure on zooplankton fauna is lower.
17 Figure 8. Forecasted gross yields of Common carp as function of stocking density, under different time horizons and climate scenarios. A-D subgraphs represent different feeding strategies.
Figure 9. Simulated unit cost of Common carp production as function of stocking density, under two different feed management scenarios and two time horizons and climate scenarios.
18
Impact of climate change on fish biology and pond hydrology has implication on farm-level economics. Fig. 9 demonstrates – with the assumption of fixed input prices relative to each other – that optimal production technology (unit costs minimizing technological options) will be somewhat more extensive with regard to stocking densities.
Among the negative effects of climate change, increased production risk must be noted. Model calculations show that increased occurrence of sub- optimal/sub-critical dissolved oxygen environment may be an important phenomenon to be faced by farmers applying intensive culture practices.
It must be highlighted that several further negative effects are forecasted to come with global warming that are outside the scope of the pond model.
Among these the emergence of new invasive, food competitor species; altered disease transmission paths; more intensive degradation of production infrastructure due to increased occurrence of storms and floods; higher concentration in nutrients in inlet water are worth mentioning.
19
4. CONCLUSIONS
The main objective of the econometric analysis was to investigate the potential for economies of scale to be realized in the pre-harvest stage of carp production, as well as concerns related to the scale of production. Using a Cobb-Douglas production function it was found that there were no economies of scale in pond farming: the sum of the coefficients was less than unity (0.97) both for OLS and median (quantile) regression method. This suggests that larger farms are in the rising portion of the average cost curve.
In general, labour-saving, capital-intensive, mechanized, standardized technologies benefit from larger scale operations. Most technological processes in pond production such as feeding, stock management and pond maintenance are the hardest activities to automate contributing to the lack of economies of scale. Scale economies can be hardly exploited by pond farming also because of its labour-intensive nature. Moreover, by relying strongly on aquatic ecological processes and being exposed to climatic factors, carp production process is difficult to standardize and requires site specific management. This precludes cost-effective large-scale operations that require programming production, harvests and supplied quantities to markets.
The results of the production function analysis reveal that there is no technological driver toward concentration of farms, because small farms can be managed more intensively than medium and large ones. Higher overall production efficiency of farms operating on less than 50 hectares, which is shown by descriptive statistics in the dissertation, is a driver of diseconomies of scale. For this reason, there is no rationale behind creating economic incentives for farm concentration or discriminating positively larger farms in development project calls.
20
In some subsegments of European aquaculture (eg. cage mariculture) a significant growth in production volume and productivity occurred over the last decades and this was driven by increasing farm sizes induced by scale economies. As the nature of pond farming technology does not support the effectiveness of large-scale farming operations, it is not expected that a similar growth will occur in the pond farming sector.
The farm-level econometric model does not allow in-depth analysis of detailed biological and environmental factors and optimization of input use at pond level to increase productivity. The carp farming operation is embedded to a large extent into the pond ecosystem, making it very hard to optimize the technology with simple economic tools. Due to the complexity of food web and farming processes, a dynamic simulation pond model was developed to simulate the impact of different combinations of managerial interventions (feeding, stocking, manuring, water management) on yields and production costs. The use of the pond model, described in the dissertation can help farmers in planning stocking densities and deciding between different feeding strategies. Although presented model simulations were run with a starting individual weight of 475g, individual growth curves can be simulated for other initial stocking sizes, as well as for earlier and later stocking time.
Based on the pond model simulations, per-unit production costs and per- hectare profits can be calculated for a wide set of pond management options, if empirically based assumptions are made for labour and capital requirement of farming operation, as well as for input and output prices. However, this type of economic data is very site- or region-specific, and alters from year to another. Therefore, the model can be made more useful for economic simulations if the output of the biological model is fed into a decision support software which allows the user to enter economic data on the user surface for further cost and profit simulations. This would enable farmers to generate
21 economic projections, based on values that are characteristic to their farm.
Using the output of the pond model described in the dissertation, a software is developed in the frame of the CLIMEFISH (EU-H2020-677039) project to support the decision of farmers. The software calculates per-hectare profits and per-unit production costs of Hungarian carp farming, once the user set market prices for output, stocking material, feed, water, cost of labour, number of employees per hectare, capital costs per hectare and other revenues.
In this thesis empirically substantiated proxy data were used for the economic calculations. Following model simulations, it was concluded that the production intensity in Hungarian pond farms was lower than that would have minimized production costs. Current market trends suggest that cost of fixed and quasi-fixed inputs (e.g. labour, land) will grow at a higher rate than the price of current assets (feed, stocking material). This tendency will further stimulate farmers to intensify production. On the other hand, if area-based subsidies increase in the next EU programming period, it will be economic- wise to maintain extensive culture practices.
The pond model can be used for analysing further processes, and problems. If substantiated data were available, the model would be capable of simulating the impact of different feed components or different feed qualities on fish growth and water quality. Better knowledge on functional relationship between mortalities and water quality would improve the model. In order to further develop the pond model presented here, it is needed to have more data available on the biomass of phytoplankton and zooplankton. It is advisable to expand plankton biomass monitoring during pond trials to generate more data available for parameterizing pond food web models.
22
5. NEW SCIENTIFIC RESULTS
1. A Cobb-Douglas production function was parameterized on data from 44 Hungarian pond farms and the sum of the coefficients was found to be less than unity, implying that there were no economies of scale in Hungarian pond aquaculture.
2. A food web based fish pond model – implemented by method of Direct Computer Mapping based Programmable Structures – was developed.
The model encompasses the simulation of i) physical and hydrological processes; ii) pond food web dynamics; iii) and managerial interventions (such as stocking, feeding, manuring, water management). The novelty of the model is that it is capable of simulating growth of organisms and water quality under different feeding and stocking technologies and under different meteorological conditions. Simulated results were validated against the data of a private farm, with a satisfying difference between the calculated and measured data.
3. The validated model was used to simulate carp yields for 10 different stocking densities and 8 different feeding rates. Based on these simulations, the unit cost minimizing and profit maximizing farming technologies were identified. Simulation results show that economic optimum of input management is characterized by relatively high stocking densities (300-450 kg/ha) and by intensive cereal feeding rates (3-4 t/ha). Unit costs can be kept under 550 HUF/kg by the optimized technological settings.
4. The impact of climate change on carp yield and production costs was modelled by the pond model, using forecasted climate data of the NORESM RCP4.5 scenario. Simulation results show that global
23 warming will generally increase carp yields and decrease per-unit production costs. However, different farming technologies will unequally benefit from climate change: farming technologies, applying high stocking densities and intensive feeding will be impacted more beneficially, than the other technological options.
24
6. PUBLICATIONS IN THE FIELD OF THE DISSERTATION
Papers in scientific journals
Gyalog, G., Oláh, J., Békefi, E., Lukácsik, M. and Popp, J. 2017. Constraining Factors in Hungarian Carp Farming: An Econometric Perspective.
Sustainability, 9(11), 2111; doi:10.3390/su9112111
Gyalog, G., Varga, M., Kucska, B. and Csukás, B. 2017. Testing of a dynamic simulation model for Recirculating Aquaculture System to support managerial decisions. Regional and Business Studies, 9(1): 33-42.
Gyalog, G., Váradi, L. and Gál, D. 2011. Is intensification a viable way for pond culture in Central and Eastern Europe? AACL Bioflux, 4(5): 584-589.
Full papers in conference proceedings
Gyalog G., Varga M., Berzi-Nagy L., Halasi-Kovács B. és Csukás B. 2017. A klímaváltozás halastavak vízháztartására gyakorolt hatásai In: Bodnár K. és Privóczki Z. (eds.): Tudomány a vidék szolgálatában c. tudományos konferencia előadásainak kötete. Csongrád 2017.11.17. Csongrád: Agro- Assistance Kft., 2017. pp. 72-78.
Gyalog, G., and Váradi, L. 2011. Economic and social importance of aquaculture in Europe. Aquaculture in Central and Eastern Europe - Workshop on the Role of Aquaculture in Rural Development, Chisinau, Moldavia, October 17-19, 2011, Kishinev: Pontos, 2011, p. 59-63
Gyalog G., Gál D. és Váradi L. 2012. Fenntarthatósági kérdések az intenzív akvakultúrában In: Jakabné Sándor Zs., Bozzánné Békefi E., Jancsóné Kosáros T., Bíró J. és Jancsó M. (eds.): Halászatfejlesztés - Fisheries & Aquaculture Development Vol. 34. pp. 121-128.
Books, book chapters
Gyalog G., Varga M., Berzi-Nagy L., Halasi-Kovács B. és Csukás B. 2018. A klímaváltozás halastavak vízháztartására gyakorolt hatásai. In. Somogyi, N;
Radó, G; Gyuricza, Cs. (eds.) Változások kora 2. Gödöllő, Nemzeti Agrárkutatási és Innovációs Központ. pp. 57-64.
Gyalog G. 2015. Ökonómia. In. Csorbai, B; Péteri, A. és Urbányi B. (eds.) Intenzív haltenyésztés. Gödöllő, Szent István Egyetem. pp. 115-119.
25 Gyalog G. 2015. Economic rationale behind intensification. In. Kumar S., Kumar Singh M. (eds.): Innovative outdoor fish farming technologies and technical solutions - applicable to low-investment farming opportunities.
AQUAREDPOT project Deliverable 5.4. NARIC-HAKI, Szarvas.
Váradi, L.; Lane, A.; Harache, Y.; Gyalog, G.; Békefi, E.; Lengyel, P. 2012.
Regional Review on Status and Trends in Aquaculture Development in Europe, 2010; FAO, Rome, Italy.
Bojtárné L. M., Gyalog G., Szűcs I., Váradi L. 2011. A hazai akvakultúra ágazat jellemzői In: Bíró Sz., Kapronczai I., Szűcs I., Váradi L (szerk.):
Vízhasználat és öntözésfejlesztés a magyar mezőgazdaságban. Agrárgazdasági Könyvek, Budapest, AKI. pp.89-100.
Oral presentations
Gyalog, G., Varga, M., Berzi-Nagy, L., Kerepeczki, É. and Csukás, B. Impact of climate change on the economics of carp farming. Adaptation of inland fisheries and aquaculture to climate change, EIFAAC International Symposium. 2017.09.03-06., Stare Jabłonki, Poland.
Gyalog G., Varga M., Berzi-Nagy L., Kerepeczki É., Csukás B. A klímaváltozás hatása a halastavak vízháztartására: gazdasági és termeléstechnológiai következmények. XLI. Halászati Tudományos Tanácskozás, Szarvas, 2017.06.14-15.
Gyalog G., Varga M., Berzi-Nagy L. és Csukás B.: Az éghajlatváltozás hatása a magyar tógazdálkodásra. VIII. Gödöllői Halászati-Horgászati Szakember Találkozó. Gödöllő, 2018.02.01
Gyalog, G, Varga, M., Berzi-Nagy, L. and Csukás, B. Impact of climate change on the economics of carp farming. 4th International Carp Conference, Zágráb, 2017.09.21-22.
Gyalog, G. Constraining Factors in Hungarian Carp Farming: An Econometric Perspective 1st Research Conference, Kaposvár, 2018.02.22
Gyalog G., Berzi-Nagy L., Csukás B. és Varga M. A kihelyezési és takarmányozási intenzitás hozamra és költségekre gyakorolt hatásának modellezése ponty halastavi termelésénél. XLII. Halászati Tudományos Tanácskozás, Szarvas, 2018.06.14-15.