DOCTORAL (PhD) THESIS
ANIKÓ VINCZE
KAPOSVÁR UNIVERSITY
FACULTY OF AGRICULTURAL AND ENVIRONMENTAL SCIENCES
2016
DOI:10.17166/KE2016.009
KAPOSVÁR UNIVERSITY
FACULTY OF AGRICULTURAL AND ENVIRONMENTAL SCIENCES
The Head of Doctorate (PhD) School:
Prof. Dr. Melinda Kovács
Corresponding Member of the Hungarian Academy of Sciences
Supervisor:
Dr. Csaba Szabó PhD
Debrecen University, associate professor
Co-Supervisor:
Dr. Ákos Tibor Hevesi PhD
Hungarian Equine Rehabilitation and Health Service Ltd.
FITNESS IMPROVEMENT OF SHOW JUMPERS BY HIGH INTENSITY AQUA TREADMILL AND FEEDING STRATEGY
Written By:
ANIKÓ VINCZE
KAPOSVÁR
2016
Table of contents
ABBREVIATIONS ... 4
1. INTRODUCTION ... 5
2. REVIEW OF THE LITERATURE ... 8
2.1. Muscle fiber types and energy systems ... 8
2.1.1. The main energy sources ... 10
2.2. Performance tests ... 13
2.2.1. Treadmill tests ... 15
2.2.2. Field tests (track tests) ... 17
2.3. Assessment of the physical fitness by blood plasma biochemical parameters ... 18
2.3.1. Lactate ... 19
2.3.2. Lactate dehydrogenase (LDH)... 23
2.3.3. Creatine kinase (CK) ... 25
2.3.4. Aspartate aminotransferase (AST) ... 27
2.3.5. Glucose ... 30
2.3.6. Triglyceride ... 31
2.3.7. Cholesterol ... 34
2.3.8. Cortisol ... 35
2.3.9. Bilirubin ... 36
2.4. Conclusions from the literature... 37
3. OBJECTIVES OF THE DISSERTATION ... 38
4. MATERIAL AND METHODS ... 39
4.1. Experiment 1 ... 39
4.1.1. Experimental animals ... 39
4.1.2. Blood sampling ... 39
4.1.3. Laboratory analysis ... 39
4.1.4. Statistical analysis ... 40
4.2. Experiment 2 ... 40
4.2.1. Experimental animals ... 40
4.2.2. Training program ... 41
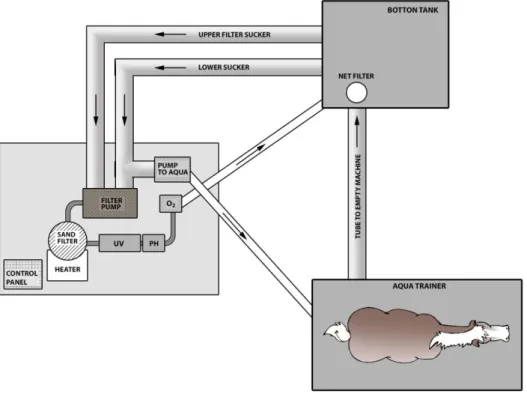
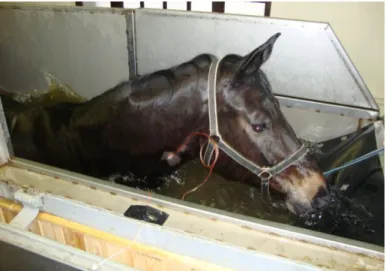
4.2.2.1. Aqua treadmill ... 42
4.2.2.1.1. Technical data ... 42
4.2.2.1.2. Construction ... 42
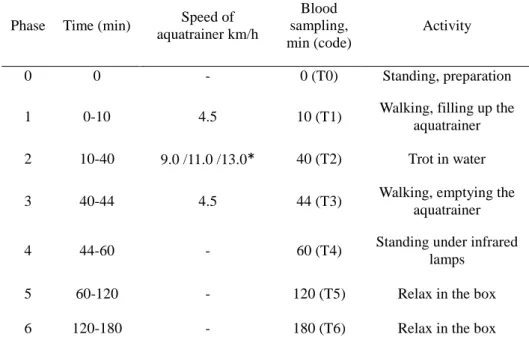
4.2.2.1.3. Training program of deep water aqua treadmill ... 44
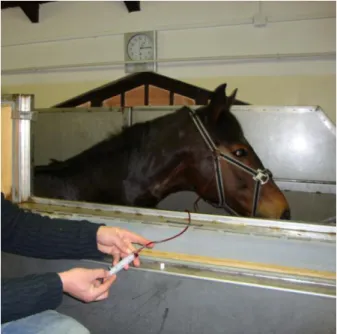
4.2.3. Blood sampling ... 46
4.2.4. Laboratory analysis ... 47
4.2.5. Statistical analysis ... 47
4.3. Experiment 3 ... 48
4.3.1. Experimental animals ... 48
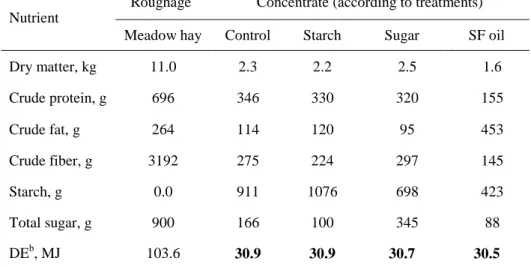
4.3.2. Treatments ... 48
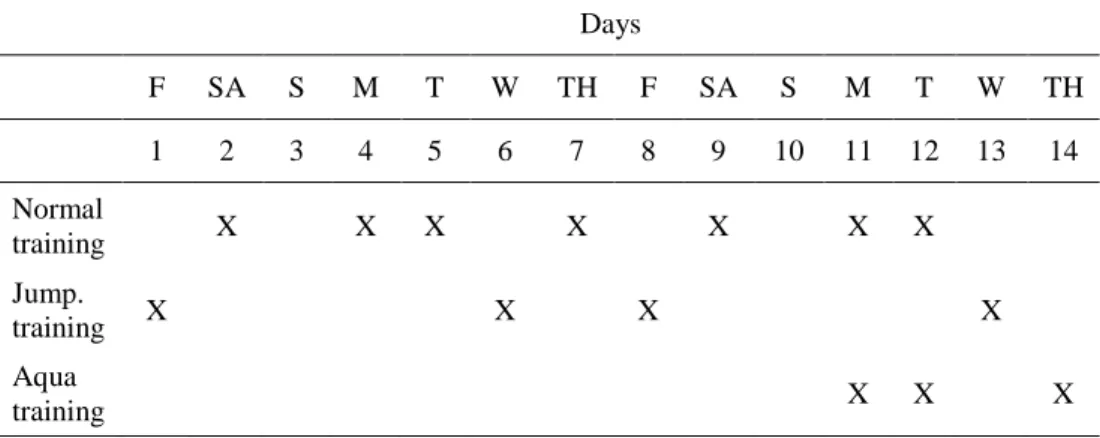
4.3.3. Training program ... 50
4.3.4. Blood sampling ... 50
4.3.5. Laboratory analysis ... 51
4.3.6. Statistical analysis ... 51
5. RESULT AND DISCUSSION ... 52
5.1. Effect of age and event on post exercise values of blood biochemical parameters in show jumping horses (experiment 1) ... 52
5.2. The effect of workload type and baseline covariate on the response of plasma biochemical parameters in show jumpers (experiment 2) ... 58
5.3. Effect of deep water aqua treadmill training intensity on plasma biochemical parameters of show jumpers (experiment
2) ... 64
5.3.1. Aqua training ... 64
5.3.2. Competition ... 68
5.3.3. Correlation between plasma parameters during aqua training and after competition ... 72
5.4. Effect of dietary energy source on the plasma parameters of equine athletes trained in a deep water aqua treadmill (experiment 3) ... 79
6. CONCLUSIONS AND RECOMMENDATIONS ... 88
7. NEW SCIENTIFIC RESULTS ... 90
8. SUMMARY ... 91
9. ÖSSZEFOGLALÁS ... 98
10. ACKNOWLEDGEMENTS ... 105
11. REFERENCES ... 106
12. PUBLICATIONS DERIVED FROM THE THESIS ... 133
12.1. Papers in scientific journals ... 133
12.2. Full conference papers in proceedings ... 134
12.3. Submitted manuscripts ... 134
13. OTHER PUBLICATION ... 135
13.1. Full conference papers in proceedings ... 135
14. CURRICULUM VITAE ... 136
ABBREVIATIONS
ADP Adenosine diphosphate
ALT Alanine transaminase
AST Aspartate Aminotransferase
ATP Adenosine triphosphate
CK Creatine kinase
CORR Procedure to analyse correlation in SAS (SAS Institute Inc., Cary, NC, USA) statistical software
DE Digestible energy
FFA Free fatty acid
GLM General linear model
HDL High-density lipoproteins
IDL Intermediate-density lipoproteins
LDH Lactate dehydrogenase
LDL Low-density lipoproteins
NAD Nicotinamide adenine dinucleotide
NADP Nicotinamide adenine dinucleotide
phosphate
NEFA Non-esterified fatty acids
NRC National Research Council
PCr Phosphocreatine
RBC Red blood cell
VLA1.5,VLA2,VLA4 Velocity at which plasma lactate
concentration reached 1.5, 2 and 4 mmol/L
VFA Volatile fatty acid
VLDL Very-low-density lipoproteins
1. INTRODUCTION
Equine athletes need training to achieve good performance in a similar way than Humans. The literature of equine athletes is relative abundant on data about Thoroughbreds, endurance and eventing horses. However only a few field tests can be found with show jumpers competing on lower levels (Covalesky et al., 1992; Sloet van Oldruitenborgh-Oosterbaan et al., 2006; Soares et al., 2011), and more experienced horses competing in 130-150 cm high classes (Art et al., 1990a,b; Covalesky et al., 1992).
The idea of blood-based assessment of training effects, condition alterations and performance is certainly not new. Post-exercise blood lactate concentration is the most widely used indicator of horse fitness (Couroucé, 1999). Standard exercise tests provide the possibility of to run the horse under controlled conditions; however data collected from a treadmill test do not reflect the horse’s response to a sport event. Horses are generally exercised on an open field or indoor, being exposed to numerous other factors such as the rider, other horses, weather, spectators, decorations, terrain, etc. (Serrano et al., 2001). Plasma lactate concentrations in Standardbred horses pulling a 10 kilopond draught load were lower on the treadmill than on the racetrack (Gottlieb-Vedi and Lindholm, 1997) and blood lactate in trotters were lower during exercise on a level treadmill than during exercise on a racetrack (Couroucé et al., 1999). In sport horses it has been also found that blood lactate concentrations were lower on the level treadmill compared with exercise over ground (Sloet van Oldruitenborgh-Oosterbaan and Barneveld, 1995).
Therefore, testing the biochemical and physiological changes during field training or competition is important.
Hinchcliff et al. (2002) showed that the anaerobic capacity of horses could be increased by an appropriate conditioning program including regular and high intensity training. However, the regular high intensity conventional training may result in a large percentage of retirement from the training program due to injuries (Eto et al., 2004). The training in water was first applied in the rehabilitation of human athletes. The exercise of horses in water to improve fitness is not new, but recently there has been a development in the possible use of aqua treadmill for horses. Several studies had been performed with aqua treadmill (Lindner et al., 2010, 2012; Hevesi et al., 2009; Nankervis et al., 2008; Voss et al., 2002) to test its effect on metabolism using mainly heart rate and lactate as indicative variables. However, little information is available on the changes of other blood parameters.
Effect of training develops qualitative and quantitative changes in the blood, which means adaptation to the increased performance. Thus the relationship between blood biochemical parameters before and after exercise or competition can be important. However, few studies can be found in the literature that examine the correlation between blood parameters in endurance horses (Rose, 1986), Thoroughbred horse (Davie and Evans, 2000) and Italian Standardbred (Tateo et al., 2008).
A proper energy supply has a primary importance for the equine athlete (Pagan, 1998). The source of energy has an influence on health, metabolism and sport performance (Harris, 2009). Therefore, the preference of energy sources depends on the type, intensity and length of the workload. Several publications demonstrate the effect of carbohydrates and fats as energy sources on various blood parameters in horses (Pagan and Jackson, 1995; Pagan et al., 1995; Spangfors, 1998;
O’Connor et al., 2001; Treiber et al., 2008). The daily rations of equine
athletes should include a mixture of energy sources (starch, fat, fibre) in a balance (Pagan, 1998). Any extreme conditions in feeding (e.g.
unbalanced energy supply) should be avoided. The cooling effect of water markedly alters the metabolic response of horses to aqua training was measured by various plasma biochemical parameters (Hevesi et al., 2009;
Lindner et al., 2012). Thus, it can be hypothesised that the response of plasma biochemical parameters are altered by different dietary energy sources when deep water exercise is part of the training program.
2. REVIEW OF THE LITERATURE
2.1. Muscle fiber types and energy systems
Muscle fibers are usually grouped as Type I, Type IIA, and Type IIX (Rivero et al., 1999). Interconversions between Type IIA and IIX (IIAX) are well recognized in the literature and it exist in equine locomotory muscles in significant numbers (Dingboom et al., 1999; Linanne et al., 1999). Type I (slow twitch, slow-oxidative) fibers are highly oxidative, meaning they use aerobic metabolism to produce energy-generating ATP (slow ATP hydrolyzes) and are well equipped to use fat as a substrate.
These fibers have a small cross-sectional area, a high number of capillaries and high oxidative capacity but their glycolytic capacity and glycogen content are relatively low. Type I fibers are highly efficient and economical in producing slow repetitive movements and sustaining isometric force that do not require great force generation. Type II fibers (fast twitch, fast-oxidative glycolytic) are subdivided into Type IIA (both high and low oxidative) and Type IIX (low oxidative, fast glycolytic) fibers. The type IIA fibers have a considerable number of both capillaries and mitochondria and rely on glycolytic and oxidative metabolism. These fibers capable of utilizing both aerobic and anaerobic metabolism to produce energy for work and it used to maintain high speed or jumping.
Type IIX fibers are used to give the horse speed and it have a maximal velocity of shortening that is three times higher than that of IIA fibers (Rome et al., 1990) and it typically extract energy from anaerobic glycolysis. Type II fibers, particularly the type IIX fibers, are more suited to rapid contraction and high force generation and thus must be used during speed or strength work (Yamano et al., 2006). Type IIX fibers are highly glycolytic and, thus, prefer carbohydrate as an energy source over
fat. II AX fibers are intermediate in their properties (Quiroz-Rothe and Rivero, 2001). Type I fibers have greater lipid storage than Type IIA fibers, while there is negligible triglyceride in Type IIX fibers. Type IIX fibers have higher glycogen stores than Type IIA fibers, while Type I fibers glycogen content are relatively low.
At low intensity work (walk) the muscle contraction is slow and it uses only small amounts of ATP. This exercise operates primarily the Type I muscle fibers and generates energy through aerobic pathway using fats.
When the speed (intensity) is increased (trot, canter) the Type I muscle fibers are not able to contract with appropriate speed, therefore, it will be involved in the type IIA muscle fibers. These fibers can also fuel from aerobic and anaerobic phatways using fat and glycogen also. The importance of this that from glycogen can be produced ATP two times faster than from lipids (Taylor et al., 1974). As soon as the intensity of exercise is further increased (fast gallop) the type IIX fibers also come into muscle work and it gains energy from anaerobic glycolysis. The anaerobic glycolysis is the fastest way to generate energy, however, as a consequence accelerates the accumulation of lactic acid in the muscles and decrease of muscles pH (Pagan, 1998).
There are existing differences in the ratio of Type I to Type II muscle fibers among breeds of horses, more specifically, among types of performance (Snow and Valberg, 1994). Arabians or Andalusians have a lower proportion of Type II muscle fibers when compared to Quarter Horses and Thoroughbreds (Snow and Guy, 1980; López-Rivero et al., 1990).
2.1.1. The main energy sources
Adenosine triphosphate (ATP) is the main source of readily available chemical energy in cells. At the beginning of any exercise energy is provided by ATP stores and the ATP-creatine phosphate pathway.
However, these energy supplies deplete rapidly as a result of work.
Therefore, it can provide the energy requirement only for 1-2 minutes (Ellis and Hill, 2005). Cells generate ATP on one hand from oxidative phosphorylation - catabolism of carbohydrates, fats, and very small amounts of proteins - using oxygen (aerobic energy production) on the other hand from glycolysis - breakdown of glucose and glycogen produce energy (lactic acid is produced, anaerobic energy production). Lactate threshold is defined as the point when lactic acid starts to accumulate and the plasma lactate concentration reaches about 4 mmol/L (VLA4) in human (Heck et al., 1985) and equine (Evans et al., 1995), which is known as the anaerobic threshold. However, Castejón et al., (1994) 2 mmol/L (VLA2) and Lindner (2010) 1,5 mmol/L (VLA1.5) were found to best represent the aerobic – anaerobic lactate threshold of horses. Lactate threshold is useful indicators of aerobic capacity (represent the maximal work intensity at which ATP is produced aerobically) and are frequently used in the evaluation of fitness and state of training. This threshold varies and depends on several factors such as the muscle’s fiber-type composition, level of fitness and the diet. Fat- rich diet promotes oxidative energy production via free fatty acids (FFAs) (Orme et al., 1997) thereby increasing the oxidative capacity of muscle (Geelen et al., 2001a; Dunnett et l., 2002) and sparing glycogen (Geelen et al., 2001b). Carbohydrates and fats are the predominant sources of ATP under normal condition. The balance between carbohydrate and fat utilization may be influenced by the physiological status of the horse, feeding state, type of diet and physical
conditioning. Substantial source of energy is the muscle triglycerides store (~ 2000g), glycogen (~ 3500g), triglycerides stored in fat deposits (~
40000g) and glycogen stored in the liver (~ 150g) (Pagan, 1998).
Glucose is the primary source of energy for somatic cells used for ATP production. Muscle and liver glycogenolysis starts to occur soon after the start of aerobic exercise. The transport of carbohydrates in the plasma glucose content is mainly achieved by means of a permanent and continuous source of energy for all tissues (Gaál, 1999). Cells may obtain glucose from the circulation or from intracellular stores of glycogen (liver, muscle). Glucose in the circulation may originate from hepatic glycogenolysis, from hepatic gluconeogenesis (carbohydrates and their metabolites - lactate, pyruvate, oxaloacetate ect., glucogenic amino acid, odd chain fatty acids) or from food consumed and digested by the horse.
Glucose can be catabolized for ATP production in two ways; one way is the most efficient method of ATP production (1 glucose generates 36 ATP) it requires oxygen, the other way can be done in the absence of oxygen, which is less efficient (1 glucose generates 2 ATP), where pyruvic acid is converted into lactic acid. When oxygen becomes available, lactic acid is converted back to pyruvic acid. The major energy sources for oxidation for muscle cells are plasma glucose and free fatty acids (Vervuert, 2011). During prolonged submaximal exercise, blood glucose may still account for up to 25% of the total energy output (Valberg, 1996).
The long-chain fatty acids utilized by cells may originate from recently consumed food, but most of the long-chain fatty acids that are oxidized for energy probably originate from either intracellular stores or adipose tissue. When the body requires fatty acids as an energy source, the hormone glucagon signals the breakdown of the triglycerides by
hormone-sensitive lipase to release free fatty acids (Elsersawi, 2013). The triglycerides in adipose tissue are broken down to long-chain non- esterified fatty acids and glycerol that are released into the blood. The triglycerides of the chylomicrons in the blood are broken down (lipoprotein lipase enzyme) in adipose tissue and muscle tissue to long- chain fatty acids and glycerol too. The glycerol component of triglycerides can be converted into glucose via gluconeogenesis, while the fatty acids are catabolized by Beta-oxidation in the mitochondria to be entered into the Citric Acid Cycle as two-carbon fragments and it can generate 17 molecules of ATP. Lipolysis requires more oxygen and occurs much more slowly than equal carbohydrate metabolism.
Non-esterified fatty acids (NEFA) are molecules released from triglycerides by the action of the enzyme lipase and are transported in the blood bound to albumin by hydrophobic forces in plasma. It is contribute only a small proportion of the body’s fat, however they provide a large part of the body’s energy. During low- to moderate-intensity exercise, there is a progressive increase in lipid oxidation with increasing exercise duration (Pagan et al., 1987; Rose et al., 1991). NEFA are important for the physical performance during the aerobic exercise of short intensity and long duration (Piccione et al., 2009). Triglyceride are released from the liver as very-low-density lipoproteins (Pösö et al., 1989) and may have been synthesized in response to increased delivery of NEFA to the liver. Hyyppä et al. (1997) demonstrated by decreases in NEFA concentrations during intense exercise bouts. Lipoprotein lipase located on the outer side of the endothelial membranes in muscle capillaries will release fatty acids from circulating VLDL (very-low-density lipoproteins) for oxidation in muscles.
Short-chain (volatile) fatty acids can also be used for energy production.
Most volatile fatty acids (VFA) originate from the large intestinal fermentation of carbohydrates. VFA production in the cecum may be sufficient to meet up to 30 percent of a horse’s energy needs at maintenance (Glinsky et al., 1976). Experimental results demonstrated that horses consuming a diet composed primarily of hay will meet more than 80 percent of their energy needs from VFAs (Vermorel et al., 1997).
VFAs may be available as energy sources to cells or they may be metabolized to long-chain fatty acids or glucose. Acetate is the predominant VFA produced in the large intestine, but significant amounts of propionate are also generated. Pethick et al. (1993) demonstrated that acetate oxidation might contribute about 30 percent of the energy utilized by the hind limb at rest. Other experiment has suggested that up to 50 – 60 percent of circulating glucose in forage-fed ponies originates from absorbed propionate (Simmons and Ford, 1991).
The body prefers not to use protein for energy because it is specifically needed to build and repair all kinds of tissues. If the body do not have enough carbohydrates or fats to cover the energy requirements, amino acids from dietary protein are converted into energy. In order to use amino acids as energy from the glucogenic amino acid process of removing that amino group is (deamination - taking away the amino group, -NH2-), and the resulting ketoacids getting involved in carbohydrate metabolism and it synthesized glucose.
2.2. Performance tests
Sport physiology is the youngest branch of physiological sciences. Its subject is to study the physiological changes caused by physical exercise.
Physiological studies systematize the normal functions of the organism
and sport physiology deals with its enhanced operation. Exercise physiology can be classified as one of the applied physiological sciences, because it uses the methods of classical physiology for studying functions caused by physical exercise and sport (Kenney et al., 2015).
Performance-physiological examinations - besides measuring physical performance - makes it possible to define adaptational processes (metabolic, cardio-vascular, skeletal) and based on them, it is possible to suggest an efficient training programme both for amateur and professional sportsmen.
During physical exercise acute changes occur in the different organ systems (cardio-vascular, muscular system, etc.). The extent of these changes depends on various factors: the form, duration and intensity (strain, frequency) of workload and on the individual differences (Krumrych, 2006). The organs and their functions adapt to regular physical activity. Depending on the duration and regularity of physical strain, we can differentiate between acute effect and chronic adaptational processes.
While planning and carrying out performance tests, we need to keep in mind that we will have to be able to answer the following simple questions of the rider, the trainer or the owner (Hinchcliff et al., 2008):
What fitness level does my horse have actually?
Has the fitness level of the horse changed as a result of the specific training work?
Is the horse fit enough for its next race?
What changes should be made so that my horse would reach a better fitness level?
Can weaker performance be a result of an inadequate training programme or can it be caused by some health problem?
The biggest challenge of equine exercise tests is the standardisation of exercise bouts. In the course of field training, due to the individual differences in the riders’ skills, canter and trot length and speed, and other environmental factors the very fully identical test cannot be ensured.
Therefore the development of treadmills suitable for animal tests opened new possibilities in equine studies. It does not mean that we do not need field tests. We can mention advantages and disadvantages of both testing types. A basic requirement of the tests is to be well-planned and repeatable.
2.2.1. Treadmill tests
To be able to compare several horses’ performance, or the performance of one horse on different days, it is necessary to standardise the conditions of performance, which requires the use of a high-speed treadmill. Modern high speed treadmills are able to reach 17 m/s speed, however, for reliable results, maximum effort tests are often done at a lower speed, and at an incline of more than 10% (Hinchcliff et al., 2008).
The advantages of treadmill testing are obvious: the tests can be conducted under controlled conditions, one can control the duration of the test, or the speed of the horse’s movement; in addition, environmental factors such as temperature and humidity can be kept at a constant level.
As several other factors (like the effects of the environment, that of the rider or that of the trainer), can be eliminated, treadmill testing is an important means of sport physiological research.
Establishing in standardized conditions can help to predict performance.
Measurements can be carried out easily, it is possible to check heart rate and breath frequency continuously during movement (Persson, 1983), or to measure the activity of different muscle groups (Van Wessum et al., 1999), or to examine the breathing gas exchange (Persson et al., 1980;
Rose and Evans, 1987). A further advantage is that taking blood samples, is possible during training, without the need to stop the movement of the horse (Baragli et al., 2001). We can repeat the training programmes under the same circumstances as many times as we need to, and during testing we can change one particular factor, while the other factors remain constant. If necessary, we can enhance strain by putting the required amount of weight on the horse, or we can do the testing with the assistance of an experienced rider (Sloet van Oldruitenborgh-Oosterbaan and Barneveld, 1995). It is also possible to increase strain further by the increase of the treadmill’s angular offset, which can create the effect of the horse going upgrade.
The disadvantage of treadmill training is that the horse is not in its natural surroundings during the test, so measurements do not evaluate the effects of normal, everyday training. Moreover, we cannot disregard the fact that both the biomechanical variables of locomotion (Buchner et al., 1994) and the strain are different in the case of treadmill tests and field tests (Sloet van Oldruitenborgh-Oosterbaan, 1999). Exactly that is the reason why the results of field and treadmill tests are not comparable (Sloet van Oldruitenborgh-Oosterbaan and Barneveld, 1995; Couroucé et al., 1999).
A further drawback of this method is the high investment cost, and the maintenance cost of the equipment. Before doing the clinical test, the horse must be acclimatized to the treadmill, for which we have to spend enough time, as the time of acclimatization to these artificial surroundings
is different among horses (King et al., 1995; Scheffer and Sloet van Oldruitenborgh-Oosterbaan, 1996).
A special type of the treadmill is the deep water treadmill, which in fact is a conveyor belt operating under a water column at variable height and temperature values; it can help training horses in their regeneration or rehabilitation (Sloet van Oldruitenborgh-Oosterbaan and Barneveld, 1995; Gottlieb-Vedi and Lindholm, 1997). Earlier, the equipment was used to post-operational or post-traumatic rehabilitation, during which cure rate increased and the rehabilitation period decreased. The hydrodynamic force reduces the strain on the joints, and makes it possible to develop the muscles. Nowadays it is not used only for rehabilitation but also for physiological examinations all over the world (Nankervis et al., 2008; Lindner et al., 2010). The results of deep water treadmill tests cannot be compared directly either to treadmill or to field tests (Knudsen and Jørgensen, 2000).
2.2.2. Field tests (track tests)
During field tests the horse and the rider do their training in familiar surroundings, on the ground, so the tests and their results are closer to the everyday work, and are more similar to the circumstances the horse probably meets during a competition. The rider influences his/her horse during these tests, just like in everyday work or at a race. Another advantage is that the horse does not need to be acclimatized before doing the test.
However, during these tests controlling the speed can be problematic even in the case of an experienced rider (Davie and Evans, 2000); moreover, significant influencing factors are the outside temperature, the wind, the humidity, the quality of the soil, the weight of the rider and his/her riding
technique; all of these influence the test results (Hargreaves et al., 1999).
A further difficulty lies in sampling, as the horse has to stop for taking each blood sampling, and thus the strain (the speed) cannot be increased as evenly as in the case of the treadmill. The stops, however they are short, can affect the blood concentration of metabolites (Hinchcliff et al., 2008). In contrast, several tests prove that field tests are reliable and repeatable and natural (Kobyashi et al., 1999; Couroucé, 1999).
A special form of field tests is when the examinations are done during a competition (Art et al., 1990a,b). The racing situation usually causes bigger stress for the horse than the everyday training, so the test results differ from an average field test, as well (Couroucé, 1999).
Performance tests can help to predict the performance of the horse, and they can also point out health problems, which lie behind poor performance. During the planning of each test (type, duration, etc.) we try to find the answers to a particular question, where results must be given so that they help the rider, the trainer or the owner to reach better fitness and better performance.
2.3. Assessment of the physical fitness by blood plasma biochemical parameters
In most of the studies the heart rate and blood plasma lactate measurements are the bases of an exercise test evaluation for training horses (Covalesky et al., 1992; Couroucé et al., 2000). Other researchers documented that in the physiological control of physical fitness the enzymes of blood plasma are also important, especially lactate dehydrogenase (LDH), transaminase enzymes (AST, ALT) and creatine kinase (CK). These parameters change as the effect of training
(Brancaccio et al., 2008) or injury. Studies with horses indicated that the responses of blood biochemical parameters to different exercises vary (Davie and Evans, 2000; Soares et al., 2011). Several studies have demonstrated the extent of changes depends on several factors: type of exercise, intensity of work (strength, duration and frequency) and individual variation (Krumrych, 2006). In this section systematized the changes of the blood biochemical parameters as the result of exercise in horses.
2.3.1. Lactate
Lactate has two optical isomers, and in animals the L-lactate is constantly produced from pyruvate via lactate dehydrogenase (LDH). This is a process of fermentation during normal metabolism and exercise too. The concentration of blood lactate is usually 1–2 mmol/L at rest (Hinchcliff et al., 2008) and a normal resting plasma lactate concentration (Table 1) is approximately 1.5 mmol/L in horses (Nappert and Johnson, 2001), but can be up to 20 mmol/L as the effect of intensive training (Evans and Golland, 1996). Accumulation of lactic acid occurs when there is a high demand for energy (intensive training) but the supply of oxygen to the cells is limited, such as what happens during anaerobic exercise. In this case the lactate is produced faster than the ability of the tissues to remove it; therefore the blood lactate concentration starts to rise. This is a beneficial process since the regeneration of NAD+ provides (pyruvate is reduced to lactate while NADH is oxidized to NAD+) that energy production is maintained and training can continue. The increased lactate level can be removed for oxidation to pyruvate by well-oxygenated muscle cells, heart cells, and brain cells and then it can be directly used to fuel the Krebs cycle. The other ways the lactate conversion to glucose via
gluconeogenesis in the liver and release back into (Cori cycle) circulation (McArdle et al., 2010).
Several studies have dealt with lactate in blood tests. Research of Art et al. (1990a,b) shows that the post competition blood plasma lactate level was between 6-9 mmol/L for horses competing on 130-150 cm obstacles with above 350 m/min speed (Table 2). In horses, the dynamic and periodic contractions necessary to clear the obstacles during a jumping competition could also induce a large decrease in the blood supply of the working muscles. This fact together with the high metabolic requirement of muscular contraction during the jump could explain the increase in lactate and the high heart rate recorded in horses competing on higher classes (Art et al., 1990b). Surprisingly, it can be noticed among show jumpers that the speed and the duration of this kind of competition is provided not only through oxidative processes, but also to a great extent through anaerobic metabolism, with lactate formation (Art et al., 1990b).
Based on more than five competitions (Art et al., 1990b) no difference was found in post-competition blood plasma lactate level. The exercise over 800 m at speeds 780-960 m/min resulted in 4-19 mmol/L blood lactate level immediately after the exercise (Davie and Evans, 2000).
Muñoz et al. (2008) determined the maximum blood plasma lactate concentration after the exercise, which was 13.7 mmol/L in draft horses, 12.8 mmol/L in racing horses and 2.9 mmol/L in endurance horses. Snow and MacKenzie (1977) demonstrated blood plasma lactate concentration of more than 7mmol/L in less than 3 min as a result of high intensity training programme, which consisted of gallop or trot at high speed.
Several studies describe the effects of training on the relationship between blood lactate and velocity in horses (Anderson, 1975a; Wilson et al., 1983;
Bayly et al., 1987; Lindner et al., 1992). Furthermore, field tests have been
used to investigate the relationships between speed, heart rate and blood lactate concentrations in the Thoroughbred horse (Anderson, 1975a; Bayly et al., 1987; Evans et al., 1993; Harkins et al., 1993; Wittke et al., 1994;
Guhl et al., 1996). For the training of horses the heart rate and the lactate level responses to speed are important indicators for determining the level of training, health status and physical fitness (Art et al., 1994; Couroucé, 1999; Couroucé et al., 2000; Hebenbrock et al., 2005). Traditionally, heart rate and lactate have been studied, reported and correlated as a function of speed (Persson, 1997). Other researchers observed highest correlation with blood lactate concentration after 2 and 5 min post-exercise on treadmill (Evans et al., 1993). The onset of blood lactate accumulation has been defined as a threshold reached when the horses are running at 350 to 400 m/min, the levels of blood lactate and heart rate are expected to rise above 4 mmol/L and 150 to 160 beats/min, respectively (Persson, 1997). Davie and Evans (2000) measured relatively high (r = 0.75) correlation between velocity and blood lactate concentration.
Several studies have demonstrated that physiological responses to treadmill training can not be compared to responses of field training. Sloet van Oldruitenborgh-Oosterbaan and Barneveld (1995) found in Warmblood horses that heart rate and blood plasma lactate concentrations were lower on the treadmill test at speeds of 6.5–9.4 m/s compared with exercise over ground. However, when the treadmill incline increased to 1–2% or the speed of treadmill increased by 10% it induced the same heart rates as in the field. In Standardbred horses pulling a 10 kilopond draught load the plasma lactate concentrations were lower on the treadmill than on the racetrack (Gottlieb-Vedi and Lindholm, 1997), blood lactate in trotters was lower during treadmill training than during exercise on a racetrack (Couroucé et al., 1999). Hevesi et al. (2009)
demonstrated that plasma lactate level decreased during deep water aqua treadmill training and elevated during the resting period. Lindner et al.
(2012) using 20 min exercise period, 19.8 km/h maximum speed and water height at 80% of the withers height did not observe markedly greater blood lactate level (1.5-2.0 mmol/L) after the exercise. However, higher lactate values were found when the height of water was only at the height of 50 and 65% of the height of withers compared to the level at 80% (Lindner et al., 2010). However, Lindner et al. (2012) measured 1.23 to 1.4 mmol/L blood lactate level during high level aqua training. Studies have shown that the temperature of the water plays an important role in the development of cardiac rhythm (Nankervis et al., 2008). The thermoneutral zone for horses in air is ranging from 5 to 25 °C (Morgan, 1998), but it in water has not been established yet (Lindner et al., 2012), this value in humans ranges from 33 to 35 °C (Choukroun and Varene 1990).
Several studies have shown that lactate accumulation increased during repeated sprints, when the horses were fed with 10% corn oil instead of a diet without added fat (Ferrante et al., 1993; Kronfeld et al., 1994; Taylor et al., 1995). Contrary to that Julen et al. (1995) observed no effect of fat feeding on blood plasma lactate concentrations in horses. Similar results were found by Harkins et al. (1992) in a 1600 m race and by Scott et al.
(1992) in repeated sprints. Sloet van Oldruitenborgh-Oosterbaan et al.
(2002) demonstrated lower blood plasma lactate accumulation when the horses were fed with a high-fat (11.8% in dry matter) instead of a low-fat (1.5% fat) diet when the horses were trained with a standardized sub- maximal exercise test.
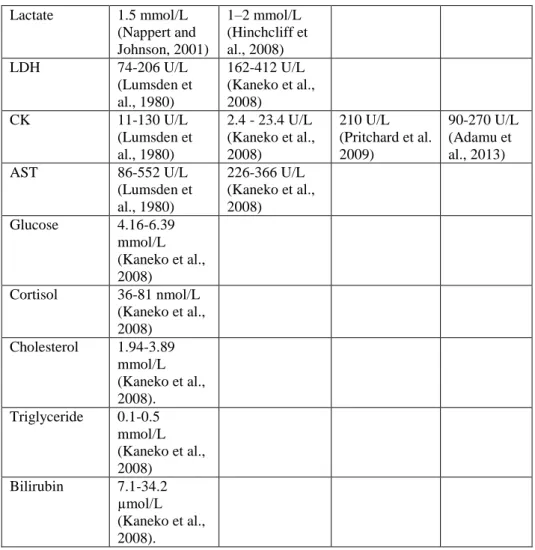
Table 1: Reference values of horses
Lactate 1.5 mmol/L (Nappert and Johnson, 2001)
1–2 mmol/L (Hinchcliff et al., 2008)
LDH 74-206 U/L
(Lumsden et al., 1980)
162-412 U/L (Kaneko et al., 2008)
CK 11-130 U/L
(Lumsden et al., 1980)
2.4 - 23.4 U/L (Kaneko et al., 2008)
210 U/L (Pritchard et al.
2009)
90-270 U/L (Adamu et al., 2013)
AST 86-552 U/L
(Lumsden et al., 1980)
226-366 U/L (Kaneko et al., 2008)
Glucose 4.16-6.39 mmol/L (Kaneko et al., 2008)
Cortisol 36-81 nmol/L (Kaneko et al., 2008)
Cholesterol 1.94-3.89 mmol/L (Kaneko et al., 2008).
Triglyceride 0.1-0.5 mmol/L (Kaneko et al., 2008)
Bilirubin 7.1-34.2 µmol/L (Kaneko et al., 2008).
2.3.2. Lactate dehydrogenase (LDH)
LDH present mainly in animals (skeletal and heart muscle, liver, red blood cells, etc.) and even detected in plants (O’ Carra and Mulcahy, 1996). The tissue destruction associated with the extent and course of diseases such as heart attack, hepatitis, tumor, muscle damage or haemolysis can be estimated by measuring LDH activity. This enzyme is involved in glucose metabolism of all cells. Thus, this is the key enzyme
in the bloodstream of tissues having high glucose metabolism such as liver, heart and skeletal muscle, red blood cells, nerve tissue and tumor tissue. LDH catalyses the interconversion of lactate and pyruvate and with parallel interconversion of NADH and NAD+. It converts pyruvate, the final product of glycolysis to lactate when oxygen is absent or in short supply and it performs the reverse reaction during the Cori cycle in the liver. At high concentrations of lactate, the enzyme exhibits feedback inhibition and the rate of conversion of pyruvate to lactate is decreased, thus lactate to pyruvate is preferred. In this respect the elevated activity of LDH is the result of anaerobic energy supply. The reference values (Table 1) varies between wide ranges such as 162-412 U/l (Kaneko et al., 2008) or 74-206 U/l (Lumsden et al., 1980). The LDH values may be higher in case of haemolysis (disintegration of red blood cells), heart attack, hepatitis, muscle damage, pancreatitis or tumor.
The LDH activity increased significantly due to show jumping exercise compared to pre-event values (Art et al, 1990b). Guy and Snow (1977) described that a marked increase in lactate dehydrogenase activity is the effect of high intensity exercise. For example, immediately after training or competition its value can increase up to twice and after 12 hours it can be three times higher compared to baseline value (Gaál, 1999). However, Fregin and Thomas (1983) have shown that the conversion of lactic acid to pyruvate does not keep pace with the growing lactic acid production. It is assumed, however, that the elimination of lactic acid and its breakdown rate was faster with higher LDH activity. This is supported by Kovács (2006) who also established that the increased LDH activity coupled with lower lactate level due to faster elimination results in more quick recovery. Many factors can influence the plasma activity of LDH such as age, sex, exercise and training programs. Muñoz et al. (2002)
demonstrated that elevated plasma muscle enzyme is more prevalent in mares than in male horses, suggesting a hormonal predisposition. Other researchers demonstrated that most probably genetic (Gaffey and Cunningham, 1988) and/or other factors like nutrition are responsible for the activity of LDH, while exercise has little influence on it. The LDH activity increased as the effect of training plus some supplementary feed, but it cannot be excluded that the increased LDH activity in the development of the English thoroughbred horses is also partly a genetically fixed property (Gaffey and Cunningham, 1988). Plasma activity of LDH and other enzymes (i.e., AST, CK) is increased (Table 2) typically in horses during jumping or endurance exercise (Balogh et al., 2001; Krywanek et al., 1996) and similar findings have been reported after varying short distance exercise (Cornelius and Kaneko, 1963;
Anderson, 1975b) and endurance rides (Rose et al., 1977).
2.3.3. Creatine kinase (CK)
Creatine kinase, also known as creatine phosphokinase (CPK) is an enzyme responsible for the energy production of cells. CK catalyses the conversion of creatine and utilizes ATP to create phosphocreatine (PCr) and ADP. This enzyme reaction is reversible and thus CK regenerates ATP from ADP, using PCr. The source of CK activity that can be measured in the blood plasma of healthy individuals is almost entirely from skeletal muscle. The high activity occurs with either skeletal or heart diseases (myocardial infarction, myocardial inflammation), muscle injury, burns, etc. Usually this enzyme is used to detect damages of the heart or skeletal muscle (Gaál, 1999). A high CK activity, or the increase over subsequent measurements generally indicates that there has been some damage to the heart or other muscles. It can also indicate that the muscles
have undergone heavy load. Various reference ranges (Table 1) can be found in the literature for CK: 2.4 - 23.4 U/L (Kaneko et al., 2008); 11- 130 U/L (Lumsden et al., 1980) and 90-270 U/L (Adamu et al., 2013).
Pritchard et al. (2009) determined a 210 U/l reference value for Lahore working horses (Pakistan).
The increase of creatine kinase activity in healthy horses indicates the intensity of the workload, and can easily double effects of training compared to the activity measured in animals resting (Art et al., 1990a).
The increase CK and LDH activities in the serum, immediately after exercise, could be mainly because of a selective increase of muscle membrane permeability (Anderson, 1975b). Balogh et al. (2001) observed significantly increased activity of CK immediately post-exercise compared with pre-exercise samples in Pentathlon Horses. Prolonged endurance exercise can result in very high CK activity (1000 – 30000 U/L) without signs of macroscopic muscle damage (Kerr, 1983; Adamu et al., 2013). CK activity are increased typically in horses during jumping or endurance exercise (Balogh et al., 2001; Krywanek et al., 1996) and similar findings have been reported after varying short distance exercise (Cornelius and Kaneko, 1963; Anderson, 1975b) and endurance rides (Rose et al., 1977). Interestingly, significantly lower CK activity were measured (Table 2) in show jumpers performing higher class competitions (Art et al., 1990a,b). Other experimental results are also indicating that excessive training does not result in an increase of CK activity (Harris et al., 1997; Hamlin et al., 2002). In another study show jumping test failed to further increase elevated CK activity in the serum (Soares et al., 2011). Pritchard et al. (2009) measured high activity of CK and it is probably the result of low-level but chronic muscle injuries (caused by the everyday work itself performed by those horses), and not a
reversible result of a single exhaustive exercise bout. This assumption was based on the fact that the reference population was working daily for short periods. These observations indicate that even horses prone to regular, but relatively short intensive exercises could have a chronic muscle damage, which results in somewhat elevated CK activity (about 200-300 U/L). It has been documented that overtraining has not resulted in elevated CK activity (Harris et al., 1997; Hamlin et al., 2002). Rumley et al. (1985) demonstrated that total CK activity after 30 minutes or 30 hours post-race do not correlate with finishing time of endurance horses.
2.3.4. Aspartate aminotransferase (AST)
AST can be found also in the liver, kidneys, brain, red blood cells, heart and skeletal muscles, and elevated activity can indicate muscle damage due to muscle strain from exercise. The increased activity can be caused by liver damage as well (Gaál, 1999). AST catalyzes the reversible transfer of the amino group from aspartate or glutamate to the corresponding ketoacid, as such, is an important enzyme in both amino acid degradation and biosynthesis. In amino acid degradation, following the conversion of α-ketoglutarate to glutamate, in the reverse reaction, aspartate may be synthesized from oxaloacetate, which is a key intermediate in the citric acid cycle. A wide range of reference values (Table 1) can be found in the literature for AST: 226-366 U/L (Kaneko et al., 2008) and 86-552 U/L (Lumsden et al., 1980).
Art et al. (1990a,b) observed significantly lower AST activity in higher class show jumping horses (Table 2). However, in English thoroughbred horses with good racing results continuously elevated (around 300 U/L) AST activity were found (Harris et al., 1990). As AST is also mainly released from muscle, the simultaneously elevated activities with CK
indicates a strenuous exercise. Freestone et al. (1989) measured in nine Thoroughbred horses increased AST and CK activities immediately after and 4 hours after 400 m and 1000 m test. Siciliano et al. (1995) observed that even submaximal exercise can elevate serum AST (and CK) and that conditioning can reduce these responses. Andrews et al. (1995) measured significantly higher activity of AST (and CK activity) after exercise in endurance competition compared to the eventing competition. Tateo et al.
(2008) demonstrated that there was no correlation between the method of conditioning and the activity of AST (and CK, LDH) in the field test in Italian Standardbred horses.
Valentine et al. (1998) fed 19 horses with a high-fat (9-11% in dry matter) diet for 3-6 months and measured that all horses had abnormal glycogen accumulation and serum CK and aspartate transaminase (AST) activities four hours after exercise. Post-exercise CK and AST activities after feeding the high-fat diet were significantly lower than the values before training.
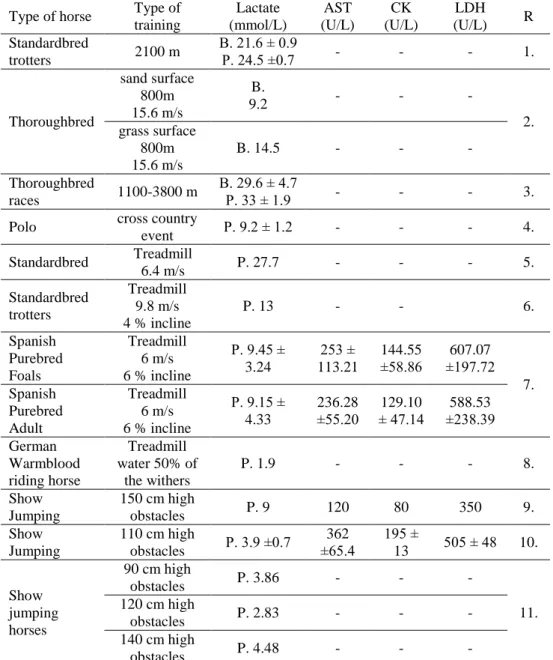
Table 2 : AST, CK LDH activities and lactate concentrations after exercise
P.: plasma lactate; B.: blood lactate; AST: aspartate aminotransferase; CK: creatine kinase, LDH: lactate dehydrogenase; values are means ± standard error of the mean; - not measured
R=references; 1: Pösö et al., 1995; 2: Davie and Evans, 2000; 3: Harris and Snow, 1988;
4: Geiser et al., 1994; 5: Gauvreau et al., 1996; 6: Couroucé et al., 2000; 7: Rubio et al., 2008; 8: Lindner et al., 2012; 9: Art. et al., 1990a; 10: Soares et al., 2011; 11: Covalesky et al., 1992
Type of horse Type of training
Lactate (mmol/L)
AST (U/L)
CK (U/L)
LDH (U/L) R Standardbred
trotters 2100 m B. 21.6 ± 0.9
P. 24.5 ±0.7 - - - 1.
Thoroughbred
sand surface 800m 15.6 m/s
B.
9.2 - - -
grass surface 2.
800m 15.6 m/s
B. 14.5 - - -
Thoroughbred
races 1100-3800 m B. 29.6 ± 4.7
P. 33 ± 1.9 - - - 3.
Polo cross country
event P. 9.2 ± 1.2 - - - 4.
Standardbred Treadmill
6.4 m/s P. 27.7 - - - 5.
Standardbred trotters
Treadmill 9.8 m/s 4 % incline
P. 13 - - 6.
Spanish Purebred Foals
Treadmill 6 m/s 6 % incline
P. 9.45 ± 3.24
253 ± 113.21
144.55
±58.86
607.07
±197.72 Spanish 7.
Purebred Adult
Treadmill 6 m/s 6 % incline
P. 9.15 ± 4.33
236.28
±55.20
129.10
± 47.14
588.53
±238.39 German
Warmblood riding horse
Treadmill water 50% of
the withers
P. 1.9 - - - 8.
Show Jumping
150 cm high
obstacles P. 9 120 80 350 9.
Show Jumping
110 cm high
obstacles P. 3.9 ±0.7 362
±65.4 195 ±
13 505 ± 48 10.
Show jumping horses
90 cm high
obstacles P. 3.86 - - -
120 cm high 11.
obstacles P. 2.83 - - -
140 cm high
obstacles P. 4.48 - - -
2.3.5. Glucose
It is the primary source of energy for body cells (Van Soest, 1994). It is transported from the intestines or liver to body cells via the bloodstream, and is absorbed by body cells with the intervention of the hormone insulin normally produced by the body. For muscle work it is crucial to use sugar and the continuous reload of glycogen stores. Glycogen - glucose polysaccharide molecules - can be found in all cells, but glycogen can only be stored in the liver and muscles. Reference range (Table 1) is 4.16- 6.39 mmol/L (Kaneko et al., 2008).
Long workload (more than 3 hours) decreases the plasma glucose level, but a shorter training can decrease and increase as well depending on the intensity of workload and dietary energy source (Pösö and Hyyppä, 1999;
Snow and MacKenzie, 1977). Art et. al. (1990a) measured similar values at rest (5.43 mmol/L) and after higher show jumping course (5.05 mmol/L). The same phenomenon has been observed in some horses after canter (Anderson, 1975a). Blood glucose has been reported to increase following racing and three-day event competition, and to fall with endurance exercise (Lindholm et al., 1974; Rose et al., 1980; Snow et al., 1983). Contrary to that, Andrews et al. (1995) measured significantly higher level of glucose after exercise in Endurance competition compared to the eventing competition. Experimental results have demonstrated that when carbohydrates are substituted with fat (oil) on isocaloric bases, the blood glucose and insulin levels are decreasing (Pagan et al., 1995).
Lower glucose level was observed after dry treadmill training of Thoroughbreds when 15% of the daily energy intake was provided as oil (Crandell et al., 1999). When oil substitutes soluble carbohydrates (starch, sugar) in the feed, the adaptation processes reduce the glucose substrate (carbohydrate to lipid shift in the metabolism) dependence of the work
(Treiber et al., 2008). The quality (fatty acid composition) of the dietary fat source modifies the glucose metabolism. Fish oil supplementation resulted in lower glucose level compared to the corn oil fed group (O'Connor and Lawrence, 2004).
2.3.6. Triglyceride
From a biochemical viewpoint, fats belong to a broad group of compounds known as lipids that can be glycerol or nonglycerol based (such as waxes, steroids, alkalines etc.). Glycerol-based lipids can be categorized simple and complex. Simple lipids contain only glycerol and fatty acids (such as monoglyceride, triglycerides), while complex lipids include glycerol, fatty acids plus another nutrient group (such as phospholipid, glycolipid). The main biological functions of lipids include energy storage, signalling, and acting as structural components of cell membranes (Fahy et al., 2009; Subramaniam et al., 2011). Triglycerides consist of three fatty acid molecules linked (ester bonds) to a glycerol backbone. Fatty acids may be grouped on the basis of the number of carbon atoms they contain and the number of double bonds (saturated or unsaturated). Very long chain fatty acids contain more than 22 carbon atoms, long-chain fatty acids contain 13 to 21 carbon atoms, medium- chain fatty acids contain 6 to 12 carbons, and short-chain or volatile fatty acids (VFAs), produced in the intestinal tract by bacterial fermentation, contain only 2 to 5 carbons. The fat, liver and gut endothelial cells can synthesize and the former store triglycerides. The reference range (Table 1) is 0.1-0.5 mmol/L (Kaneko et al., 2008).
Lipoproteins are complex aggregates of lipids and proteins (transported within the protein outer shell) which enable fats to be carried in the blood stream. The role of plasma lipoprotein particles is to transport
triglycerides, cholesterol, and phospholipids in the blood between all the tissues of the body. Lipoproteins are synthesized in the small intestine (travel into the blood stream via the lymphatic system) and the liver (released into the blood). Plasma lipoprotein particles can be classified based on their relative densities of the aggregates on ultracentrifugation HDL (high-density lipoproteins), LDL (low-density lipoproteins), IDL (intermediate-density lipoproteins), VLDL (very-low-density lipoproteins) and ULDL (commonly called chylomicron) lipoproteins. In adipose tissue, hydrolysis of fats free fatty acids are released into the blood stream where they bind to albumin.
Pösö et al. (1983) documented that the triglyceride concentration of blood depends on the genotype, because the ability of liver to metabolize triglyceride varies between horse breeds. Carreón et al. (2013) documented that the age of horses does not affect the level of triglyceride (Mayer et al., 1984), and the castration does not increase the triglyceride level, while in fleshy horses they measured significantly higher triglyceride level compared to moderate and thin horses. Similarly, Ju et al. (1993) did not find differences between different sexes of horses in triglyceride level. In contrast, Nazifi et al. (2005) documented increased triglyceride level with age. Nevertheless, Gupta et al. (2002) measured higher triglyceride level in 6 month old foals compared to 3 year old horses.
During high intensity training greater utilization of triglycerides can be observed (Li et al., 2012), and the triglyceride concentration decreases as the effect of constant training (Kedzierski and Podolak, 2002; Muñoz et al., 2002; Kedzierski et al., 2009). The triglyceride concentration increases in blood plasma after exercise as a function of the exercise intensity (Pösö and Hyyppä, 1990). Several studies demonstrated
(Kedzierski and Podolak, 2002; Muñoz et al., 2002; Kedzierski et al., 2009) that the high intensity training can cause higher triglyceride values which concentration decreases after several months of the training. But the level of triglycerides decreased after aqua training of Thoroughbred race horses (Li et al., 2012). These results suggest that race horse muscles are adapting to high intensity exercise by gaining higher oxidative capacity and an increased capacity for fat utilization as energy source (Li et al., 2012). Asadi et al. (2011) measured in Arab horses bred in Iran 1.92 mmol/L triglyceride level. Nevertheless, the physical activity (frequency and intensity of training) had no effect on serum triglycerides (0.31 mmol/L) of horses in Colima, Mexico (Carreón et al., 2013).
Nevertheless, Viana et al. (2007) documented that the elevated intensity of exercise increased the level of triglycerides. Furthermore, Pérez et al.
(1997) measured 0.28 mmol/L level of triglycerides in Chilean sport horses.
Trained horses adapted to fat supplementation promote greater flexibility in the selection of substrate for exercise demand (Treiber et al., 2008;
Treiber et al., 2006). Sloet van Oldruitenborgh-Oosterbaan et al. (2002) demonstrated significantly lower concentration of triglyceride in pre- exercise when the horses fed a high-fat (11.8% in dry matter) instead of a low-fat (1.5% fat) diet, when the horses were trained a standardised sub- maximal exercise test. Horses consuming fish oil had lower blood triglyceride concentration compared to those fed corn oil (O'Connor and Lawrence, 2004). This result indicates that not only the level of dietary fat, but its fatty acid profile also influences the plasma triglyceride level.
2.3.7. Cholesterol
Cholesterol is a waxy steroid (nonglycerol based lipid) of fat that is synthesized in the liver or intestines. It is important within cells, and it is a precursor for the biosynthesis of steroid hormones, bile acids, and vitamin D (Hanukoglu, 1992). Although cholesterol is important and necessary for mammals, high level of cholesterol in the blood can clog arteries and are potentially linked to diseases such as those associated with the cardiovascular system (heart disease). Cholesterol is only slightly soluble in water; it can dissolve and travel in the water-based bloodstream at exceedingly small concentrations. Since cholesterol is insoluble in blood, it is transported in the circulatory system within lipoproteins.
Reference range (Table 1) is 1.94-3.89 mmol/L (Kaneko et al., 2008) in the blood.
Carreón et al. (2013) documented that the age of horses does not affect the level of cholesterol (Mayer et al., 1984). In contrast, Nazifi et al.
(2005) documented that the level of cholesterol increases with age.
Nevertheless Gupta et al. (2002) measured higher cholesterol level in 6- month old horses compared to 3 year old horses. Cell proliferation requires cholesterol, therefore higher cholesterol level can be expected in younger animals.
Cholesterol level in blood plasma increases as a result of training but not due to conditioning (Hambleton et al., 1980). Nevertheless, Lopez et al.
(1974) demonstrated that cholesterol level decreases as the effect of exercise. While Asadi et al. (2011) measured 1.92 mmol/L cholesterol level in Arab horses bred in Iran. Sloet van Oldruitenborgh-Oosterbaan et al. (2002) demonstrated significantly higher concentration of cholesterol (3.00 ± 0.47 and 2.11 ± 0.49 mmol/L, respectively), HDL cholesterol (1.80 ± 0.18 and 1.35 ± 0.27 mmol/L, respectively) at rest in horses fed a
high-fat (11.8% in dry matter) instead of a low-fat (1.5% fat) diet when the horses were trained with a standardised sub-maximal exercise test (Mayer et al. 1984).
2.3.8. Cortisol
It is a corticosteroid hormone or glucocorticoid produced by zona fasciculata of the adrenal cortex, which is a part of the adrenal gland. Its primary function is to increase blood sugar and stores of sugar in the liver as glycogen (Hoehn and Marieb, 2010), and also suppresses the immune system. The cortisol level in the blood varies during the day. The reference range (Table 1) is 36-81 nmol/L (Kaneko et al., 2008).
Abnormally elevated cortisol level can be observed in clinical depression, psychological stress, and such physiological stressors as hypoglycemia, illness, pain, trauma, surgery, fear, fever, physical exertion or extremes of temperature. Increased serum concentration may be due to muscle damage or to injury of organs containing smooth muscle (Stockham and Scott, 2002).
Cortisol is increased in the horse during a wide variety of exercise activities (Hyyppä, 2001; Horohov et al., 1999). Release of cortisol allows an individual to tolerate and adapt to challenges to homeostasis that occur in everyday life (Willmore and Costill, 1994; Thornton, 1985).
Exercise has been associated with increase in plasma cortisol concentrations in many species including man (Farrell et al., 1983) and horse (Linden et al., 1991) and responses both exercise intensity and duration. The elevated cortisol level during aqua training indicates that this type of training does pose a stress situation on the horses, even if they had past experience. However, Marc et al. (2000) measured cortisol peak after the dry treadmill training. Plasma adrenaline, noradrenaline, beta-
Endorphin and cortisol concentrations were increased by training in cool dry conditions (cortisol: 90 ng/ml) and were further increased by the same exercise in hot humid (cortisol: 130 ng/ml) conditions (Williams et al., 2002). Art and Lekeux (1995) reported increases in plasma cortisol after treadmill exercise in hot and humid environment compared to temperate conditions. The plasma cortisol concentration better reflects duration of the workload rather than the work intensity (Saastamoinen and Martin- Rosset, 2008). The cortisol level has been shown to be involved in response to exercise and thermoregulation, although information regarding endocrine responses to the combined effects of exercise, heat stress and acclimation in man (Moseley, 1994; Mora-Rodriguez et al., 1996) and horse (Art and Lekeux, 1995) are limited. Maximum plasma concentration was observed about 30 min after the end of a high intensity exercise (Marc et al., 2000). Other researchers observed the maximum plasma concentration 5-30 min after the end of a short high intensity exercise (Jimenez et al., 1998; Nagata et al., 1999; Marc et al., 2000). It was demonstrated that discrimination based on cortisol net increase (due to exercise) between endurance and dressage plus jumping trained horses are possible. Covalesky et al. (1992) observed that more experienced horses have lower cortisol concentrations than less experienced ones after riding the course. Based on Coenen's (2005) studies different metabolic stresses – like jumping – can double the level of plasma cortisol.
2.3.9. Bilirubin
It is the breakdown product of haemoglobin. Based on studies of Ralston and Larson (1989) and Gaál (1999) increased bilirubin level occurs if the horse is worked beyond what it is capable of, creating muscle damage and red cell damage too, or if there is a problem with the bile ducts or the
liver. The reference range (Table 1) is 7.1-34.2 µmol/L (Kaneko et al., 2008).
2.4. Conclusions from the literature
As a result of exercise several blood biochemical parameters are changes, however, most studies deal with lactate only. Lactate level can vary in a wide range, which depends on the intensity, duration and type of exercise.
Therefore, the characterization of lactate response to aqua training and the measurement of other biochemical parameters are necessary. Since plasma parameters response to treadmill training does not reflect in field tests, the evaluation of deep water aqua treadmill training in competition environment is necessary. Dietary energy sources can affect the metabolic response to exercise, thus testing feeds varying in main energy source is necessary to better understand the metabolic changes occurring during and as a result of aqua training.
3. OBJECTIVES OF THE DISSERTATION
The main aims of research project were the following:
To study the effect of age and event on show jumpers plasma biochemical and enzyme activity parameters measured post competition.
To study the effect of increasing aqua treadmill training intensity on the heart rate and several plasma biochemical parameter of show jumpers during aqua training and after competition.
To examine the correlation between plasma biochemical parameters of show jumpers before and after deep water aqua training and jumping course completion.
To determine the effect of different main dietary energy sources on several blood biochemical parameters on deep water aqua treadmill trained show jumpers using the energy source more diffused under field conditions.