RESEARCH
Water-splitting-based, sustainable and efficient H 2 production in green
algae as achieved by substrate limitation of the Calvin–Benson–Bassham cycle
Valéria Nagy1, Anna Podmaniczki1, André Vidal‑Meireles1, Roland Tengölics2, László Kovács1, Gábor Rákhely3,4, Alberto Scoma5 and Szilvia Z. Tóth1*
Abstract
Background: Photobiological H2 production has the potential of becoming a carbon‑free renewable energy source, because upon the combustion of H2, only water is produced. The [Fe–Fe]‑type hydrogenases of green algae are highly active, although extremely O2‑sensitive. Sulphur deprivation is a common way to induce H2 production, which, however, relies substantially on organic substrates and imposes a severe stress effect resulting in the degradation of the photosynthetic apparatus.
Results: We report on the establishment of an alternative H2 production method by green algae that is based on a short anaerobic induction, keeping the Calvin–Benson–Bassham cycle inactive by substrate limitation and preserv‑
ing hydrogenase activity by applying a simple catalyst to remove the evolved O2. Cultures remain photosynthetically active for several days, with the electrons feeding the hydrogenases mostly derived from water. The amount of H2 produced is higher as compared to the sulphur‑deprivation procedure and the process is photoautotrophic.
Conclusion: Our protocol demonstrates that it is possible to sustainably use algal cells as whole‑cell catalysts for H2 production, which enables industrial application of algal biohydrogen production.
Keywords: Biohydrogen, Calvin–Benson–Bassham cycle, Chlamydomonas reinhardtii, Hydrogenase, Oxygen absorbent, Oxygen evolution, Photosynthesis
© The Author(s) 2018. This article is distributed under the terms of the Creative Commons Attribution 4.0 International License (http://creat iveco mmons .org/licen ses/by/4.0/), which permits unrestricted use, distribution, and reproduction in any medium, provided you give appropriate credit to the original author(s) and the source, provide a link to the Creative Commons license, and indicate if changes were made. The Creative Commons Public Domain Dedication waiver (http://creat iveco mmons .org/
publi cdoma in/zero/1.0/) applies to the data made available in this article, unless otherwise stated.
Background
Among the potential, renewable energy-converting tech- nologies, photobiological H2 production stands out as an appealing choice, because it is carried out by microorgan- isms in an aqueous environment, possibly without arable land requirement. Biohydrogen produced by algae may become a genuinely carbon-free energy carrier because, as opposed to bioethanol and biodiesel production, upon the combustion of H2 only water is produced (reviewed by [1]).
[Fe–Fe]-type hydrogenases found in green algae are one of the most active molecular catalysts known for H2 production. The green alga C. reinhardtii has two [Fe–Fe]-type hydrogenase paralogues, called HydA1 and HydA2; the turnover rate of the major form, HydA1, is several thousands per second, approx. 100-fold higher than that of other type of hydrogenases [2]. Hydroge- nases are located in the chloroplasts stroma, at the accep- tor side of photosystem I (PSI, Fig. 1a). They may receive electrons from various sources, of which photosynthetic linear electron transport may be the most prominent one. Starch degradation can also feed electrons into the electron transport via the NAD dehydrogenase (NDH) complex, independently of photosystem II (PSII) activity.
The third pathway for H2 production includes pyruvate
Open Access
*Correspondence: toth.szilviazita@brc.mta.hu
1 Institute of Plant Biology, Biological Research Centre of the Hungarian Academy of Sciences, Szeged, Temesvári krt. 62, 6726 Szeged, Hungary Full list of author information is available at the end of the article
0 5 10 15 20 25
0 0.2 0.4 0.6 TAP TP 0.8
HS HSA
0 20 40 60 80
8 12 16 20 24
0 4 0 4 8 12 16 20 24 0
0.5 1 1.5 2 2.5
TAP TP
HS HSA
0 10 20 30
HS TAP-S TP-S
0 20 40 60
24 48 72 96 24 48 72 96
HS TAP-S TP-S Time (h)
µl H2 / ml culture µl O2 / ml culture
Time (h)
Time (h) Time (h)
µl H2 ml-1 day-1
b c
d e
% of H2 in headspace % of O2 in headspace
a
******
***
* ***
***
** *
LHC PSII PQ-pool PSI LHC
Calvin-Benson- Bassham cycle
HydA
FNR
CO2
GP
NAD(P)H NADP+ NADPH ADP+Pi ATP
NAD(P)+
H+ NDH Fd
H2
2H+ Starch
Pyruvate Chloroplast stroma
Acetyl -CoA +CO2
PFR
e- e- e-
QA e- e-
e-
cytb6f e-
H+ PC
P680 P700 OEC
e- e- O2 + 4H+
2 H2O Thylakoid lumen
µl O2 ml-1 day-1
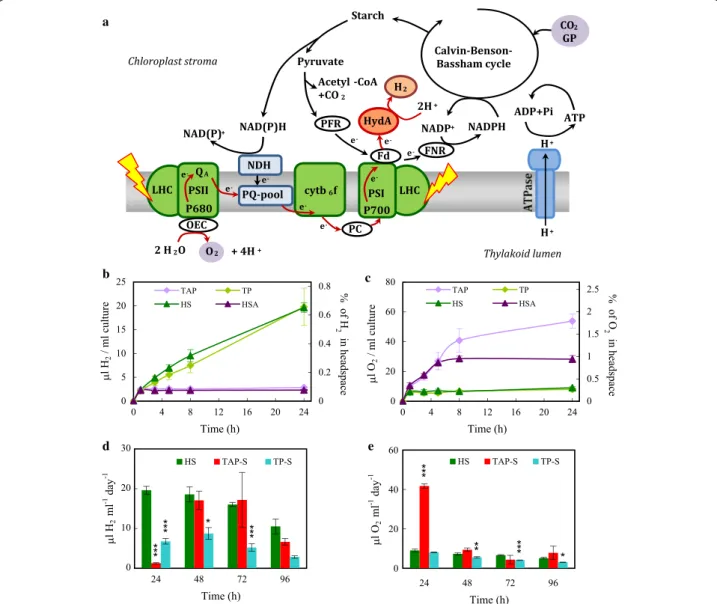
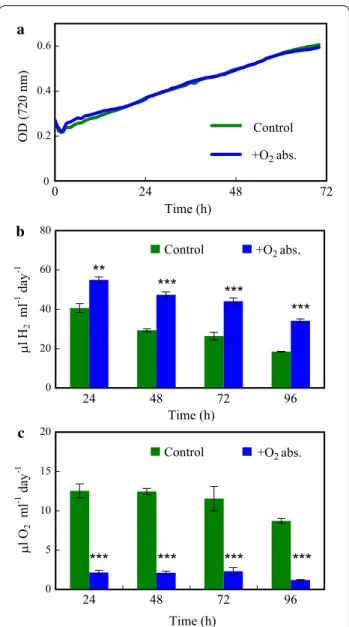
Fig. 1 H2 production in Chlamydomonas reinhardtii. a Schematic presentation of the photosynthetic electron transport chain in green algae.
Solar energy is captured by the light‑harvesting complexes (LHC) of photosystem II and I (PSII and PSI). Electrons extracted from water by the oxygen‑evolving complex (OEC) of PSII are transferred to the photosynthetic electron transport chain via the plastoquinone (PQ)‑pool, the cytochrome b6f complex (cyt b6f ), plastocyanin (PC), PSI and ferredoxin (Fd). From Fd, electrons can be transferred by the ferredoxin‑NADP+ oxidoreductase (FNR) to NADP+ or to the hydrogenase (HydA; for clarity, oxygen‑dependent alternative pathways are not shown). H+ accumulated in the thylakoid lumen are used for ATP production via ATP synthase. The ATP and NADPH generated during primary photosynthetic processes are consumed for CO2 fixation in the Calvin–Benson–Bassham (CBB) cycle, which produces sugars and ultimately starch. When cultures are grown in the presence of acetate, glycerate 3‑phosphate (GP) may also feed the CBB cycle. Hydrogenases are expressed under anoxic conditions; upon illumination, significant H2 production may occur. The water‑oxidation dependent pathway of H2 production is denoted with red line. Depending on the conditions, starch degradation may also contribute to H2 production either via the NAD dehydrogenase (NDH) complex, PSII‑independent pathway, or via pyruvate‑Fd‑oxidoreductase (PFR). b H2 production in CC124 Chlamydomonas cultures (50 µg chl (a + b)/ml, at 320 µmol photons/
m2/s) as determined in the headspaces of sealed cultures using gas chromatography during 24 h in acetate‑containing (TAP, HSA) and acetate‑free media (TP, HS) following dark anaerobic incubation (4 h darkness with 3 × 10 min N2 flushing). In the right Y axis, the percentage of H2 in the headspaces of the cultures are shown. Time point 0 indicates the time when the cultures were transferred to the light. c Net O2 production under the same conditions as in b. d Daily H2 production in sulphur‑containing HS medium of cultures subjected to dark anaerobic incubation and in cultures transferred to sulphur‑free acetate‑containing (TAP‑S) or acetate‑free (TP‑S) media. All the alga cultures (HS, TAP‑S, TP‑S) were illuminated continuously and flushed every 24 h with N2 after determining the gas concentrations in the headspaces of the sealed bottles to avoid excessive H2 accumulation (cf. [7]) and overpressure in the headspace. e Net O2 production under the same conditions as in d. Mean values (± SEM) are each based on 6 biological replicates. Statistical significance levels are presented relative to the Chlamydomonas culture subjected to dark anaerobic incubation in HS medium as *p < 0.05, **p < 0.01, ***p < 0.001
oxidation through pyruvate–ferredoxin-oxidoreductase (PFR; reviewed by [1]).
Hydrogenases become highly expressed under hypoxic conditions established for instance during the night when the microbial community consumes the available O2; upon illumination, electrons from ferredoxin (FDX) in PSI are transferred to the hydrogenases. Out of the 13 types of FDXs found in Chlamydomonas [3], FDX1 and FDX2 contribute to H2 production [4, 5]. The midpoint redox potential of the major photosynthetic FDX1 is
−0.398 V enabling efficient electron donation to HydA [6, 7].
Hydrogenases catalyze the reduction of protons, thereby supporting an alternative electron transport to prevent the over-reduction of the photosynthetic elec- tron transport chain upon dark-to-light transitions.
By this reaction, hydrogenases also promote the light- induced increase of stromal pH necessary for the acti- vation of the Calvin–Benson–Bassham (CBB) cycle, ultimately supporting ATP formation (reviewed by, e.g.
[8, 9]). Thus, hydrogenases play an essential role upon the induction of photosynthesis in green algae [10]. Once the electron transport is fully functional, the O2 evolved by PSII reacts with hydrogenases, leaving an inactive [4Fe–4S] subcluster state [11] and with O2 also inhibiting HYDA1 gene expression [12, 13].
Owing to the high theoretical efficiency of converting the energy of sunlight into chemical energy [2], photo- biological H2 production by green algae has been studied for decades with O2 sensitivity of the hydrogenases being a major hurdle in reaching commercial viability. Engi- neering O2-insensitive hydrogenases has been attempted with moderate success (e.g. [14]). Alternatively, hypoxia can be established by downregulating PSII activity, most commonly by sulphur deprivation (e.g. [15], reviewed recently by [16]). However, this method is unspecific and results in the degradation of photosynthetic complexes and cell death on the timescale of days [17]. H2 pro- duction induced by sulphur deprivation is also strongly dependent on acetate or other organic carbon sources, meaning that in a narrow sense it is not a photoauto- trophic process [18, 19], and has a low inherent energy conversion efficiency [20]. As it stands, it is very unlikely that sulphur deprivation will represent a viable procedure for industrial H2 production [20]. Nitrogen [21], phos- phorous [22] and magnesium starvations [23] have been also attempted, but pose similar problems to sulphur deprivation.
H2 production can also be induced in nutrient-replete Tris–acetate–phosphate (TAP) medium, by incubat- ing Chlamydomonas cultures in the dark for a few hrs in O2-free atmosphere and exposing them to relatively low light. Under these conditions, H2 production is
temporary, because the evolved O2 inhibits the hydroge- nases within a few hrs (reviewed by [24]). By incubating the cultures under very low light conditions, a balanced O2 evolution and respiration can be established, resulting in low-yield H2 production lasting for several days [25].
This type of H2 production depends largely on photosyn- thesis and partly on fermentative processes [25]. The yield of H2 production can be increased by enhancing acetate respiration [26], which, however, represents a severe loss of efficiency, as for each H2 produced an equivalent amount of substrate is respired [27]. A direct and efficient conversion of solar energy to H2 in a carbon–neutral way is required for commercial viability [20, 28]. Anaer- obiosis-induced H2 production has been observed in photoautotrophic (i.e. acetate-free, CO2-supplemented) cultures as well, in which H2 production lasted for sev- eral days at low light [29, 30]), although with a very low efficiency as compared to the widely used sulphur-depri- vation method in TAP medium. Thus, in recent protocols applying anaerobic incubation the CBB cycle was opera- tional, even though the competing nature of CO2 assimi- lation and H2 production was already shown by Gaffron and Rubin [31] upon discovering the photoproduction of H2 by green algae.
The present approach to improve photobiological H2 production stem from the ultimate physiological role of the highly efficient hydrogenases found in green algae (Fig. 1a). Their primary function is to serve as a safety valve [32], i.e. alternative electron acceptors upon the induction of photosynthesis in hypoxia [10, 33]; once the photosynthetic apparatus is fully functional, the hydro- genases become inactive by the evolved O2. We show here that by preventing the activation of the CBB cycle in the light via substrate limitation (i.e. by omitting CO2 or acetate), the photosynthetic electron transport chain remains largely reduced, resulting in low O2 evolution and high H2 production lasting for several days. The addi- tional application of an iron-based O2 absorbent resulted in yields that are significantly greater than for the stand- ard sulphur deprivation procedure.
Results
Dark anaerobic incubation of Chlamydomonas cultures followed by continuous illumination in acetate‑free media results in substantial H2 production lasting for several days Dark anaerobic incubation treatments to induce hydro- genase expression were carried out with the CC124 strain of Chlamydomonas reinhardtii, because it is a relatively efficient H2 producer and has been successfully used under various conditions (e.g. [34–37]). After growing the cultures for 3 days in TAP medium, the cells were transferred to culture media with (TAP, HSA) or without acetate (TP, HS) with a chlorophyll (chl) (a + b) content
set at 50 µg/ml. Hydrogenase expression was induced by a 4-h dark anaerobic incubation during which N2 flush- ing was applied to remove both O2 and CO2. The high chl (a + b) content was set to facilitate the establishment of anaerobiosis, PQ-pool reduction and high hydrogenase expression [38]. For a general scheme of the experimental setup, see Additional file 1: Fig. S1.
As opposed to most earlier studies in nutrient-replete conditions, we subjected the cultures to relatively high light intensities (320 µmol photons/m2/s provided by white fluorescent tubes) after the dark anaerobic induc- tion. Upon light exposure, H2 production (approx. 2 µl H2/ml culture) was observed during the first hour in all growth media. In acetate-containing media (TAP and HSA), prolonged illumination did not result in further H2 production, whereas in acetate-free media (HS, TP) H2 production continued (approx. 20 µl H2/ml culture in 24 h, Fig. 1b). The amount of O2 in the headspace of the vials rapidly accumulated in the presence of acetate (Fig. 1c), whereas in its absence the O2 concentration remained at a low level (approx. 9 µl O2/ml culture was produced, corresponding to approx. 0.3% O2 in the head- space). As cultures kept in HSA or TAP had low H2 yields and both TP and HS cultures produced large amounts of H2, the increase in H2 production efficiency was attrib- uted to the absence of acetate. Therefore, in the following experiments, we opted for the HS media, as it is com- monly used as a minimal media for studying algal physi- ology (e.g. [39]).
Next, we compared the efficiency of H2 production fol- lowing a dark anaerobic induction in HS medium (per- formed as described above) with the classical sulphur deprivation method that is largely dependent on acetate [18, 40]. In cultures induced by dark anaerobiosis in HS media approx. 20 µl H2/ml (= 16.32 nmole H2/µg chl (a + b)) was produced during the first 24 h (Fig. 1d). The produced gases were removed every 24 h by N2 flushing after determining the amount of gases produced to pro- mote the establishment of hypoxia, and to avoid a high H2 partial pressure [7] and overpressure in the headspace of the cultures. Using this method, the total H2 produc- tion in HS media was approx. 65 µl H2/ml culture in 96 h (Fig. 1d, sum of the green columns). In the case of sul- phur deprivation (TAP-S, Fig. 1d), H2 production was low during the first 24 h, with the maximum H2 output detected after 48 and 72 h; the total production was approx. 42 µl H2/ml culture in 96 h (Fig. 1d, sum of the red columns). This productivity is consistent with ear- lier results obtained with the CC124 strain when using sealed flasks (e.g. [37, 41]), but it is below the yields attained with improved photobioreactor (PBR) systems on the same timescale (approx. 200 µl H2/ml culture in 96 h, [42]). When acetate was omitted from the media of
cultures subjected to sulphur deprivation (TP-S, Fig. 1d), the amount of H2 produced was strongly diminished, corroborating the notion that the sulphur deprivation procedure is acetate-dependent [18, 40].
After 24 h of illumination, approx. 9 µl O2/ml was accumulated in the HS and TP-S cultures, whereas 40 µl O2/ml culture accumulated in the headspaces of sulphur- deprived samples (corresponding to approx. 1.3% O2, Fig. 1e).
These results demonstrate that anaerobic induction of hydrogenases in minimal (i.e. acetate-free) media can result in sustained H2 production of several days, with yields higher than in TAP-S media at equivalent culture conditions.
Origin and regulation of H2 production in acetate‑free media
Since the H2 production induced by anaerobic incubation is carried out in acetate-free media, and no sulphur depri- vation is involved that would induce starch accumulation [17], electrons supporting H2 production likely origi- nated directly from water (Fig. 1a). To test this hypoth- esis, we first measured the starch content throughout the experiment (Additional file 2: Fig. S2). The starch content of control, aerobic cultures was about 0.25 mmol/l, typi- cal of aerobic, non stressed samples [43]. Following the 4-h dark-incubation starch content decreased to about 0.05 mmol/l. Upon transfer to the light (i.e. the start of H2 production) the starch content increased but did not reach the control level. Between 24 and 96 h of H2 pro- duction, there was no major change in the starch content, indicating that starch degradation does not contribute significantly to H2 production.
Next, we treated the cells with 3-(3′,4′-dichlorophenyl)- 1,1-dimethylurea (DCMU), which irreversibly binds to the QB site in PSII [44]. Upon the application of DCMU, the amount of O2 in the headspace decreased and H2
production ceased with a slight delay (Fig. 2a, b), possi- bly due to degassing of H2 from the media. DMSO-treat- ment used as a control resulted in no discernable effect on H2 and O2 productions relative to the control (Fig. 2a, b). These results demonstrate the direct dependence of H2 production on PSII electron transport and water- splitting, and suggest that the contribution of cellular respiration to H2 production is minor.
To test whether respiration contributes to the estab- lishment of hypoxic conditions, we treated the cul- tures with potassium cyanide (KCN, inhibiting the terminal oxidase) and salicylhydroxamic acid (SHAM, inhibiting the alternative oxidase). Upon their addi- tion, the O2 concentration in the headspace of the cul- tures increased suddenly from approx. 0.3 to 0.9%, and remained at this level thereafter (Fig. 2d). Upon the
0 5 10 15 20
0 0.15 0.3 0.45 0.6 0
10 20 30 40 50
0 0.4 0.8 1.2 1.6
0 50 100 150 200 250
0 2 4 6 e 8
µl H2 / ml culture µl O2 / ml culture
f
0 10 20 30 40 50
0 0.4 0.8 1.2 1.6
0 5 10 15 20
0 0.15 0.3 0.45 0.6
µl H2 / ml culture µl O2 / ml culture
g h
0 10 20 30 40 50
8 12 16 20 24
0 4
0 4 8 12 16 20 24
0 0.4 0.8 1.2 1.6
µl H2 / ml culture
Time (h)
µl O2 / ml culture
Time (h) j
i
Control +CO2
Control +CO2
Control +GA
Control +GA
Control +FCCP
Control +FCCP
% of H2 in headspace % of O2 in headspace
% of H2 in headspace% of H2 in headspace % of O2 in headspace% of O2 in headspace
0 10 20 30 40 50
0 0.4 0.8 1.2 c 1.6
µl H2 / ml culture
d Control
+KCN+SHAM
% of O2 in headspace
% of H2 in headspace 0
10 20 30 40 50
0 0.4 0.8 1.2 1.6
0 5 10 15 20
0 0.15 0.3 0.45 Control 0.6
+DCMU
µl H2 / ml culture
b
a 2% of H in headspace l O / ml cultureµ2 2% of O in headspace
+DMSO
Control +DCMU +DMSO
0 10 20 30 40
0 0.3 0.6 0.9 1.2
µl O2 / ml culture
Control KCN+SHAM
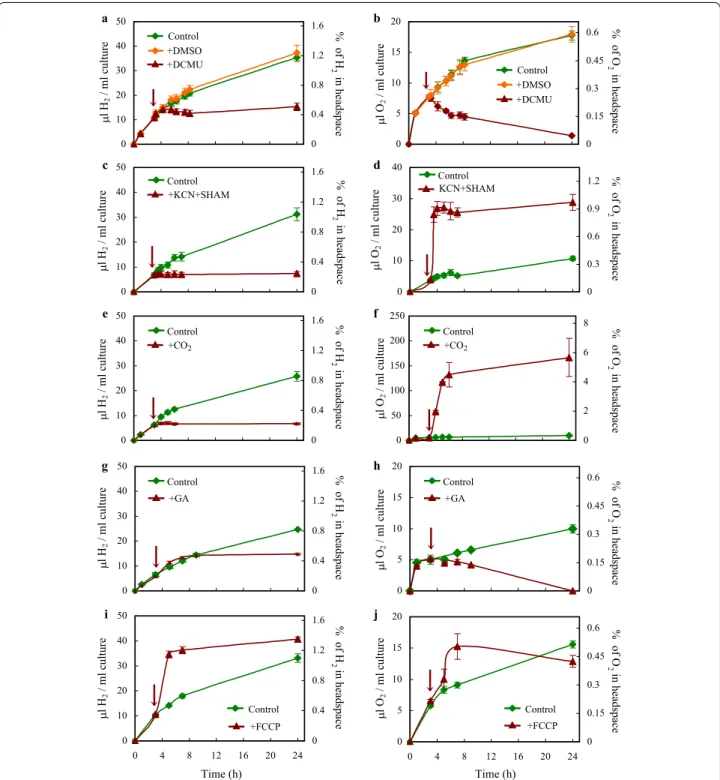
Fig. 2 Photosynthetic electron transport during H2 production of Chlamydomonas in acetate‑free HS medium induced by dark anaerobic incubation. a, b H2 and net O2 productions upon the addition of the PSII inhibitor DCMU, and DMSO, used as a control. c, d H2 and net O2 productions upon the addition of the respiratory inhibitors potassium cyanide (KCN) and salicylhydroxamic acid (SHAM). e, f H2 and net O2 productions upon the addition of 2% CO2. g, h H2 and net O2 productions upon the addition of the CBB cycle inhibitor glycolaldehyde (GA). i, j H2 and net O2 productions upon the addition of and the ionophore carbonylcyanide p‑triflouromethoxyphenylhydrazone (FCCP). The time points at which the various treatments were applied are indicated by arrow. In the right Y axis, the percentage of the corresponding gases in the headspaces of the cultures are shown. All experiments were carried out at 320 µmol photons/m2/s following the 4‑h dark anaerobic incubation (0 time point).
Mean values (± SEM) are each based on 4 or 5 biological replicates
application of the respiratory inhibitors, H2 production ceased (Fig. 2c), probably as a result of the increased O2
concentration.
In Chlamydomonas, acetate assimilation may occur via the tricarboxylic acid cycle and the glyoxylate cycle, which are metabolically linked to gluconeogenesis and the oxidative pentose phosphate pathway [45, 46]. The released CO2 and glycerate 3-phosphate feed the CBB cycle for which the reducing power generated by the pho- tosynthetic electron transport is also utilized (Fig. 1a), as indicated by the extreme light sensitivity of various Rubisco mutants [47, 48]. We hypothesized that in the absence of acetate and CO2, the CBB cycle is mostly inactive and the electrons originating from the photo- synthetic electron transport chain are transferred to the hydrogenases. To ascertain about this, we added 2%
CO2 (v/v) into the headspace of the cultures. As a result, H2 production ceased, whereas O2 production strongly increased (Fig. 2e, f). Concomitantly, the amount of CO2
in the headspace of the cultures diminished rapidly and after 24 h no CO2 could be detected (Additional file 3:
Table S1).
When the CBB cycle inhibitor glycolaldehyde (GA) was added, H2 production was unchanged during the ini- tial 9 h, whereas the O2 concentration in the headspace decreased (Fig. 2g, h). By the 24th hour, H2 production ceased and no O2 could be detected, which is most prob- ably due to a side-effect of GA on photosynthesis [49].
These results demonstrate that the CBB cycle activity, which would compete for electrons with the hydroge- nases, must be low. There may be some remaining activ- ity only at the beginning of illumination explaining the transitional increase in starch content following the dark- anaerobic incubation (first 24 h in the light, Additional file 2: Fig. S2).
Upon low substrate availability for the CBB cycle, the consumption of ATP and NADPH is decreased, trigger- ing adjustments of the light reactions to prevent damage to the photosynthetic apparatus. Under these conditions, PSI cyclic electron transport is increased, contributing to a strong thylakoid lumen acidification, which trig- gers photoprotective quenching mechanisms to dissipate excess energy (reviewed by, e.g. [50]). Lumen acidifica- tion also slows down the oxidation of plastoquinol by the cytochrome (cyt) b6f complex, resulting in a reduced PQ-pool and decreased electron transport from PSII; by this so-called “photosynthetic control” mechanism, the accumulation of electrons on PSI is prevented, which can otherwise lead to photodamage [51–53]. Under these conditions, the rate of charge recombination in PSII increases and the rate of O2 evolution decreases [54].
The excess reducing power in the photosynthetic elec- tron transport may be alleviated by alternative pathways
in Chlamydomonas, including the Mehler reaction, the malate shuttle, the plastid terminal oxidase and the flavodiiron-dependent photoreduction reduction path- ways (reviewed by [50, 55]). However, these pathways are O2-dependent and under hypoxic conditions elec- tron transport to the hydrogenases may represent a more suitable safety valve. To test the possibility that thylakoid lumen acidification in the light may limit linear electron transport and thereby O2 and H2 production, we treated the cultures with the ionophore carbonylcyanide p-trif- luoromethoxyphenylhydrazone (FCCP) in the light [56, 57]. Upon the addition of FCCP, H2 evolution increased promptly, followed by a transitory increase in O2 evolu- tion (Fig. 2i, j), in agreement with the notion that a high ΔpH may limit linear electron flow to the hydrogenases [58].
The fast chl a fluorescence (OJIP) transient is a sensi- tive and widely used indicator of photosynthetic func- tion (e.g. [59]); its F0 and FJ values can be used to estimate the redox status of the PQ-pool [60, 61]). The latter was evaluated in cell cultures collected directly from serum bottles during H2 production experiments, with no dark- adaption prior to the measurement (Additional file 4:
Fig. S3). F0 and FJ values were relatively high in the cul- tures producing H2, indicating that the PQ-pool was in a reduced state. This result corroborates that “photosyn- thetic control” is an important factor in the establish- ment of the H2 producing conditions.
When measuring the rate of H2 production with a higher time resolution in continuous light following dark anaerobic incubation (Fig. 3a), we observed a burst of H2 production, as typically occurring in such dark–light transitions [62]. Approximately 2.3 µl H2/ml culture was produced in 8 min, corresponding to a rate of 15.76 µmol H2/mg chl (a + b)/h. This was followed by a lower H2
production rate (1.31 µmol H2/mg chl (a + b)/h between 1 and 5 h) during which approx. 0.2% O2 accumulated gradually in the gas phase (Fig. 3b). The [Fe–Fe]-type hydrogenases of C. reinhardtii have an I50 of 0.3–0.4% O2
as determined upon a 2-min incubation in vivo [63], with a very minor fraction remaining active at atmospheric O2
levels [64]. Thus, a prolonged exposure to 0.2% O2 may explain the decreasing rate of H2 production.
A way to keep the hydrogenases active may be eliminat- ing the produced O2 [65]. As a first approach, we added glucose (Glc), glucose oxidase (GO) and ascorbate (Asc) to the cultures to scavenge O2 [60]. The separate additions of Glc, GO and Asc had minor effects on the amount of evolved O2 and H2 (Additional file 5: Table S2). Upon the combined Glc + GO + Asc treatment, the amount of O2
in the headspace was reduced (Fig. 3d), and concomi- tantly, the amount of H2 produced in 3 h increased ten- fold, from approx. 8–85 µl H2/ml culture (equal to 1.36
and 23.13 µmol H2/mg chl (a + b)/h, respectively; Fig. 3c).
These values correspond to light-to-H2 energy conver- sion efficiencies of 0.29 and 2.95% in the absence and presence of Glc + GO + Asc, respectively (Table 1, see
“Materials and methods” for the calculations). However, this treatment is not a viable option for a long-term H2
production because of the Glc requirement and the con- comitant reactive oxygen species production [66]; thus we searched for another possibility.
Preserving hydrogenase activity using an iron‑salt based O2absorbent
Decreasing the amount of O2 in the cultures can be achieved by (i) downregulating PSII activity (e.g.
[15, 67]), which is precarious, because PSII is the main source of reducing power; (ii) increasing the respiration:photosynthesis ratio [25], which is limited to low light intensities and requires significant amounts of organic substrates overall leading to low energy conver- sion efficiencies; and (iii) bacterial respiration [35], with the drawback that it also requires acetate or other organic carbon source. Intense flushing with ultra-pure helium has been adopted to preserve hydrogenase activity [65, 68]; hemoglobin, myoglobin and cobalt chelates have
0 3 6 9 12
0 0.1 0.2 0.3 0.4
µl H2 / ml culture
H2
0 2 4 6 8
0 0.05 0.1 0.15 0.2 0.25
µl O2 / ml culture
O2
0 30 60 90 120
0 1 2 3 4
0 2 4 6 8
0 1 2 3 4 5 0 1 2 3 4 5 0
0.05 0.1 0.15 0.2 0.25
µl H2 / ml culture
Time (h) Time (h)
µl O2 / ml culture b a
Control +Glc+GO+Asc Control
+Glc+GO+Asc
d
c 2% of H in headspace 2% of O in headspace
% of H2 in headspace % of O2 in headspace
Fig. 3 The effect of O2 on the H2 production of Chlamydomonas in acetate‑free HS medium induced by dark anaerobic incubation. a, b Detailed time courses of H2 and net O2 productions during the initial 5 h of illumination at 320 µmol photons/m2/s. c, d The effects of glucose (Glc, 2 mM), glucose oxidase (GO 0.2 mg/ml) and ascorbate (Asc, 1 mM) on H2 and net O2 productions, added after the dark anaerobic incubation. In the right Y axis, the percentage of the corresponding gases in the headspaces of the cultures are shown. Mean values (± SEM) are each based on 4–8 biological replicates
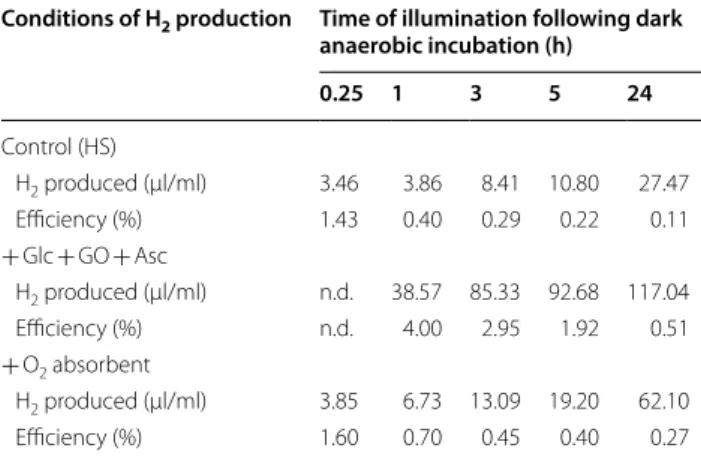
Table 1 Light-to-H2 energy conversion efficiency in Chlamydomonas reinhardtii in HS medium under various conditions
Algal cultures containing 50 µg chl (a + b)/ml and dark-incubated for 4 h were illuminated using cool white fluorescent tubes, at an intensity of 52 W/
m2, corresponding to approx. 320 µmol photons/m2/s. See “Materials and methods” for the calculations on the incident light-to-H2 conversion efficiency.
The experiments were carried out in HS medium (control) and the effects of a combined glucose (Glc, 2 mM), glucose oxidase (GO, 0.2 mg/ml) and ascorbate (Asc, 1 mM) treatment and the effects of an iron-salt O2 absorbent were also assessed
nd non-determined
Conditions of H2 production Time of illumination following dark anaerobic incubation (h)
0.25 1 3 5 24
Control (HS)
H2 produced (µl/ml) 3.46 3.86 8.41 10.80 27.47
Efficiency (%) 1.43 0.40 0.29 0.22 0.11
+ Glc + GO + Asc
H2 produced (µl/ml) n.d. 38.57 85.33 92.68 117.04
Efficiency (%) n.d. 4.00 2.95 1.92 0.51
+ O2 absorbent
H2 produced (µl/ml) 3.85 6.73 13.09 19.20 62.10
Efficiency (%) 1.60 0.70 0.45 0.40 0.27
also been used in short-term experiments to remove the evolved O2 [69].
Here, we opted for using a chemical O2 absorbent, a mixture of iron powder and sodium chloride, widely used in the food industry (for details, see “Experimental proce- dures”). It is highly active (1 g absorbent can absorb up to 13 ml O2 at room temperature; e.g. [70]), biologically safe and very cheap (O20TM; http://www.o2zer o.com, 20 cc).
We placed a small amount (approximately 1.3 g) of O2
absorbent into a 2-ml vial and introduced it into the head- space of the serum bottle, above the Chlamydomonas culture (Fig. 4a). This system resulted in approx. twofold higher H2 productions (Fig. 4b), reaching approx. 200 µl H2/ml culture in 96 h [equal to approx. 163.3 µmol H2/ mg chl (a + b)]. The concentration of O2 in the head- space accumulated in 24 h was lowered to approx. 2.1 µl O2/ml culture (Fig. 4c), corresponding to 0.07% O2 in the headspace.
The light-to-H2 energy conversion efficiency was approx. 1.5% both in the absence and presence of the O2
absorbent following the anaerobic incubation and 15 min of illumination. However, after 24 h of illumination the light-to-H2 energy conversion efficiency decreased to approx. 0.11% in the control samples (HS), whereas it was more than two times higher (approx. 0.27%) when the O2 absorbent was present (Table 1). In earlier sulphur deprivation experiments carried out in PBRs and in the presence of acetate, the maximum light-to-H2 conver- sion efficiency was in the range 0.13–3.22%, whereas in nutrient-replete conditions with acetate, it was much lower, approx. 0.1% (see Table 3 in [25], for a comparison on various H2 producing conditions).
We have also compared the H2 production yields at three different chl concentrations. In the absence of the O2 absorbent, the total amounts of H2 produced in 96 h
were approx. 50, 90 and 105 µl/ml culture at 15, 30 and 50 µg chl (a + b)/ml culture, respectively. In the presence of the O2 absorbent, productivities increased to approx.
120, 210 and 227 µl H2/ml culture, respectively (Addi- tional file 6: Fig. S4). Thus, reducing the chl content from 50 to 15 µg chl (a + b)/ml improved H2 production on a chl basis even in the absence of the O2 absorbent (from 2.1 to 3.3 ml H2/mg chl (a + b), respectively).
Daily N2 flushing was applied to periodically remove the produced gases. To test whether this was essential, we carried out an experiment without gas removal. In the absence of the O2 absorbent and without N2 flushing, the amount of H2 produced was reduced by about 50%.
However, when O2 absorbent was present, the amounts of H2 were in the same range with our without N2 flush- ing (Additional file 7: Fig. S5).
Next, we assessed the expression and the activity of hydrogenases in the presence and absence of the O2
absorbent. During the 4-h dark anaerobic incubation period, the HYDA1 transcript level increased approx.
11-fold, as determined by quantitative RT-PCR analysis (Fig. 5a), which was followed by a decrease both in the presence and absence of the O2 absorbent, possibly due to the strong inhibitory effect of O2 on HYDA1 expres- sion [12, 13]. The amount of HydA enzyme as deter- mined semi-quantitatively by western blot analysis, also showed a strong upregulation upon the 4-h dark anaer- obic incubation period. Later on, the amount of HydA decreased, which was attenuated by the O2 absorbent (Fig. 5b). Following the dark anaerobic incubation, the in vitro hydrogenase activity, as determined in the pres- ence of reduced methylviologen as an electron donor, was approx. 500 µmol H2/mg chl (a + b)/h, in agree- ment with literature data ([24]; see “Experimental proce- dures” for details). Upon 4 h of illumination, the in vitro
0 20 40 60 80
24 48 72 96 0
5 10 15 20
24 48 72 96
µl H2 ml-1 day-1
Time (h) µl O2 ml-1 day-1
Control 2 abs.
c b
Time (h)
Control 2 abs.
a
***
*** ***
***
*
*
***
***
+O +O
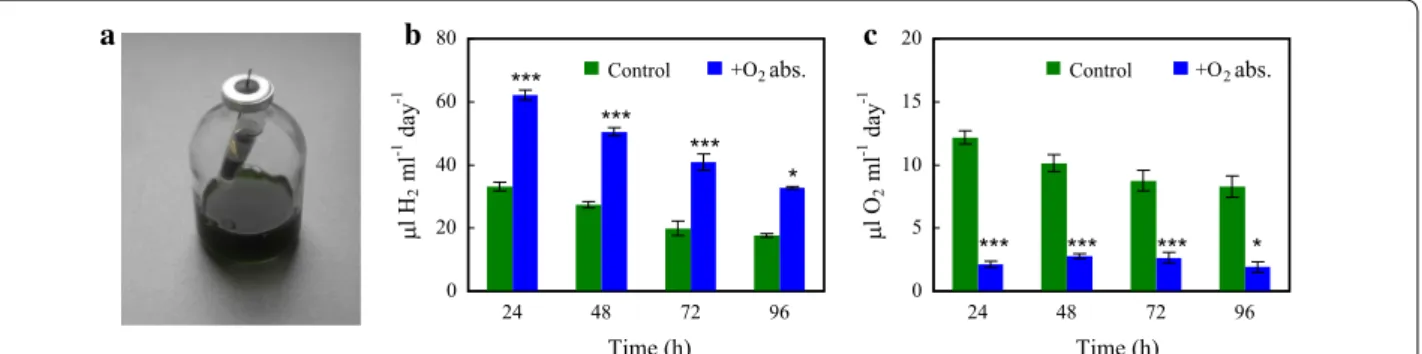
Fig. 4 The effect of an iron‑salt‑based O2 absorbent (O20TM) on the H2 production of Chlamydomonas in acetate‑free HS medium induced by dark anaerobic incubation. a Photograph of the H2‑producing Chlamydomonas cultures in serum bottles with the iron‑salt‑based O2 absorbent introduced into the headspace. b, c The effects of the iron‑salt‑based O2 absorbent on the daily H2 production and daily O2 accumulation in Chlamydomonas cultures illuminated continuously at 320 µmol photons/m2/s. The cultures were flushed with N2 for 10 min every 24 h after determining the gas concentrations in the headspaces of the sealed bottles. Mean values (± SEM) are each based on 11–15 biological replicates.
Statistical significance levels are presented relative to the Chlamydomonas culture subjected to dark anaerobic incubation in HS medium as
*p < 0.05; ***p < 0.001
hydrogenase activity decreased to approx. 6 and 9% of the original activity in the absence and presence of the O2 absorbent, respectively (Fig. 5c), highlighting the extreme O2 sensitivity of hydrogenases [63]. Following this rapid decline, there was a slower phase of inactivation, and
by the end of the experiment 2% of the original in vitro activity remained in the absence of the O2 absorbent, while 5% remained in its presence (Fig. 5c).
Photosynthetic activity during H2 production
The maintainability of our system was tested by char- acterization of the photosynthetic apparatus during the 96-h H2-producing period. The chl (a + b) content decreased only by approx. 10% during the 96-h experi- ment (Fig. 6a). The FV/FM value, an indicator of PSII effi- ciency, slowly decreased during the 96-h H2 producing period, but remained relatively high (above 0.4) both in the presence and absence of the O2 absorbent (Fig. 6b).
The amount of PsbA (reaction center protein of PSII), PetB (a subunit of the cytb6/f complex) and PsaA (reac- tion center protein of PSI) remained largely unaltered during the 96-h H2-producing period, both in pres- ence and absence of the O2 absorbent, as determined by western blot analysis (Fig. 6c); the amount of the large Rubisco subunit, RbcL, showed a moderate decrease (Fig. 6c). These findings are in strong contrast to the sul- phur deprivation protocol in TAP medium, where the amount of Rubisco and PsbA strongly diminish within 48 h. By the end of a 4–6-day period of sulphur depri- vation most photosynthetic complexes are degraded and the cells eventually die [15, 17, 41, 71].
Since our cells remained photosynthetically active, we attempted recovering and reusing the cultures after the H2-producing period. Cultures were diluted with HS medium to 6 µg chl (a + b), transferred into a multi-well cultivation instrument and sparged with air containing 1% CO2 for 72 h. The algal cultures showed discernible growth in the HS medium and the cell density doubled within approx. 24 h, as estimated based on optical den- sity (Fig. 7a). When these cells were subjected to a sec- ond dark anaerobic incubation period in HS media (as described above), H2 production occurred with yields similar to the first cycle (cf. Figs. 4b, c, 7b, c).
Discussion
The potential energy conversion efficiency from sunlight to H2 by green algae is in the range of 10–13% [14, 72].
However, in nature H2 production lasts only for a few minutes due to the inhibition of hydrogenases by the evolved O2 [20, 27]. Early studies on algal H2 produc- tion based on dark anaerobic incubation were typically unable to sustain the initial high rates of H2 production for more than a few hrs, if not resorting to continuous flushing with helium [31, 65, 68]. Later, sulphur depriva- tion became the method of choice to induce long-term H2 production [15, 17, 42]. However, sulphur deprivation has several drawbacks which impede its industrial appli- cation [20, 72]: the procedure requires several washing Fig. 5 The effects of an iron‑salt‑based O2 absorbent on the
hydrogenase activity of Chlamydomonas in acetate‑free HS medium induced by dark anaerobic incubation. a HYDA1 expression level, expressed relative to the aerobically cultured controls in the presence and absence of the O2 absorbent. b The amount of HydA, determined by western blot analysis in the presence and absence of the O2 absorbent; samples of 2 µg chl (a + b) were loaded and the second to fourth lanes (25, 50, 100% of 0 h control) are for approximate quantitation of HydA. The 0 h control samples were collected directly after the 4‑h dark anaerobic incubation. c The in vitro hydrogenase activity in the presence and absence of the O2 absorbent, expressed as a percentage of the activity of cells subjected to dark anaerobic incubation for 3 h, which had an in vitro hydrogenase activity of approx. 500 µmol H2/mg chl (a + b)/h. Mean values (± SEM) are each based on 3 or 4 biological replicates
steps; H2 production starts with a delay of about 2 days;
it is largely dependent on acetate (H2 production can be induced under photoautotropic conditions as well, but with a much lower efficiency [18–20]); it necessitates
the inactivation of PSII; and it results in the degradation of the photosynthetic machinery. Recovery following the terminal phase of H2 production by re-additions of 0
0.2 0.4 0.6 0.8
FV / FM
Control +O2 abs.
PsbA PetB PsaA
aerobic 0 h Control 25% 0 h Control 50% 0 h Control 100% 3 h Control 24 h Control 48 h Control 72 h Control 96 h Control 0 h +O2 abs. 3 h +O2 abs. 24 h +O2 abs. 48 h +O2 abs. 72 h +O2 abs. 96 h +O2 abs.
Time (h) b
c
0 15 30 45 60
0 24 48 72 96
0 24 48 72 96
Time (h)
μg chl (a + b)/ml culture
a
Control +O2 abs.
RbcL
Fig. 6 Characterisation of the photosynthetic apparatus of Chlamydomonas during H2 production in acetate‑free HS medium induced by dark anaerobic incubation in the absence and presence of an iron‑salt‑based O2 absorbent. a Changes in chl (a + b) content during the H2‑producing period. b The FV/FM fluorescence parameter determined based on OJIP transients. c Western blot analysis for the semi‑quantitative determination of PsbA, PetB, PsaA and RbcL contents; samples of 2 µg chl (a + b) were loaded and the second to fourth lanes (25, 50, 100% of 0 h control) are for approximate quantitation of the proteins. The 0 h control samples were collected directly after the 4‑h dark anaerobic incubation. Mean values (± SEM) are each based on 3–6 biological replicates
0 0.2 0.4 0.6
0 24 48 72
0 20 40 60 80
24 48 72 96
0 5 10 15 20
24 48 72 96
Time (h) Time (h) µl H2 ml-1 day-1 µl O2 ml-1 day-1
a
OD (720 nm)
Time (h)
c b
Control +O2abs.
Control +O2abs. Control +O2 abs.
***
** *** ***
***
***
*** ***
Fig. 7 Growth of Chlamydomonas cultures following the H2 production phase and a second round of H2 production induced by dark anaerobic incubation in HS medium. a Culture growth in HS medium bubbled with sterile air containing 1% CO2, as determined by measuring optical density at 720 nm, following the first round of H2 production. During the growth phase, no O2 absorbent was present, only during the preceding H2 production phase. b, c H2 production and O2 accumulation in cultures subjected to a second round of dark anaerobic incubation in the presence and absence of an iron‑salt‑based O2 absorbent. The cultures were flushed every 24 h with N2 after determining the gas concentrations in the headspaces of the sealed bottles. Mean values (± SEM) are each based on 4 biological replicates. Statistical significance levels are presented relative to the Chlamydomonas culture subjected to dark anaerobic incubation in HS medium without O2 absorbent as ***p < 0.001
sulphur was incomplete and could be performed only a few times [73].
The future of this biotechnology relies on the develop- ment of a novel approach at least as efficient as the sul- phur deprivation procedure, and which could solve most of the present issues limiting its applicability. Here we report on the establishment of a photoautotrophic and sustainable H2 production system in C. reinhardtii, and demonstrate the applicability of algal cells as whole-cell catalysts for H2 production. This new protocol shares the early approach by Gaffron and Rubin [31] to induce hydrogenase activity by dark anaerobic treatment and keep the CBB cycle inactive by substrate limitation. As an important addition, the protocol applies a simple O2
absorbent that preserve hydrogenase activity for several days (Fig. 4). This protocol has fundamental advantages relative to the earlier methods, namely that (i) follow- ing a few hours of anaerobic dark incubation, H2 pro- duction starts promptly upon illumination (Fig. 1b); (ii) as opposed to sulphur deprivation, it does not require media exchange (Fig. 7); (iii) it does not depend on starch degradation and does not require acetate, thus it is pho- toautotrophic; (iv) because no organic carbon source is required, the risk of bacterial contamination is low; (v) the cultures remain photosynthetically active during the H2 production phase (Fig. 6) and they can be easily recov- ered afterwards (Fig. 7); (vi) it is based on linear electron transport and the electrons originate mostly from the water-splitting activity of PSII, as demonstrated by a DCMU-treatment (Fig. 2), and has relatively high light- to-H2 energy conversion efficiencies (Table 1); (vii) dur- ing the growth phase, CO2, an industrial by-product, can be utilized; and, (viii) it can make use of relatively high light intensities (here, approx. 320 µmol photons/m2/s).
The maximum H2 production yield achieved using this protocol was approx. 200 µl H2/ml culture in 96 h, which is almost four times higher than the yield of sulphur- deprived cultures at equal chl content and illumination conditions (compare Figs. 1d, 4b), and it is in the same range as observed earlier for sulphur deprivation experi- ments using PBRs with even illumination [42], but hav- ing the drawbacks listed above. We expect the yield of H2
production achievable upon anaerobic induction in mini- mal media to be further improved using advanced PBR designs, including optimized gas-to-liquid ratio, illumi- nation and mixing conditions and efficient removal of the produced gases. There is also a high potential in applying this protocol to various photosynthetic mutants possess- ing, e.g. truncated light-harvesting antennae [74], or a high PsbA protein content [75]. Cyclic electron transport competes for the electrons with HydA (reviewed by [9]), thus its downregulation may entail a further increase in H2 production under our conditions as well.
Keeping the CBB cycle inactive was achieved by sub- strate limitation; it has been shown earlier that the CBB cycle represents a competing pathway for H2 production (e.g. [31, 47, 49, 68]) and that redirecting the electrons towards HydA from FNR may enhance the rate of H2
production [76, 77].
The present findings show that by imposing substrate limitation on the CBB cycle, the electrons are largely transferred to HydA, with the lack of carbon sources facilitating the establishment of hypoxia. The effects of CO2 and FCCP additions (Fig. 2) and the relatively reduced PQ-pool (Additional file 4: Fig. S3) indicate that the mechanism occurs by “photosynthetic control” [51, 54, 78]: since the hydrogenases are less effective at accept- ing electrons than the CBB cycle, the lumen is acidified and the photosynthetic electron transport is decelerated at the cytb6f complex. This results in a reduced PQ-pool, which entails a high charge recombination rate in PSII, resulting in diminished O2 evolution (Fig. 2i, j).
Another key factor to reach a sustained H2 produc- tion is to protect the hydrogenases from O2, which may also shift the balance between O2 and H2 production, established by the above-mentioned “photosynthetic control”. We applied an iron-salt-based O2 absorbent, which decreased the O2 concentration in the headspace below 0.1%. This very low concentration of O2 was still inhibitory for hydrogenases (Fig. 5), thus it is desir- able to test even more advanced materials in the future, as for instance crystalline salts of cationic multimetal- lic cobalt complexes [79]. By further decreasing the O2
level, we expect that hydrogenase activity would be better preserved and act as a more effective electron sink; as a result, lumen acidification and “photosynthetic control”
will be attenuated, and the yield of H2 production further increased. Engineering hydrogenases to tolerate a few percent of O2 [14] could also be a successful strategy to further increase the efficiency of H2 production.
Experimental procedures
Algal growth conditions and H2 production
Chlamydomonas reinhardtii CC124 strain was grown initially at 22 °C in 250 ml Erlenmeyer flasks containing 50 ml Tris–acetate–phosphate (TAP) medium shaken at 120 rpm in an algal growth chamber under continuous illumination of 80–90 µmol photons/m2/s PAR (meas- ured by a LI-250A light meter equipped with a quantum sensor), provided by white fluorescent tubes.
After 72 h of cultivation, the cells were transferred to high-salt (HS) medium, HS supplemented with acetate (HSA), Tris–phosphate (TP) or Tris–acetate–phosphate (TAP) media (http://www.chlam ycoll ectio n.org/metho ds/media -recip es/) and the chl content was set at 50 µg chl (a + b)/ml [80], corresponding to approx. 15 million
cells/ml as determined by a Millipore Scepter cell counter (described in [81]). In one experiment, 15 and 30 µg chl (a + b)/ml was also set. For H2 production, 30 ml culture was placed in a 120-ml serum bottle and sealed off with rubber septa under sterile conditions. For dark anaerobic incubation, the gas phase of the bottle was flushed with N2 gas for 10 min and kept in the dark for 4 h, during which the vials were flushed twice more with N2. To pro- duce sulphur-deprived cultures, the cells were washed five times with sulphur-free TAP medium (centrifugation at 1000g, at 24 °C for 5 min, see also [41]) and the chl con- tent was set at 50 µg chl (a + b)/ml. Following these steps, the cultures were placed under T8 cool white fluorescent light tubes (Sylvania luxline plus), providing approxi- mately 52 W/m2 at the level of the cultures as determined by a Spectra-Physics 404 Power meter; this light intensity corresponded to approx. 320 µmol photons/m2/s PAR as measured by a LI-250A light meter equipped with a quantum sensor. The cultures were illuminated continu- ously and kept at 26 °C for 96 h. For a general scheme of the experiments, see Additional file 1: Fig. S1.
In the regeneration experiment following H2 produc- tion, a Multi-Cultivator MC 1000-OD instrument (Pho- ton Systems Instruments, Brno, Czech Republic) was used. At the start of cultivation, the chl content was set at 6 µg chl (a + b)/ml in HS medium. The cells were grown in HS medium at 23 °C, 80 µmol photons/m2/s in con- tinuous light provided by white LEDs for 72 h and the cultures were bubbled with sterile air containing 1% CO2. Following this, the cultures were subjected to a second round of dark anaerobic incubation in HS medium, as described above.
Chemical treatments
In separate experiments, 20 µM 3-(3′,4′-dichlorophenyl)- 1,1-dimethylurea (DCMU) dissolved in dimethyl sulfox- ide (DMSO, 100 mM stock solution), 1 mM potassium cyanide (KCN) and 1 mM salicylhydroxamic acid (SHAM), 2% v/v CO2, 10 mM glycolaldehyde (GA) dis- solved in water (1.5 M stock solution) and 2 µM car- bonylcyanide p-triflouromethoxyphenylhydrazone (FCCP) dissolved in HS medium (20 mM stock solution) were added to the cultures 3 h after the onset of light and start of H2 production. To eliminate the produced O2, 2 mM glucose (Glc, 1 M stock solution), 0.2 mg/ml glucose oxidase (GO, 30 mg/ml stock solution) [82] and 1 mM ascorbate (Asc, 1 M stock solution) were added to the cultures before the start of dark anaerobic incubation.
An iron-salt-based, non-cytotoxic O2 absorbent (O20TM; http://www.o2zer o.com, 20 cc) was used to eliminate O2 from the headspace of the serum bottles during the 96-h H2 production phase. To this end, 1.3 g of O2 absorbing material was placed into a 2 ml-vial, which
was left open and introduced into the headspace of the serum bottles; the algal culture did not get into direct contact with the O2 absorbent (Fig. 4a).
Determination of net H2 and O2 production by gas chromatography
The net amounts of H2 and O2 produced by the cells were determined by taking 250 µl aliquot from the gas phase of the cultures with a gas tight microsyringe. These samples were injected manually into an Agilent 6890 N gas chro- matograph (GC) equipped with a HP-PLOT Molesieve 5 Å column (30 m × 0.53 mm × 0.25 µm) and a TCD detector. The oven temperature was 30 °C. The carrier gas was argon, and a linear velocity of 115 cm/s was used.
The bottles were flushed with N2 gas every 24 h following the determination of gas production.
In vitro hydrogenase activity assay
In vitro hydrogenase activity was measured after the dark anaerobic incubation and during the course of H2
production in the light, as described in [24]. The assay was carried out in 13.5-ml serum vials at 37 °C and the reaction mixture consisted of 1 ml of 100 mM potas- sium phosphate buffer, pH 6.8, 80 µl of deionized water, 200 µl of 10% Triton X-100, 20 µl of 1 M methylviologen, 200 µl of anaerobic 1 M sodium dithionite and 200 µl of algal culture. The H2 concentration in the headspace was measured by GC every 15 min and fitted with linear regression. Results are the mean value of tests performed in at least four replicates. Following a 4-h dark anaero- bic incubation the hydrogenase activity was approx.
500 µmol H2/mg chl (a + b)/h, in agreement with [24].
The data are presented as percentages of this original (maximum) activity.
RNA isolation and qRT‑PCR analysis to assess HYDA1 transcript level
For RNA isolation, 1 ml culture, containing approxi- mately 50 µg chl (a + b), was collected and the Direct- Zol RNA kit was used, following the recommendations of the manufacturer (ZymoResearch). To remove con- taminating DNA from the samples, the isolated RNA was treated with DNaseI (ZymoResearch). RNA integrity was checked on a 1% (w/v) MOPS gel. Reverse transcrip- tion was primed with oligo dT using 1 µg of total RNA and SuperScript III reverse transcriptase (Life Technolo- gies). To confirm the absence of DNA contaminations, an aliquot of the RNA sample was used without reverse transcriptase.
Real-time qPCR analysis was performed using an Applied Biosystems Prism 7900HT Fast Real Time PCR System using HOT FIREPol® EvaGreen® qPCR Mix Plus (ROX) (Solis BioDyne). Primers were designed using the