Static JavaScript Call Graphs: a Comparative Study
Gábor Antal∗, Péter Heged˝us†, Zoltán Tóth∗, Rudolf Ferenc∗, and Tibor Gyimóthy∗†
∗Department of Software Engineering, University of Szeged, Hungary E-mail:{antal | zizo | ferenc}@inf.u-szeged.hu
†MTA-SZTE Research Group on Artificial Intelligence, Szeged, Hungary E-mail: {hpeter | gyimothy}@inf.u-szeged.hu
Abstract—The popularity and wide adoption of JavaScript both at the client and server side makes its code analysis more important than ever before. Most of the algorithms for vulnerability analysis, coding issue detection, or type inference rely on the call graph representation of the underlying program.
Despite some obvious advantages of dynamic analysis, static algorithms should also be considered for call graph construction as they do not require extensive test beds for programs and their costly execution and tracing.
In this paper, we systematically compare five widely adopted static algorithms – implemented by the npm call graph, IBM WALA, Google Closure Compiler, Approximate Call Graph, and Type Analyzer for JavaScript tools – for building JavaScript call graphs on 26 WebKit SunSpider benchmark programs and 6 real-world Node.js modules. We provide a performance analysis as well as a quantitative and qualitative evaluation of the results.
We found that there was a relatively large intersection of the found call edges among the algorithms, which proved to be 100%
precise. However, most of the tools found edges that were missed by all others. ACG had the highest precision followed immediately by TAJS, but ACG found significantly more call edges. As for the combination of tools, ACG and TAJS together covered 99%
of the found true edges by all algorithms, while maintaining a precision as high as 98%. Only two of the tools were able to analyze up-to-date multi-file Node.js modules due to incomplete language features support. They agreed on almost 60% of the call edges, but each of them found valid edges that the other missed.
Keywords-JavaScript, call graph, static code analysis, compar- ative study.
I. INTRODUCTION
According to GitHub statistics [1] JavaScript is one of the most rising languages in years, and it seems that it will continue to dominate in 2018. It had the most pull requests in 2017 and 2016 (in GitHub projects). Each year, the TIOBE Index selects the fastest growing programming language and distinguishes it with the “Language of the Year” award. In 2014, JavaScript was the winner of this award.
Due to its increasing popularity, lots of projects use JavaScript as their core programming language for both server and client side modules. Therefore, static code analysis of JavaScript programs became a very important topic as well.
Many of the code analysis tools rely on the call graph representation of the program. A call graph contains nodes that represent functions of the program and edges between nodes if there exists at least one function call between the corresponding functions. With the help of this program repre- sentation various quality and security issues can be detected
in JavaScript programs, for example, it can be used to detect functions that are never called or as a visual representation which makes understanding the code easier. We can use call graphs to examine whether the correct number of arguments is passed to function calls or as a basis for further analysis, for example, a full interprocedural control flow graph (ICFG) can be built upon the call graph. With the help of the control flow graphs, various type analysis algorithms can be performed [2]–
[5]. What is more, this program representation is useful in other areas of research as well, for example, in mutation testing [6], automated refactoring [7], or defect prediction [8].
Being such a fundamental data structure, the precision of call graphs determines the precision of the code analysis algorithms that rely on them. Creating precise call graphs for JavaScript that is an inherently dynamic, type-free and asynchronous language is quite a big challenge. Static ap- proaches have the obvious disadvantage of missing dynamic call edges coming from the non-trivial usages of eval(), bind(), or apply() (i.e. reflection). Moreover, they might be too conservative, meaning that they can recognize statically valid edges, which are never realized for any inputs in practice.
However, they are fast and efficient compared to dynamic analysis techniques and do not require any testbed for the program under analysis.
Therefore, the state-of-the-art static call graph construction algorithms for JavaScript should not be neglected and we need deeper understanding about their performance, capabilities, and limitations. In this paper we present and compare some well-known and widely used static analysis based call graph building approaches. We compare five different tools – npm call graph, IBM WALA, Google Closure Compiler, ACG (Approximate Call Graph), and TAJS (Type Analyzer for JavaScript) – quantitatively, to find out how many different calls are detected by the individual tools. We also compare the results qualitatively, meaning that we match and validate the found call edges and analyze the differences. Lastly, we report runtime and memory usage data to be able to assess the usability of the tools on real-world programs.
We found that there are variances in the number, precision and type of call edges that individual tools report. However, there were considerably large intersections of the reported edges. Based on a manual evaluation of 348 call edges, we found that ACG had the highest precision, above 99% of the found edges were true calls. At the same time, ACG had the highest recall on the union of all true edges found by the 2018 IEEE 18th International Working Conference on Source Code Analysis and Manipulation
five tools, it found more than 90% of the edges. Nonetheless, three other tools (WALA, Closure, npm call graph) found true positive edges that were missed by all the other tools. TAJS did not find any unique edges, however it achieved a precision of 98% (i.e. comparable to ACG). We also examined the tools in combination and saw that ACG, Closure, and TAJS together found all the true edges, but they also introduced a lot of false ones, their combined precision was only slightly above 83%.
In terms of running time performances, results heavily depend on the size and complexity of the inputs, but Closure and TAJS excel in this respect. From the perspective of mem- ory consumption, for realistic input sizes ACG and Closure overtopped all the other tools. For very large inputs (i.e. in the range of a million lines of code), only Closure Compiler, TAJS and ACG were able to perform practically efficient code analysis.
To summarize, the main contributions of our paper are:
• The evaluation of capabilities and performances of five widely adopted static JavaScript call graph extraction tools.
• The quantitative and qualitative comparison of the tool results on 26 benchmark programs and 6 real-world Node.js modules.
• A manually validated dataset of call edges found by these tools on the 26 benchmark programs.
The rest of the paper is organized as follows. In Sec- tion II, we list the related literature and compare our work to them. Section III describes the tool selection and comparison methodology we applied. In Section IV, we present the results of our quantitative, qualitative, and performance analysis of the tools. We list the possible threats of the analysis in Section V and conclude the paper in Section VI.
II. RELATEDWORK
Using call graphs for program analysis is a well-established and mature technique. The first papers dealing with call graphs date back to the 1970’s [9], [10]. The literature is full with different studies built upon the use of call graphs. Clustering call graphs can have advantages in malware classification [11], they can help localizing software faults [12], not to mention the usefulness of call graphs in debugging [13].
Call graphs can be divided into two subgroups based on the used method to construct them. These two groups are dynamic [14] and static call graphs [15]. Dynamic call graphs are obtained by running the program and collecting runtime information about the interprocedural flow [16]. Techniques such as instrumenting the source code can be used for dynamic call graph creation [17]. In contrast, in case of static call graphs there is no need to run the program, it is produced as a result of static analysis of a program. Different analysis techniques are often combined to obtain a hybrid solution which guarantees a more precise call graph, thus a more precise analysis [18].
With the spread of scripting languages such as Python and JavaScript the need for analyzing programs written in these languages also increased [3]. However, constructing precise static call graphs for dynamic scripting languages is a very
npm callgraph WALA ACG.js Closure compiler
Input file
DOT format DOT-like format DOT-like format
Converter (stjscg_convert2json.py)
Graph comparator (stjscg_compare_json.py) Unified JSON
format
Unified JSON format
Compared JSON Unified JSON
format
Unified JSON format TAJS
DOT format
Unified JSON format
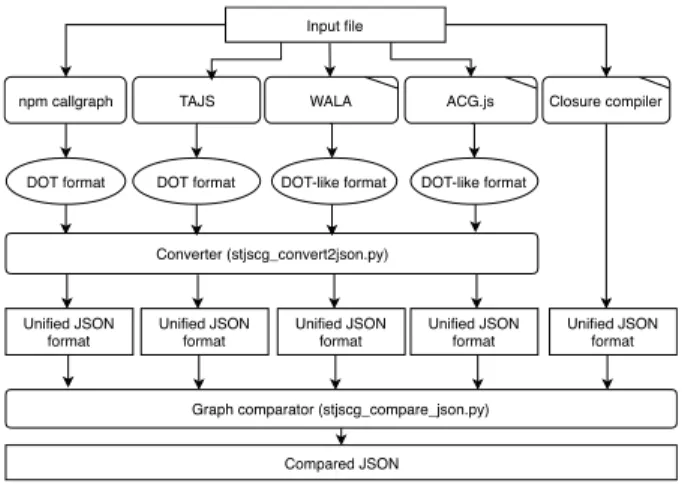
Figure 1. Methodology overview
hard task which is not fully solved yet. The eval(), apply() and bind() constructions of the language make it especially hard to analyze the code statically. However, there are several approaches to construct such static call graphs for JavaScript with varying success [3], [19], [20]. Constructed call graphs are often limited, and none of the studies deal fully with EcmaScript 6 since the standard was released in 2015.
Feldthaus et al. presented an approximation method to construct a call graph [3] by which a scalable JavaScript IDE support could be guaranteed. Madsen et al. focused on the problems induced by libraries used in the project [4]. They used pointer analysis and a novel use analysis to enhance scalability and precision. In our study, we only deal with static call graphs for JavaScript and do not propose a new algorithm, but rather evaluate and compare existing approaches.
In his thesis [21], Dijkstra evaluates various static JavaScript call graph building algorithms. This work is very similar to our comparative study, however, it was published in 2014 and a lot has happened since then in this research area. Moreover, while Dijkstra focused on the evaluation of the various conceptual algorithms implemented by himself in Rascal, our focus is on comparing mature and state-of-the-art tool implementations on these algorithms ready to be applied in practice.
There are also works with a goal to create a framework for comparing call graph construction algorithms [22], [23].
However, these are done for algorithms written in Java and C.
Call graphs are often used for preliminary analysis to deter- mine whether an optimization can be done on the code or not.
Unfortunately, as they are specific to Java and C languages, we could not use these frameworks as is for comparing JavaScript call graphs.
III. METHODOLOGY
A. Overview of the study process
Figure 1 displays the high-level overview of the applied external and self-developed software components we used in our comparative study. We run each of the selected tools (Section III-B) on the test input files (Section III-C). As can be seen, we needed to patch some of the tools (marked with \) for various reasons (see Section III-B), but mainly to extract and
dump the call graphs built in the memory of the programs (all the modification patches are available in the online appendix package1). Next, we collected the produced outputs of the tools and ran our data conversion scripts to transform each call graph to a unified, JSON based format we defined (Section III-D).
The only exception was Closure, where we implemented the call graph extraction to the JSON format right into the patch extracting the inner-built call graph, because there was no public option for outputting it, thus it was easier to dump the data right into the unified JSON format. In all other cases we built a custom data parser script that was able to read the output of the tools and produce an equivalent of it in our JSON format. From the individual JSON outputs of the tool results, we created a merged JSON with the same structure using our graph comparison tool (Section III-E). This merged JSON contains all the nodes and edges found by either of the tools, with an added attribute listing all the tool ids that found that particular node or edge. We ran our analysis and calculated all the statistics on these individual and merged JSON files (all the produced JSON outputs are part of the online appendix package).
B. Call graph extraction tools
In this section, we present the tools we took into account in our comparative study. We examined tools that: i) are able to create a function call graph from a JavaScript program, ii) are free and open-source, and iii) are adopted in practice.
It is important to note that in this study we work with call graphs, where:
• Each node represents a function in the program (identified by the file name, line and column number of the function declaration),
• An edge between two nodes is directed and represents a statically possible call from one function to another (i.e.
functionf() may call functiong()),
• There might be only zero or one edge between two nodes, so we track only if a call is possible from one function to another, but omit its multiplicity (i.e. we do not count at how many call sites calls may happen). This is because not all of the tools are able to find multiple calls and we wanted to stick to the most basic definition of the static call graph anyway.
Based on these criteria, we selected the following five tools for our comparative study (see Table I for an overview).
1) WALA: WALA [20] is a complete framework for both static and dynamic program analysis for Java. It also has a JavaScript front-end, which is built on Mozilla’s Rhino [24]
parser. In this study, we used only one of its main features, which is static analysis, call graph construction in particular.
In order to have the output that suits our needs, we had to create a driver which serializes the built call graph.
For this, we used an already existing version of the call graph serializer found in the official WALA repository (Call- Graph2JSON.java), As a first step, we converted the ac- tual call graph to a simple DOT format then we used our
1http://www.inf.u-szeged.hu/~ferenc/papers/StaticJSCallGraphs/
converter script to transform this into the final JSON file.
WALA produced multiple edges between two functions if there were multiple call sites within the caller function. Since our definition of call graph allows at most one edge between two functions in one direction, we modified the serializer to filter the edges and merge them if necessary. We had to handle the special case when the call site was in the global scope as in this case there was no explicit caller method. In such cases we applied the common practice followed by other tools as well and introduced an artificial “toplevel” node as the source of these edges.
WALA itself is written entirely in Java, its main repository is under active development, mostly by the IBM T.J. Watson Research Center. WALA was used in over 60 publications [25]
since 2003.
2) Closure Compiler: The Closure Compiler [19] is a real JavaScript compiler, which works as other compilers. But in the case of Closure Compiler it compiles JavaScript to a better JavaScript: it parses and analyzes JavaScript programs, removes dead code, rewrites and compresses the code. It also checks common JavaScript mistakes.
It builds a call graph data structure for internal use only by other algorithms. Therefore, we had to modify the available source code and provide a call graph JSON dump function.
Closure Compiler contains the inclusion of the artificial root node by default to represent calls realized from the global scope. The JSON writer filters any duplicate edges (Closure keeps track of various call sites) to provide an appropriate JSON output used for comparison (see Section III-D).
The Closure Compiler itself is written entirely in Java and is actively developed by Google.
3) ACG: ACG (Approximate Call Graph) implements a field-based call graph construction algorithm [3] for JavaScript. The call graph constructor can be run in two basic modes, pessimistic and optimistic, which differ in how inter- procedural flows are handled. In our study, we used the default ONESHOTpessimistic strategy for call graph construction.
For ACG, we had to implement the introduction of an artificial root edge (i.e. “toplevel”) and filtering of multiple edges as ACG also tracks and reports edges connected to individual call sites. Moreover, ACG reported only the line numbers of functions in its output, which we had to extend with the column information. All these modifications are available in one single patch.
As there are several forks of the original repository available currently, we had to check all of them and select the one which is the most mature among these forks. The selected one was created by the CWI group from Amsterdam.
4) The npm callgraph module: Npm callgraph is a small npm module to create call graphs from JavaScript code de- veloped by Gunar C. Gessner. It uses UglifyJS2 [26] to parse JavaScript code. Despite its small size and few commits, quite a lot of people use it, it has more than 1300 downloads.
5) TAJS: Type Analyzer for JavaScript [27] is a dataflow analysis tool for JavaScript that infers type information and call graphs. It is copyrighted to Aarhus University.
Table I
COMPARISON OF THE USED TOOLS(AS OF16THJULY, 2018)
Tool name Repository Lang. Size Commits Last commit Contri- Issues ECMAScript
(SLOC) butors (open/closed) compatibility
WALA https://github.com/wala/WALA Java 232,594 5,845 06/11/2018 25 151 (74/77) ES5
Closure compiler https://github.com/google/closure-compiler Java 398,959 12,525 06/16/2018 373 2163 (796/1367) ES6 (partial)
ACG https://github.com/cwi-swat/javascript-call-graph JS 120,531 193 10/28/2014 3 7 (1/6) ES5
npm callgraph https://github.com/gunar/callgraph JS 207 30 03/14/2017 2 16 (6/10) ES6 (partial)
TAJS https://github.com/cs-au-dk/TAJS Java 53,228 16 01/04/2018 1 10 (6/4) ES5 (partial)
The proposed algorithm is implemented as a Java system that is actively maintained since the publication of the original concept. However, we suspect that this is only an external mir- ror of an internal repository that is synchronized periodically.
It was not necessary to modify the source code of TAJS as it provides a command line option for dumping call graphs into a DOT format that we were able to parse and convert into our unified JSON format.
Other considered tools.There are of course other candidate tools which could have been involved in this study. We found lots of commercial and/or closed-source programs, like SAP HANA. However, we focused on open-source programs, which are easy to access and even modify or customize to fit our needs. They are also widely adopted by research and industry.
In our evaluation study we only dealt with tools directly supporting call graph building either internally or as a public feature. Thus, we were forced to left out some great JavaScript static analysis tools that do not support call graph extraction di- rectly. One such tool was the open-source Flow [28] developed by Facebook, a very popular static code analysis tool for type checking JavaScript. Unfortunately, Flow does not provide a public API for obtaining the built call graph or a control flow graph. As such, we would have been required to implement our own algorithms above the internal control flow data structure, which would introduce a threat to the validity of this study.
Our primary goal in this work was to empirically compare existing call graph extraction algorithms, not to upgrade all tools to achieve call graph extraction.
Other relevant tools we examined were JSAI (JavaScript Abstract Interpreter) [29] and SAFE (Scalable Analysis Framework for EcmaScript) [30], both build an intermediate abstract representation from JavaScript to further perform an analysis on. It is true that they calculate control and data flow structures, but they specifically utilize them for type inference.
None of them support the extraction/export of call graphs, hence we were unable to include them in our evaluation study.
The toolcode2flow[31] also looked like a great choice, but since it is abandoned officially without any follow-up forks, we excluded it from our list. We note that the original repository of ACG was also abandoned, however it has several active forks on GitHub.
Another reason we dropped possible tools from comparison was immaturity, which means that the given project had one contributor and there was only a very short development period before the project was left abandoned. These tools also lacked documentation, thus their usability was poor.
We did not take into account JavaScript Explorer Callgraph [32] due to this reason. Furthermore, we also
left outcallgraphjs[33] since this project contains only supporting material for ACG.
C. Comparison subjects
To perform a deep comparison of the tools, we identified three test input groups.
1) Real-world, single file examples: The first group consists of real-world, single file, “bare” JavaScript examples. For this, we chose the SunSpider benchmark of the WebKit browser engine [34], which is extensively used in other works as well.
The benchmark programs are created to test the JavaScript engine built into WebKit. Therefore, these programs contain varying complexity code with many different types of func- tions and calls, but all in one single JavaScript source file.
These properties make them excellent choice for our real- world, single-file test subjects. Moreover, all the programs are of manageable size, thus we could easily check and analyze the calls manually.
2) Real-world, multi-file Node.js examples: To test the handling of modern, EcmaScript 6 and Node.js features (like module exports or external dependencies, i.e. the require keyword) and inter-file dependencies, we collected six popular Node.js modules from GitHub. Our selection criteria included the following: the module should contain multiple js source files, it should have an extensive test suite with at least 75%
code coverage and be used by at least 100 other Node.js modules. The requirements for test coverage comes from our mid-term research goal. We would like to repeat the presented comparative study extended with dynamic call graph extraction algorithms that typically require an existing test suite for programs under analysis. The details of the chosen Node.js modules are summarized in Table II.
Table II
SELECTEDNODE.JS MODULES FOR TEST
Program Repository Size (SLOC)
debug https://github.com/visionmedia/debug 442 doctrine https://github.com/eslint/doctrine 5,109 express https://github.com/expressjs/express 11,673 jshint https://github.com/jshint/jshint 68,411 passport https://github.com/jaredhanson/passport 6,173 request https://github.com/request/request 9,469
3) Generated large examples: In order to stress test the selected tools and measure their performances, we needed some really large programs. However, we were unable to find large enough open-source programs, which would use only those language features that all of the tools recognize.
Therefore, we decided to generate JavaScript programs that conform to the ECMAScript 5 standard as it is the highest standard all the selected tools support.
We defined two categories of such generated inputs. The programs in thesimplecategory contain simple function calls
with some random statements (variable declarations, object creation and object property access, for loops, while loops or return statements). They are pretty straightforward without any complex control flows, but their sizes range from moderate to very large. The programs in thecomplexcategory also contain numerous function calls but extended with functions with parameters, callback functions, function expressions, loops, and simple logging statements. These programs meant to test the performances of tools when parsing complex control flows. The code generation was performed automatically, with custom made Python scripts.
We generated three files in the simple and two in the complex category (the exact properties of these programs are shown in Table III). After the generation, we used the Esprima Syntax Validator2 to validate our files thus they are valid JavaScript programs and can be parsed with any ECMAScript 5 compatible JavaScript front-end.
Table III
PROPERTIES OF THE RANDOM GENERATEDJAVASCRIPT FILES
Type File Code lines Nodes Edges
Simple
s_small.js 68,741 1000 49,286
s_medium.js 382,536 2,600 331,267 s_large.js 1,321,088 5,000 1,224,251
Complex c_medium.js 28,544 400 3,000
c_large.js 413,099 1,000 50,000
D. Output format
The different selected tools produce their outputs in different formats by default. To solve this problem, we had to process their outputs and convert them into a unified format that can be used for further analysis. We chose a simple JSON format that contains the list of nodes and edges of a call graph.
Each node has a unique identifier (id), a label, and source code position information. The position information clearly identifies a function (i.e. node). Each edge connects exactly two of the nodes by their unique ids.
E. Graph comparison
The quantitative analysis of the call graphs focuses on the comparison of the number of nodes and edges. For the qualitative analysis – inspired by the work of Lhoták et. al [22]
–, we created a call graph comparison script written in Python.
The script is available in our online appendix package. The aim of the script is to detect the common edges found by different tools. The script decorates each node and edge JSON entry with a list of tool identifiers that found the particular node or edge. The identification of nodes and edges are done by precise path, line, and column information as JavaScript functions have no names and it would be cumbersome to rely on a unified unique naming scheme anyway.
To ensure the proper comparison, we manually checked the produced path and line information of the evaluated tools.
TAJS reported precise line and column information in its standard DOT output. In cases of Closure Compiler, WALA, and ACG, we implemented or modified the line information extraction. Unfortunately, WALA was able to report only line numbers, but no column information, thus we manually refined the JSON outputs it produced. In case of npm callgraph,
2
the reported line information was not precise (neither line, nor column information), thus we went through all the cases manually and added them to the produced JSON files.
F. Manual evaluation
As part of the qualitative analysis of the results, we evalu- ated all the 348 call edges found by the five tools on the 26 SunSpider benchmark programs. The manual evaluation was performed by two of the authors by going through all the edges in the merged JSON files and looking at the JavaScript sources to identify the validity of those edges. As an output, each edge of the JSON has been extended with a “valid” flag that is either true or false. After both authors evaluated the edges, they compared their validation results and resolved those two cases where they disagreed initially. Upon consensus, the final validated JSON has been created.
As for the Node.js modules, the large number of edges made it impossible to validate all of them. In this case we selected a statistically significant representative random sample of edges (see Section IV-B for the numbers) to achieve a 95% confidence level with a 5% margin of error. One of the authors of the paper manually checked all these selected edges in the Node.js sources.
G. Performance measurement
We ran the tools on an average personal computer with Windows 7. The main hardware characteristics were Intel Core i7-3770 processor (at 3.90 GHz), 16 Gb RAM, and 1 Tb HDD (7200 rpm). We note that besides TAJS (which can measure the time of its analysis phases), neither of the tools can measure their own running time and/or memory usage.
To measure the memory usage of the tools uniformly, we implemented a small tool which queries the operating system’s memory usage at regular intervals and stores the acquired data for each process. In order to acquire running time data, we modified each tool’s source code. For the two Node.js tools (ACG and npm callgraph), we used the process.hrtime()method to calculate running time. We also had to set the maximum heap size to 6 Gb.
For the three Java-based tools (WALA, Closure Compiler, and TAJS), we set the maximum heap size to 11 Gb. For running time measurement, we used timestamps from the System.nanoTime() method.
IV. RESULTS
A. Quantitative analysis
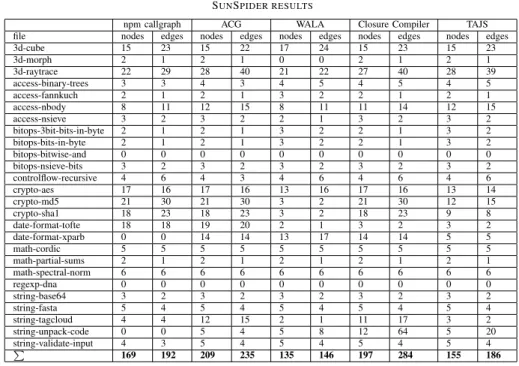
SunSpider benchmark results.To evaluate the basic capa- bilities of the selected tools, we used the SunSpider benchmark for the WebKit browser engine (i.e. the first test program group). This package contains 26 files which we analyzed one at a time with each tool. After the analysis, we collected the different outputs and we converted them to our previously defined JSON format (see Section III-A). We calculated some basic statistics from the gathered data that can be seen in Table IV. The table shows the number of nodes (functions) and edges (possible calls between two functions) found by each tool for every benchmark program. As can be seen, there are programs for which the number of nodes and edges are
Table IV SUNSPIDER RESULTS
npm callgraph ACG WALA Closure Compiler TAJS
file nodes edges nodes edges nodes edges nodes edges nodes edges
3d-cube 15 23 15 22 17 24 15 23 15 23
3d-morph 2 1 2 1 0 0 2 1 2 1
3d-raytrace 22 29 28 40 21 22 27 40 28 39
access-binary-trees 3 3 4 3 4 5 4 5 4 5
access-fannkuch 2 1 2 1 3 2 2 1 2 1
access-nbody 8 11 12 15 8 11 11 14 12 15
access-nsieve 3 2 3 2 2 1 3 2 3 2
bitops-3bit-bits-in-byte 2 1 2 1 3 2 2 1 3 2
bitops-bits-in-byte 2 1 2 1 3 2 2 1 3 2
bitops-bitwise-and 0 0 0 0 0 0 0 0 0 0
bitops-nsieve-bits 3 2 3 2 3 2 3 2 3 2
controlflow-recursive 4 6 4 3 4 6 4 6 4 6
crypto-aes 17 16 17 16 13 16 17 16 13 14
crypto-md5 21 30 21 30 3 2 21 30 12 15
crypto-sha1 18 23 18 23 3 2 18 23 9 8
date-format-tofte 18 18 19 20 2 1 3 2 3 2
date-format-xparb 0 0 14 14 13 17 14 14 5 5
math-cordic 5 5 5 5 5 5 5 5 5 5
math-partial-sums 2 1 2 1 2 1 2 1 2 1
math-spectral-norm 6 6 6 6 6 6 6 6 6 6
regexp-dna 0 0 0 0 0 0 0 0 0 0
string-base64 3 2 3 2 3 2 3 2 3 2
string-fasta 5 4 5 4 5 4 5 4 5 4
string-tagcloud 4 4 12 15 2 1 11 17 3 2
string-unpack-code 0 0 5 4 5 8 12 64 5 20
string-validate-input 4 3 5 4 5 4 5 4 5 4
169 192 209 235 135 146 197 284 155 186
the same for all tools (e.g. bitops-bitwise-and.js, math-partial- sums.js). There are also programs for which the results are very close, but not exactly the same (e.g. bitops-3bit-bits-in- byte.js, string-validate-input.js) and consensus could be made easily. We should note, however, that tools produce similar call graphs typically for small programs with only a few functions, where there is only a small room for disagreement. Finally, there are programs where the numbers show a relatively large variance across the call graph tools (e.g. 3d-raytrace.js, date- format-tofte.js).
Node.js module results.To evaluate the practical capabil- ities of the selected tools, we chose six real-world, popular open-source Node.js modules. Details about the subject pro- grams can be found in Section III-C2.
Unfortunately, npm callgraph and WALA were unable to analyze whole, multi-file projects because they cannot resolve calls among different files (e.g., requiring a module). TAJS supports the require command, nonetheless it was still unable to detect call edges in multi-file Node.js projects. On the other hand, Closure Compiler and ACG were able to recognize these kind of calls. Thus, we used only these two tools to perform the analysis on the selected Node.js modules.
Table V NODE.JS RESULTS
ACG Closure Compiler
file nodes edges nodes edges
debug 19 15 12 8
doctrine 85 175 53 174
express 82 186 118 239
jshint 349 1001 320 1236
passport 41 40 39 49
request 122 223 123 239
698 1640 665 1945
We calculated some basic statistics from the gathered data that is shown in Table V. The table displays the number of nodes (functions) and edges (possible calls between two
functions) found by the tools. As can be seen, the results show resemblance, the correlation between nodes and edges found by the two tools is high. However, not surprisingly, there are no exact matches in the number of nodes and edges for such complex input programs. It is interesting though, that for doctrine the number of edges found by ACG and Closure Compiler is very close (175 and 174, respectively), but there is a large difference in the number of nodes found by the tools.
B. Qualitative analysis
For qualitatively comparing the results, we applied our exact line information based call graph comparison tool described in Section III-E. With this, we could identify which call edges were found by the various tools and compare the amount of common edges by all tools, or the edges found by only a sub-set of the tools.
SunSpider benchmark results.First, we present the qual- itative analysis on the single file SunSpider JavaScript bench- mark programs. All the Venn diagrams are available in an interactive version as well in the online appendix package, where one can query the list of edges belonging to each area.
Figure 2 presents the Venn diagram of the found call edges in the total of 26 benchmark programs by the five tools. The first numbers show the true edges according to our manual evaluation (see Section III-F), while the second numbers are the amount of total edges. The percentages below the two numbers display the ratio of true edges in that area compared to the total number of true edges found by the tools (which is 257 out of 348). This representation highlights the number of edges found by all possible sub-sets of the five tools.
In total, 93 edges were found by all the five subject tools, all of them being true positive calls. However, four of the tools found edges that the others missed. Although WALA, Closure Compiler and npm callgraph (npm-cg) reported a significant
Figure 2. Venn diagram of the true/total number of edges found by the tools
amount of edges that no other tools recognized, most of them turned out to be false positives during their manual evaluation.
a) Edges found by npm-cg only: The manual analysis of the 18 unique edges found only by the npm-cg tool showed that all of these are false positive edges. Every edge represents a call from the global scope of the program to a function.
Even though the reported calls exist, all of the call sites are within another function and not in the global scope.
Listing 1 shows a concrete example3from theaccess-nbody.js benchmark program. The tool reports a call of Sun() (line 1) from the global scope, but it is called within an anonymous function (line 8) from line 10. This call is properly recognized by all the other tools, however.
1 f u n c t i o n Sun ( ){
2 r e t u r n new Body (0.0, 0.0, 0.0, 0.0, 0.0, 0.0, SOLAR_MASS) ;
3 }
4 . . .
5 v a r r e t = 0; 6
7 f o r ( v a r n = 3; n <= 2 4; n ∗= 2 ) { 8 ( f u n c t i o n ( ){
9 v a r b o d i e s = new NBodySystem ( A r r a y (
10 Sun ( ),J u p i t e r ( ),S a t u r n ( ),U r a n u s ( ),N e p t u n e ( )
11 ) ) ;
12 . . .
13 }
14 }
Listing 1. A false call edge found by npm-cg
b) Edge found by ACG only: There is only one edge found by ACG and no one else, which is true positive. It is a call4 to a function added to the built-inDate object via its prototype property indate-format-tofte.js. Listing 2 shows the excerpt of this call.
c) Edges found by WALA only: In case of WALA, all the 19 unique edges are false, but for different reasons.
5 of the 19 edges have a target function of “unknown”, thus WALA was not able to retrieve the target node of the call edge. We checked these instances manually and found that all these unknown nodes are implied byArray()calls. As all the
3toplevel:1:1->access-nbody.js:74:1
4date-format-tofte.js:186:5->date-format-tofte.js:8:29
built-ins and external calls are omitted from the analysis, these edges are clearly false ones.
1 D a t e . p r o t o t y p e . f o r m a t D a t e = f u n c t i o n ( i n p u t,t i m e ) { 2 . . .
3 f u n c t i o n W( ) {
4 . . .
5 v a r prevNY = new D a t e ( " December 3 1 " + (Y ( )−1) + " 0 0 :0 0:0 0" ) ;
6 r e t u r n prevNY . f o r m a t D a t e ( "W" ) ;
7 }
8 . . .
9 }
Listing 2. A true call edge found by ACG
Another group of ten false edges come from the date- format-xparb.js program. This program contains a large switch-case statement that builds up calls to various func- tions as strings. These dynamically created strings are then executed using the eval() command to extend the prototype of Date object with generated formatting functions. These formatting functions are then called from a function named dateFormat. WALA recognizes direct edges fromdateFormat to the functions generated into the body of the formatting functions, which is invalid, as the functions are called from the dynamically created formatting functions that are called bydateFormat.
The last four false edges are due to invalid recursive call edges reported in the string-unpack-code.js program. There are several functions identified by the same name in different scopes, but WALA was unable to differentiate them.
d) Edges found by Closure only: Closure found a couple of recursive edges that no other tool did. For example, List- ing 3 shows an edge5in thestring-tagcloud.jsprogram, where thetoJSONStringfunction is called from its body (line 8).
1 O b j e c t . p r o t o t y p e . t o J S O N S t r i n g = f u n c t i o n (w) { 2 . . .
3 s w i t c h ( t y p e o f v ) { 4 c a s e ’ o b j e c t ’:
5 i f ( v ) {
6 i f ( t y p e o f v . t o J S O N S t r i n g === ’ f u n c t i o n ’ ) { 7 a . p u s h ( k . t o J S O N S t r i n g ( ) + ’:’ +
8 v . t o J S O N S t r i n g (w) ) ;
9 }
Listing 3. A true recursive call edge found by Closure
48 out of the 50 unique edges by Closure is in thestring- unpack-code.jsprogram. All of them are false positive edges.
The reason is that Closure seems to ignore the visibility of identifiers within scopes (similarly to that observed in case of WALA). Listing 4 shows a sketch of the problematic calls.
1 v a r d e c o m p r e s s e d M o c h i K i t = f u n c t i o n ( p,a,c 2 ,k,e,d ){e = f u n c t i o n ( c ){r e t u r n ( c < a ? " ": 3 e ( p a r s e I n t ( c / a ) ) ) + ( ( c = c%a ) >3 5? S t r i n g . 4 fromCharCode ( c+2 9):c . t o S t r i n g (3 6) )}
5 . . .
6 }( . . . ) ;
7 v a r d e c o m p r e s s e d D o j o = f u n c t i o n ( p,a,c 8 ,k,e,d ){e = f u n c t i o n ( c ){r e t u r n ( c < a ? " ": 9 e ( p a r s e I n t ( c / a ) ) ) + ( ( c = c%a ) >3 5? S t r i n g . 10 fromCharCode ( c+2 9):c . t o S t r i n g (3 6) )}
11 . . .
12 }( . . . ) ;
Listing 4. A confusing code part from string-unpack-code.js
5string-tagcloud.js:99:37->string-tagcloud.js:99:37
The inner function redefining parameter e of the outer function (line 2) is called within itself (line 3), which is correctly identified by Closure and TAJS, but no other tools.
However, Closure reports edges from the same location to all the other places where a function e is called (e.g. line 9), which is false, because thateis not the sameeas it is already in another body block referring to another locally created function denoted bye. Thestring-unpack-code.jsdefines four deeply embedded functions with the same parameter names, hence most of the found edges are false.
e) Interesting edges found by TAJS: TAJS did not find any edges that were missed by all the other tools. However, it did find some interesting edges detected only by one other tool. One such call edge is through a complex control flow that was missed by the tools except for TAJS and ACG.
Moreover, TAJS was the only tool besides WALA that de- tected edges coming from higher-order function calls. Listing 5 shows such a call6 inbitops-3bit-bits-in-byte.js.
1 f u n c t i o n f a s t3b i t l o o k u p ( b ) { 2 . . .
3 } 4 . . .
5 f u n c t i o n TimeFunc ( f u n c ) { 6 . . .
7 f o r ( v a r y=0; y<2 5 6; y ++) sum += f u n c ( y ) ; 8 . . .
9 }
10 sum = TimeFunc ( f a s t3b i t l o o k u p ) ;
Listing 5. A true call edge found by WALA and TAJS
As we systematically evaluated all the 348 found call edges, we could also calculate the well-known information retrieval metrics (precision and recall) for each tool and their arbitrary combinations. We would like to note, however, that evaluation and comparison was done for simple call edges; paths along these edges were not taken into consideration. Missing or extra edges might have different impact depending on the number of paths that go through them, thus precision and recall values might be different for the found call chain paths.
Table VI contains the detailed statistics of the tools. The first column (Tool) is the name of the tool or combination of tools. The second column (TP) shows the total number of true positive instances found by the appropriate tool or tool combination. In the third column (All), we display the total number of edges found by the appropriate tool or tool combination. Fourth column (TP∗) shows the total number of true edges as per our manual evaluation (i.e. it is 257 in each row). The fifth (Prec.), sixth (Rec.∗), and seventh (F) columns contain the precision (TP / All), recall (TP∗ / TP) and F-measure values, respectively.
We must note that Rec.∗is not the classical recall measure.
We did not strive to discover all possible call edges during manual validation, rather simply checked whether an edge reported by a tool is true or not. Thus we used the union of all true edges found by the five tools as our golden standard.
This is just a heuristic but it provides a good insight into the actual performances of the tools compared to each other.
From the individual tools, ACG stands out with its almost perfect (99%) precision and quite high recall (91%) values.
6bitops-3bit-bits-in-byte.js:28:1->bitops-3bit-bits-in-byte.js:7:1
Table VI
PRECISION AND RECALL MEASURES FOR TOOLS AND COMBINATIONS
Tool TP All TP∗ Prec. Rec.∗ F
npm-cg 174 192 257 91% 68% 77%
ACG 233 235 257 99% 91% 95%
WALA 127 146 257 87% 49% 63%
Closure 230 284 257 81% 89% 85%
TAJS 182 186 257 98% 71% 82%
npm-cg+ACG 239 259 257 92% 93% 93%
npm-cg+WALA 203 219 257 93% 79% 85%
npm-cg+Closure 247 319 257 77% 96% 86%
npm-cg+TAJS 233 255 257 91% 91% 91%
ACG+WALA 241 262 257 92% 94% 93%
ACG+Closure 255 309 257 83% 99% 90%
ACG+TAJS 254 260 257 98% 99% 98%
WALA+Closure 238 311 257 77% 93% 84%
WALA+TAJS 187 210 257 89% 73% 80%
Closure+TAJS 239 293 257 82% 93% 87%
npm-cg+ACG+WALA 242 281 257 86% 94% 90%
npm-cg+ACG+Closure 255 327 257 78% 99% 87%
npm-cg+ACG+TAJS 255 279 257 91% 99% 95%
npm-cg+WALA+Closure 255 346 257 74% 99% 85%
npm-cg+WALA+TAJS 238 258 257 92% 93% 92%
npm-cg+Closure+TAJS 256 328 257 78% 99% 88%
ACG+WALA+Closure 257 330 257 78% 100% 88%
ACG+WALA+TAJS 254 279 257 91% 99% 95%
ACG+Closure+TAJS 257 311 257 83% 100% 90%
WALA+Closure+TAJS 239 312 257 77% 93% 84%
npm-cg+ACG+WALA+Closure 257 348 257 74% 100% 85%
npm-cg+ACG+WALA+TAJS 255 298 257 86% 99% 92%
npm-cg+ACG+TAJS+Closure 257 329 257 78% 100% 88%
npm-cg+TAJS+WALA+Closure 256 347 257 74% 99% 85%
TAJS+ACG+WALA+Closure 257 330 257 78% 100% 88%
ALL 257 348 257 74% 100% 85%
While TAJS and npm-cg maintain similarly high precision (98% and 91%, respectively), their recall (71% and 68%) are far below ACG’s. Closure’s recall (89%) is very close to that of ACG, but it has significantly lower precision (81%). WALA has a moderate precision (87%), but the worst recall (49%) in our benchmark test.
Looking at the two tool combinations, ACG+TAJS stand out based on F-measure, together they perform almost perfectly (98% precision and 99% recall). It looks like they complement each other quite well. In fact, they seem to be a perfect combination as there are no other three, four or five tool combinations that would even come close to this F-measure score. ACG, TAJS, and Closure reach the maximum recall together, while maintaining a precision of 83%. Taking all the tools into consideration, the combined precision decreases to 74% with a perfect recall.
Node.js module results. As we already described, only ACG and Closure were able to analyze the state-of-the-art Node.js modules listed in Table II. From the 2281 edges found together by the two tools in the six modules, 1304 are common, which is almost 60%. It is quite a high number considering the complexity of Node modules coming from structures, like event callbacks, module exports, requires, etc.
There were 336 edges (14.7%) found only by ACG and 641 (28.1%) found only by Closure.
As the amount of edges here is an order of magnitude larger than in the case of SunSpider benchmarks, we were not able to entirely validate the found calls manually. However, we evaluated a statistically significant amount of random samples.
To achieve a 95% confidence level with a 5% margin of error, we evaluated 179 edges that were uniquely found by ACG,
240 edges from those found only by Closure, and 297 from the common edges. We found that 149 out of 179 (83.24%) edges were true for ACG, 40 out of 240 (16.66%) edges were true for Closure, and 248 out of 297 (83.5%) were true for the common edges.
C. Performance analysis
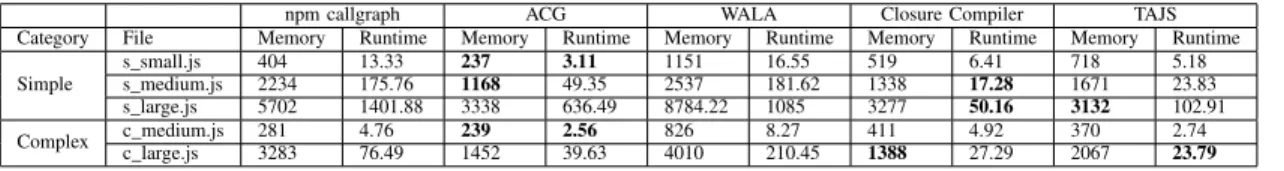
In this section, we present the results of the performance testing. We would like to note that the measurement results contain every step of call graph building, including reading the input files and writing the output. That was necessary because different tools implement call graph building in different ways, but reading input and writing output is a common point. We ran the tools ten times on each of the generated inputs and used the averages as a result (see Table VII). We highlighted the best runtime and memory consumption in each line.
In general, Closure, ACG and TAJS performed best in all cases. The npm callgraph module was generally faster than WALA. But when it comes to large inputs, WALA was 30%
faster than npm callgraph. On the other hand, it used more than one and a half times as much memory. The differences may vary with the sizes of the inputs, in some cases a tool was ~28 times faster (npm callgraph vs. Closure, s_large), and for another input only ~3% better than the other tool (npm callgraph vs. WALA, s_medium).
On the medium-sized test set in the complex category, ACG performed the best closely followed by TAJS. On the large set, Closure used the least memory, however TAJS produced the call graph in the shortest time. It is clearly visible that the more complex problems are considered (more similar to real-world applications) the more variance is present in the runtimes and memory consumptions. We suppose it is due to the different inner representations the tools have to build up in order to obtain a call graph. We conjecture that Closure and ACG keep their inner representations as simple as possible, consequently call edges are easily located by them in case of simple programs. For complex cases, this behavior could be less effective and the more complex inner representations will pay off.
We would like to stress that these results do not say anything about the correctness and accuracy of the produced output, they are simply approximate measurement data of the memory usage and running time performances.
Discussion of the results.Each approach and tool has its pros and cons. During this comparative study, we distilled the following statements.
• Recursive calls are not handled in every tool; Closure Compiler seems to be the most mature in this respect.
• Edges pointing to inner functions (function in a function) declarations are not handled by every tool, e.g. WALA produces a lot of false edges because of this.
• Only WALA and TAJS can detect calls of function arguments (i.e., higher-order functions).7
7We should note, however, that according to its documentation ACG might be able to identify higher-order functions in the optimistic configuration, at the cost of lower precision.
• ACG and TAJS are able to track complex control flows and detect non-trivial call edges.
• Closure often relies only on name-matching, which can cause false or missing edges.
• It seems that WALA can analyzeeval()constructions and dynamically built calls from strings to some extent.
• The calls from anonymous functions defined in the global scope are mistreated by npm-cg, which detects a call edge directly coming from the global scope in such cases.
• Closure has a superior runtime performance for very large inputs with high recall at the expense of a lower precision.
• ACG consumes the least memory and runs the fastest among all the tools on small to medium sized inputs.
• WALA and npm-cg are practically unusable for analyzing code at the scale of millions of code lines.
V. THREATS TOVALIDITY
A lot of factors might have affected our measurements.
Some of the tools might perform additional tasks during call graph construction, which we could not omit from the mea- surement. Nonetheless, we treat our performance measurement with proper care; they are only used to assess the orders of magnitudes for memory consumption and running times.
Our modifications in the tools for call graph extraction mechanism may have introduced some inconsistencies. How- ever, we made only slight changes and most of them affected only the reporting of edges, thus this threat has a limited effect.
We ran all the tools with default configurations. Various parameters might have affected the performance and precision of the tools. Nonetheless, we do not expect the main results to be much affected by these parameters.
We might have missed some good candidate tools from the comparison. However, the presented evaluation strategy and insights are useful regardless of this. Nevertheless, it is always possible to replicate and extend a comparative study like this.
Regarding the manual evaluation of the call edges, the subjectivity of evaluators is also a threat. We tried to mitigate this by having two authors validate all the edges for the 26 SunSpider benchmark test cases. There were preliminary dis- agreements in only 2 out of 348 cases between the evaluators that they could resolve in the end. Thus, we think the possible bias due to evaluation errors is negligible.
VI. CONCLUSIONS
Code analysis of JavaScript programs has gained a large momentum during the past years. Many algorithms for vulner- ability analysis, coding issue detection, or type inference rely on the call graph representation of the underlying program.
In this paper, we presented a comparative study of five state- of-the-art static algorithms for building JavaScript call graphs on 26 WebKit SunSpider benchmark programs and 6 real- world Node.js modules. Our purpose was not to declare a winner, rather to get empirical insights to the capabilities and effectiveness of the state-of-the-art static call graph extractors.
Each tool had its strengths and weaknesses. For example, Closure recognized recursive calls and had an overall good per- formance both in terms of running time and memory consump-