Coding of self-motion-induced and self- independent visual motion in the rat dorsomedial striatum
Anett J. Nagy1, Yuichi Takeuchi1, Antal Bere´nyi1,2*
1 MTA-SZTE “Momentum” Oscillatory Neuronal Networks Research Group, Department of Physiology, University of Szeged, Szeged, Hungary, 2 Neuroscience Institute, New York University, New York, New York, United States of America
*drberenyi@gmail.com
Abstract
Evolutionary development of vision has provided us with the capacity to detect moving objects. Concordant shifts of visual features suggest movements of the observer, whereas discordant changes are more likely to be indicating independently moving objects, such as predators or prey. Such distinction helps us to focus attention, adapt our behavior, and adjust our motor patterns to meet behavioral challenges. However, the neural basis of distin- guishing self-induced and self-independent visual motions is not clarified in unrestrained animals yet. In this study, we investigated the presence and origin of motion-related visual information in the striatum of rats, a hub of action selection and procedural memory. We found that while almost half of the neurons in the dorsomedial striatum are sensitive to visual motion congruent with locomotion (and that many of them also code for spatial location), only a small subset of them are composed of fast-firing interneurons that could also perceive self-independent visual stimuli. These latter cells receive their visual input at least partially from the secondary visual cortex (V2). This differential visual sensitivity may be an important support in adjusting behavior to salient environmental events. It emphasizes the importance of investigating visual motion perception in unrestrained animals.
Author summary
Evolution of vision has provided us with the capacity to detect moving objects. However, visual motion perception may occur both because of the movement of an observer in an otherwise stationary environment and because of independently moving observed objects.
Distinguishing these two sources or simply recognizing truly moving objects when the observer is also moving is essential for survival; it allows the reliable detection of predators or prey in real-world situations. In this study, we investigated the presence and origin of motion-related visual information in the striatum of rats, a hub of action selection and procedural memory. We found that while many of the striatal neurons responded to the apparent visual motion while the rat was running in an environment with striped walls, only a subset of them could also respond to moving stripes with similar properties if a1111111111
a1111111111 a1111111111 a1111111111 a1111111111
OPEN ACCESS
Citation: Nagy AJ, Takeuchi Y, Bere´nyi A (2018) Coding of self-motion-induced and self- independent visual motion in the rat dorsomedial striatum. PLoS Biol 16(6): e2004712.https://doi.
org/10.1371/journal.pbio.2004712
Academic Editor: Carl Petersen, EPFL, Switzerland Received: November 3, 2017
Accepted: June 11, 2018 Published: June 25, 2018
Copyright:©2018 Nagy et al. This is an open access article distributed under the terms of the Creative Commons Attribution License, which permits unrestricted use, distribution, and reproduction in any medium, provided the original author and source are credited.
Data Availability Statement: All relevant data are within the paper and its Supporting Information files.
Funding: Momentum Grant of the Hungarian Academy of Scienceswww.mta.hu. Received by AB. The funder had no role in study design, data collection and analysis, decision to publish, or preparation of the manuscript. European Research Council erc.europa.eu (grant number EU-FP7-ERC- 2013-Starting grant (No.337075)). Recieved by AB.
The funder had no role in study design, data collection and analysis, decision to publish, or preparation of the manuscript. National Research,
watched passively. This differential visual sensitivity may be an important mechanism of adjusting behavior to salient environmental events. The need for congruent locomotion to evoke neuronal responses in many of the recorded neurons emphasizes the importance of investigating visual motion perception in unrestrained animals.
Introduction
Besides the well-known motor functions of the basal ganglia [1], there is massive evidence for its role in higher-order integrative functions. While the ventral part of the caudate putamen (CPu) is mainly associated with reward and motivation-related processes (e.g., reinforcement [2]), the dorsal part is involved in executive functions based on both stimulus response learn- ing [3] and procedural memory [4–6]. Neurons of this dorsal sensorimotor striatum can per- ceive elementary visual cues representing luminance changes [7,8] and visual motion [9–12]
and integrate them with other modalities [13,14] to serve their function in multiple potential ways. On one hand, the self-motion-induced changes in the visual world (i.e., due to the dislo- cation of the observer) would serve as feedback for both corollary discharge [15–17] and for refining motor outputs [18]. On the other hand, the detection of the self-motion-independent object motion in an otherwise stationary environment would be very important for recogniz- ing approaching predators and other threats or escaping prey. This latter process may be important for survival by facilitating appropriate action selection through perceptual decision- making [19].
Previous experiments that studied the motion sensitivity of the CPu at the single-neuron level employed anesthetized or restrained animals. Thus, they were not designed for decipher- ing if the CPu is equally sensitive for the self-motion-induced (i.e., dislocations of the visual scene congruent with self-motion) and the self-motion-independent object motion. More pro- foundly, there is no existing evidence that the CPu neurons can distinguish between these two conditions at all nor whether they can integrate the visual motion percepts with spatial repre- sentations or other aspects of striatal information processing.
To answer this question, we investigated the response profiles of the dorsal CPu neurons to self-independent and self-motion-induced visual motion stimuli in freely moving rats. We did this by conducting large-scale, high-density extracellular recordings. We also made efforts to show the role of the corticostriatal pathway in shaping these responses, as there is no consensus regarding the origin of the striatal visual information either [7,20–22].
Results
We conducted our experiments on male Long-Evans rats (N= 32, 285–655 g; 3–12 mo old).
The intermediate part of the dorsomedial striatum has been reported to display visual stimu- lus—induced electrophysiological responsivity in many species [7,9–11]. This region has also been reported to receive axons from both the A18 and A18b secondary visual cortical areas and to be the exclusive striatal recipient of innervation from the primary visual cortex (V1) [20,23]. To confirm this finding, we injected FluoroGold to the dorsomedial CPu (N= 4 rats, Fig 1A) and identified regions with retrogradely labeled neuronal somata. Similarly to previ- ous results obtained in mice and rats [7,23], we found that neurons of the secondary visual cortex (V2, and also the most rostral part of the V1) send axonal projections to the injected area of the CPu (Fig 1B). Based on their large somata, their thick apical dendrites, and their restricted layer V locations, the labeled neurons are putative pyramidal neurons. We did not
Development and Innovation Officewww.nkfih.hu (grant number EFOP-3.6.1-16-2016-00008).
Recieved by AB. The funder had no role in study design, data collection and analysis, decision to publish, or preparation of the manuscript. Uehara Memorial Fundwww.taisho-holdings.co.jp.
Recieved by YT. The funder had no role in study design, data collection and analysis, decision to publish, or preparation of the manuscript.
Competing interests: I have read the journal’s policy and the authors of this manuscript have the following competing interests. AB and AJN are owners of Amplipex Ltd and Neunos LLC., Szeged, Hungary, which manufacture signal-multiplexed headstages and neurostimulator devices.
Abbreviations: a.u., arbitrary unit; AP,
anteroposterior; AuCx, auditory cortex; aVis, active visual; BDA, biotinylated dextran amine; BSA, bovine serum albumin; CPu, caudate putamen;
DAPI, 40,6-Diamidino-2-phenylindole dihydrochloride; dB, decibel; DLG, dorsolateral geniculate nucleus; DV, dorsoventral; EPSP, excitatory postsynaptic potential; FFN, fast-firing neuron; FR, firing rate; IEG, immediate early gene;
ISI, interspike interval; ISI2s, interspike interval exceeding 2 s; ITCN, Image-based Tool for Counting Nuclei; LCD, liquid crystal display; LFP, local field potential; ML, mediolateral; NGS, normal goat serum; PB, phosphate buffer; PBS, phosphate-buffered saline; PBS-X, PBS containing 0.3% Triton X-100; PBS-XBSA, PBS-X containing 1% BSA; PFA, paraformaldehyde; PFN, phasically firing neuron; PSST, postspike suppression time;
PV, parvalbumin; pVis, passive visual; SUA, single- unit activity; TFN, tonically firing neuron; V1, primary visual cortex; V2, secondary visual cortex;
V2L, lateral secondary visual cortex; V2ML, mediolateral secondary visual cortex; V2MM, mediomedial secondary visual cortex.
find any labeled neurons at the more caudal parts of the V1 or in the lateral geniculate nucleus, but the lateral-posteromedial and posterior nuclei of the thalamus were densely labeled.
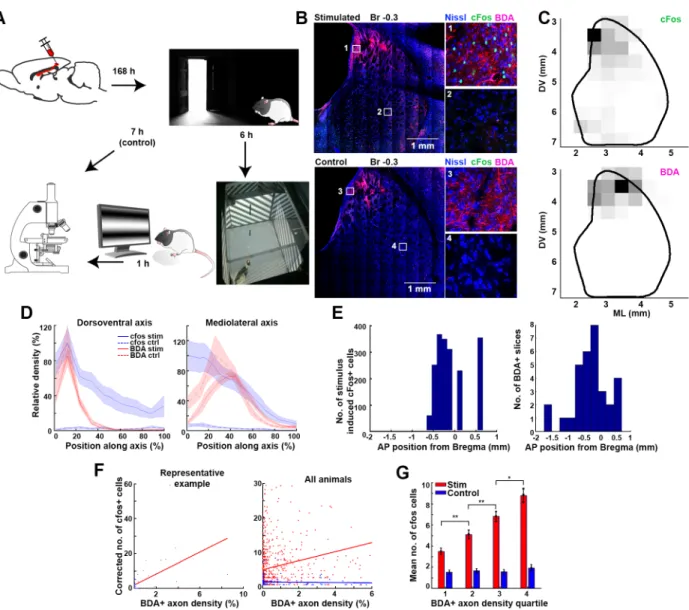
To evaluate the colocalization of the axons originating from the visual cortex and the visu- ally active CPu neurons on the fine scale, we injected biotinylated dextran amine (BDA) at the V2 locations identified in our retrograde tracing experiment (Fig 2A). After 1 wk of survival, the animals were placed into a 60×60 cm large box whose 35 cm tall walls featured 4 liquid crystal display (LCD) monitors to provide a self-motion-independent, passive visual (pVis) stimulation. For the initial 6 h, the monitors were turned off, and the animals were kept in darkness. Then, a pseudorandom sequence of moving visual gratings and blinking lights was displayed on the monitors for 1 h while the animals were randomly exploring the box (Fig 2A, for details of the pVis stimulation, see theMaterials and methodssection). The control animals were kept in darkness for 7 h without any stimulation. The rats were overanesthetized and per- fused. Coronal sections of their brains were developed to visualize BDA-positive axons and the expression of the cFos (Fig 2B). We also tested if the cFos+ neurons were parvalbumin positive (PV+). We found that the presence of the two markers were almost mutually exclusive (as demonstrated by the anti-cFos and anti-PV double immunostaining in 4 sections of 1 rat,
Fig 1. Anatomical connectivity of the dorsomedial striatum. (A) Injection schematic and representative micrographic images of the striatal injection site of the retrograde tracer Fluorogold. (B) Retrogradely labeled cell bodies were found in the V1 and V2 ipsilaterally, as well as in the posterior (“Po”) and LPMR thalamus. Note the lack of labeling at the DLG. Bottom panel shows a magnified image of the area V2MLof the middle panel. The thick apical dendrites and the location of the somata suggest that the labeled neurons are putative pyramidal neurons. AuCx, auditory cortex; Br, bregma; CPu, caudate putamen; DLG, dorsolateral geniculate nucleus; LPMR, lateral- posteromedial; V1, primary visual cortex; V2, secondary visual cortex; V2L, lateral secondary visual cortex; V2ML, mediolateral secondary visual cortex; V2MM, mediomedial secondary visual cortex.
https://doi.org/10.1371/journal.pbio.2004712.g001
N= 490 and 406 single positives for anti-cFos and anti-PV, respectively, and only 3 double- positive neurons).
Automated, unsupervised algorithms were used to quantify the BDA+ axon density and the number of cFos+ neurons in 425×425μm squares in each slice of the CPu (Fig 2Cand
Fig 2. Colocalization of the stimulus-induced striatal cFos expression and the axon terminals from the visual cortex. (A) Experimental schematics. (B) Representative example sections of a visually stimulated (upper panels) and a control animal (lower panels). Blue, red, and green color channels are assigned to the respective fluorochromes of the Fluoro Nissl, BDA, and cFos immunohistochemistries. Insets show the magnified areas marked by rectangles on the left panels. Note the lack of cFos+ neurons on the lower (control) panels, while the anterograde BDA tract tracing from the visual cortex shows a similar axonal distribution pattern in both cases. (C) Unsupervised quantification of the striatal distribution of cFos+
neurons (top panel) and BDA+ axons (bottom panel) in a representative coronal section of a stimulated animal’s brain. See alsoS1 Fig. (D) cFos (blue) and BDA (red) density distribution in stimulated (solid lines) and control animals (striped lines). Left and right panels show the distributions along the respective DV and ML axes of the striatum. (E) AP distribution of visual stimulation—induced cFos+ somata (left panel) and the distribution of slices with detectable FluoroGold-labeled axons (N= 37 slices in 9 animals). Note that the BDA+ axons target the similar AP segment of the CPu where the visually inducible cFos activity was present. (F) Correlation of the normalized cFos and BDA densities in a representative stimulated animal (left panel) and in all animals (right panel). The right and blue dots of the right panel and regression lines, respectively, represent data from the stimulated and sham animals. (G) Mean number of the cFos+ neurons in the striatum calculated for the 4 BDA axon density quartiles.
Note that while the higher BDA density predicts higher cFos+ cell numbers in the stimulated animals (red), the cFos+ density is constant with no respect to the BDA distribution in the control animals (blue). AP, anteroposterior; BDA, biotinylated dextran amine; CPu, caudate putamen; DV, dorsoventral; ML, mediolateral.
https://doi.org/10.1371/journal.pbio.2004712.g002
S1 Fig). We found that axons originating from V2 neurons colocalized with the cFos+ neurons.
Both the BDA+ and cFos+ locations were restricted to the dorsal part of the CPu. Regarding the mediolateral (ML) extent, cFos activity was present at the medial and intermediate loca- tions, while BDA was mainly present at the intermediate (Fig 2D). The induced striatal cFos expression was present only between AP coordinates−0.7 and 0.7 from the bregma, and V2 axons targeted the same intermediate segment of the CPu between anteroposterior (AP) coor- dinates−1.7 and +0.5 mm from the bregma (Fig 2E).
The BDA+ axon densities in the coronal plane were spatially correlating with the cFos+ den- sity maps of the stimulated animals (stimulated: R = 0.20,p<0.005,N= 696 density pairs from 5 animals; control: R =−0.03,p= 0.69,N= 134 density pairs from 4 animals, Pearson’s linear correlation,Fig 2F). We concluded that the cFos expression was a result of the visual stimulation, as it was uniformly low at every location in the control animals (stimulated:
3.51±0.30, 5.12±0.42, 6.84±0.50, 8.82±0.66 cFos+ neurons found at consecutive BDA den- sity quartiles,p= 0.002, 0.009, 0.019 for interquartile comparison,N= 4×174 density values;
control: 1.55±0.19, 1.69±0.19, 1.59±0.22, 1.94±0.28 cFos+ neurons found at consecutive BDA density quartiles,p= 0.61, 0.72, 0.33 for interquartile comparison,N= 4×34 density val- ues; two-samplettest;Fig 2G).
Next, to delineate the functional details of the visual responsivity of the CPu neurons, we conducted electrophysiological investigations on the rostrocaudal segment of the CPu that we previously identified. We recorded the activity of a total of 734 neurons using silicon electrodes (“silicon probes”) in freely moving rats (N= 42 sessions in 6 animals) performing various behavioral and visual stimulation tasks. The recorded single units were isolated from the com- pound electrical activity based on their action potential waveforms, using a semiautomated clustering method [24,25]. Noisy units or multiunits were discarded, while clusters meeting our predefined isolation quality criteria [26] were classified as phasically firing neurons (PFNs, N= 467, 63.62% of all isolated single units), fast-firing neurons (FFNs,N= 163, 22.21%), and tonically firing neurons (TFNs,N= 56, 7.63%). These classifications were based on the electrophysiological features of the corresponding waveforms and spike trains. These classes putatively match the morphological and neurochemical groups of medium spiny, PV+ aspiny, and cholinergic aspiny neurons, respectively [4,27] (S2 Fig). In 6% of the recorded single units, the classification was ambiguous because of their very low firing rate (FR). Those units were discarded from further analysis.
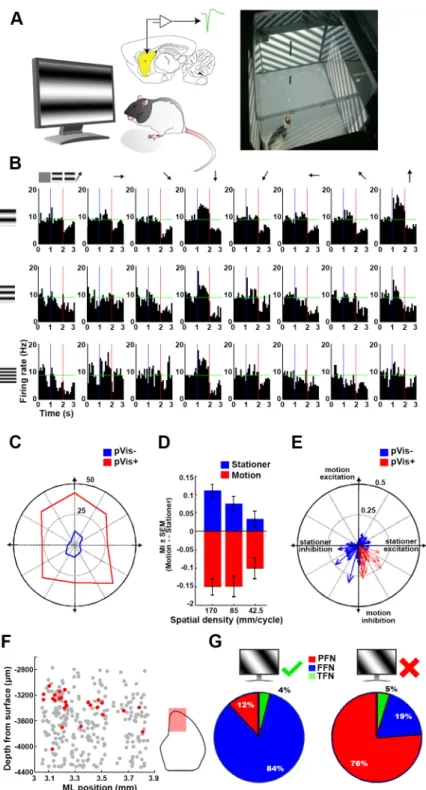
To test the responsivity of the CPu neurons to moving visual stimuli, animals were placed into the visual stimulation box used in the cFos expression experiments (Fig 3A). Each stimu- lation trial began with presenting a nonpatterned gray background for 500 ms (uniform screen), followed by 500 ms of sinusoidally modulated stationary grating pattern (stationary grating). Lastly, the pattern was gradually moved to be perpendicular to the grating’s axis (moving grating) for another 500 ms. The spatial density of the grating, the velocity, and the direction of the motion were all varied in a pseudorandom order until each parameter combi- nation was repeated at least 150 times [9,28,29]. Neurons were considered responsive if they significantly altered their FR in response to either the stationary or the moving grating for at least 2 of the parameter combinations. Altogether, 289 neurons were tested using this para- digm (21 sessions of pVis stimulation), and only 25 of them were considered responsive to the self-motion-independent pVis stimulation (pVis+ neurons). In general, we found no system- atic preference toward any of the tested directions of motion. Some neurons responded simi- larly to all directions, while others preferred only a few adjacent directions or two opposing ones (Fig 3B and 3C).
Regarding the spatial resolution of the grating and the velocity of the motion, neurons were clearly more sensitive to broader stripes sliding with a high velocity compared to the dense,
Fig 3. Self-motion-independent pVis stimulation of the striatal neurons. (A) Schematics of the experimental arrangement. The striatum is marked by yellow shading. (B) Peristimulus time histograms of a pVis+ striatal neuron’s responses during visual stimulation using 3×8 parameter combinations. The first third of each peristimulus time histogram represents the activity of the neuron while watching a uniform gray image. The middle and right thirds, respectively, reflect the responses during still and moving stripes. Horizontal green lines represent the spontaneous FR of the same neuron. Note that horizontally oriented still patterns evoked increased FRs, while moving stripes caused inhibition with no respect to the direction of the motion. (C) Rose plot showing the percent of pVis+ and pVis−
neurons responsive to the 8 different directions tested. The axes of the plot match the movement directions. Note that neither the pVis+ (red) nor the pVis−(blue) neurons expressed any obvious preference toward any motion directions.
(D) Mean MIs of all pVis+ neurons during stationary (blue bars) and moving stimulation (red bars). The pVis+
slowly shifting gratings (p<0.005 for all comparisons except thick versus medium moving stripes, for whichp= 0.92;N= 200 in each group; pairedttest;Fig 3D). To describe the general responsiveness of these neurons, we averaged the modulation indices (MIs) of the stationary and moving conditions (calculated against the uniform condition) across all stimulus condi- tions. Surprisingly, the response combinations occupied only a restricted subset of the avail- able state space: the pVis+ neurons either increased their firing in the presence of the stationary grating or became inhibited by the moving gratings or from the combination of these two response types (Fig 3E). The pVis+ neurons were not uniformly distributed among the recorded spatial locations. They were mainly located at the mediodorsal part of the CPu (Fig 3F). The majority were FFNs (84%; 12% PFNs; and only 1 neuron was classified as a TFN). In contrast, the distribution of the putative cell types among pVis−neurons resembled the histological proportions of these classes (76% PFN, 19% FFN, and 5% TFN) (Fig 3G).
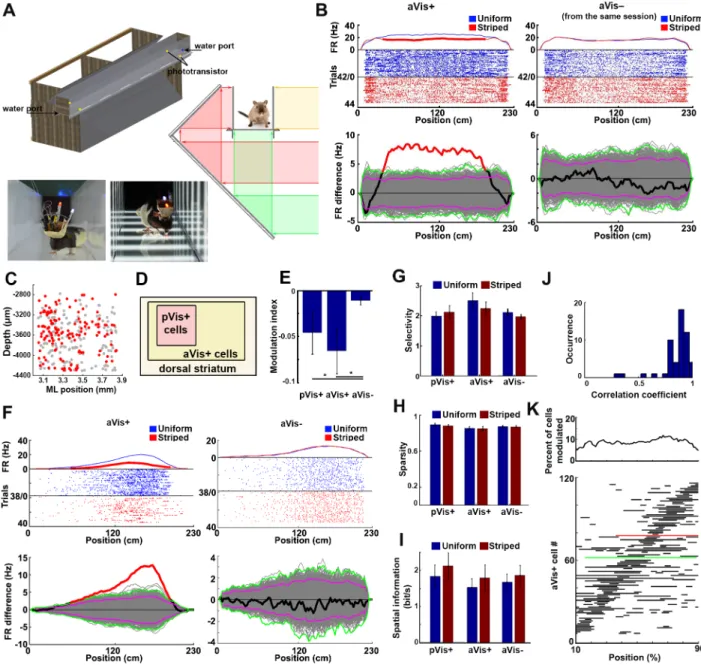
The previously mentioned moving visual stimuli were presented while the animals were either standing still or when their movements were random compared to the perceived inten- sive visual motion (which resembled self-independent object motion). These pVis stimuli may be processed differently from the self-motion-induced optic flow of natural scenes, which is concordant with the other senses (e.g., the proprioception); thus, we decided to also investigate the visual responsivity of CPu neurons during self-motion. In contrast to experiments on head-fixed animals placed in a virtual environment, our aim was to generate a realistic visual experience that was congruent with the movements of the animals (active visual [aVis] stimu- lation), in order to preserve all the proprioceptive, vestibular, and exteroceptive aspects of the movements. We trained the animals to run in a linear maze back and forth for a water reward.
To keep control of the visual environment seen by the rats during each run, we built the walls of the linear maze from translucent plexiglass. We placed it in a frame equipped with 2 perpen- dicular mirrors along the whole track (Fig 4A). Computer-generated visual scenes were pro- jected by an LCD projector onto both the walls and the floor of the linear maze, with the help of mirrors to avoid shading by the rat. Before each trial, the projected scene was changed to either a uniformly gray (“uniform maze”) or a grated pattern with similar spatial frequency and luminance as was used during the pVis stimulation (“striped maze”) (Fig 4A). The “uni- form” and “striped” patterns were isoluminant, and they were pseudorandomly alternated trial by trial to avoid the biasing effect of slow changes in internal brain dynamics.
In total, 685 CPu neurons were tested in this task (in 41 sessions with 6 rats, including the neurons also tested in the pVis environment). In marked contrast to the small proportion of pVis+ neurons, 325 of them (62% PFN, 26% FFN, and 11% TFN) displayed a significant change in their FRs in response to the striped environment (aVis+ neurons).Fig 4Bshows a representative example of an aVis+ (FR = 0.80±0.10 Hz and 0.56±0.08 Hz in the respective uniform and striped trials,p<0.01, pairedttest,N= 20 spatially binned FR pairs; more exam- ples are shown onS3 Fig) and an aVis−neuron (FR = 0.53±0.08 and 0.53±0.1 Hz in the
neurons were more sensitive to low spatial and high temporal frequencies during both still and moving stimulation.
(E) Response vectors of pVis+ (red) and pVis−(blue) neurons. The MIs of the 24 stimulus conditions are averaged for each cell. Still and moving MIs are assigned to the X and Y components of each response vector. Note that all pVis+
neurons expressed stationary stimulus-induced excitation combined with motion-induced inhibition. (F) Location of the pVis+ neurons (red dots) in the coronal plane. Gray dots denote the location of the nonresponsive neurons. The red-shaded part of the inset on the right shows the area covered by the electrophysiological investigations. Note that the visually responsive cells were mainly present at the dorsomedial segment of the recorded area. (G) Distribution of cell types among the pVis+ (left) and pVis−(right) neurons. The majority of the visually excitable neurons were FFNs, while the distribution of the other neurons followed histological proportions. FFN, fast-firing neuron; FR, firing rate;
MI, modulation index; ML, mediolateral; PFN, phasically firing neuron; pVis, passive visual; TFN, tonically firing neuron.
https://doi.org/10.1371/journal.pbio.2004712.g003
Fig 4. Self-motion-induced aVis stimulation of the striatal neurons. (A) Schematics (left) and cross section (middle) of the linear maze with a dynamically updated visual environment. The bottom panels show photographs of rats running in the uniform and the striped environment. (B) Raster plots and place-resolved FRs of a representative pVis+/aVis+ (left, called as pVis+) and an aVis−/pVis−(right, called as aVis−) neuron simultaneously recorded during the same session. The blue dots and curve represent trials during uniform maze running; the red ones show the firing patterns in the striped maze. Note that the two conditions were randomly alternated from trial to trial. For display purposes, trials are reordered by the stripedness. Lower panels show the details of the statistical tests of space-resolved visual modulation. The thick black line shows the real FR difference, while the gray curves denote the label-shuffled surrogate differences. Purple and green lines depict the “local” and “global”
significance thresholds [30], respectively. Spatial locations breaking the global significance limits are marked with a thick red line. (C) Location of the aVis+ neurons (red dots) in the coronal plane. The gray dots denote the location of the nonresponsive aVis−neurons. aVis+ neurons were distributed more uniformly in the recorded area than the pVis+ cells. (D) Venn diagram of the CPu neurons showing the set relationship of the aVis+ and pVis+ neurons. Note that all recorded pVis+ neurons were also aVis+ at the same time. (E) Mean modulation indices of pVis+, aVis+, and aVis−neurons in the aVis environment. Note that pVis+ neurons decreased their FRs when the rat was running in the striped maze, similar to their behavior in the pVis experiment. (F) Two representative striatal neurons with place field—like properties recorded simultaneously in an aVis session.
Note that the activity of the left neuron was rate modulated by the stripedness (an aVis+ neuron), while the right example neuron was showing an almost identical spatial response profile in both the uniform and the striped conditions (aVis−neuron). Bottom panels show the details of the space- resolved statistical tests as on panel B. (G, H, I) Spatial coding efficiency expressed as “spatial selectivity” (G), “sparsity” (H), and “spatial
information” (I) of the recorded neurons in uniform (blue bars) and striped conditions (red bars). (J) Distribution of the correlation coefficients of the spatially binned FRs of neurons with place field—like activity during running in the uniform and the striped environments. The place fields were stable across both the uniform and the striped conditions, as expressed by the high spatial correlation values of the neurons with place field—like
respective uniform and striped trials,p= 0.76) recorded simultaneously with its aVis+ peer.
The aVis+ neurons were not restricted to the most superficial and medial part of the medio- dorsal CPu. Instead, they were distributed more uniformly (Fig 4C).
Importantly, all pVis+ neurons were also responsive in this task. Thus, the pVis+ cells can be considered as a subgroup of the aVis+ neurons (Fig 4D). For simplicity, from here on we will refer to the double responsive (i.e., pVis+/aVis+) neurons as pVis+ neurons, and those cells which were only responsive in the aVis environment but not in the pVis one (i.e., pVis−/aVis+ neurons) as aVis+ neurons.
The firing pattern of the pVis+ neurons in the uniform maze was more deterministic with regard to their activity in the striped maze, compared to the pVis−neurons (R = 0.77±0.02 and 0.65±0.02 for pVis+ and pVis−neurons, respectively; Pearson’s linear correlation between uniform and striped runs,p= 0.032, two-samplettest,S4 Fig). In agreement with their behavior during the pVis stimulation experiment, the pVis+ neurons decreased their FRs while the rats were running in the striped linear maze.
The visual modulation of the aVis+ neurons in this task was similar to the response profiles of the pVis+ neurons (p= 0.047 for pVis+ versus aVis−, and 0.041 for aVis+ versus aVis−com- parisons, MI =−4.7%±2.3%,−6.9%±2.7%, and−1.0%±0.5%;N= 12, 133, and 50, respec- tively, for the pVis+, aVis+, and aVis−neurons, two-sample Kolmogorov-Smirnov test;Fig 4E). This result confirmed the visual motion-induced inhibition observed in the passive stimu- lation task.
The dorsomedial part of the intermediate striatum is known to integrate highly heteroge- neous, multimodal inputs in mice [31]. We were therefore interested if pVis+ and/or aVis+
neurons also code context- or location-dependent features as suggested by earlier studies [32,33]. A significant number of neurons showed spatial location—selective activity, similar to the place cells [33,34] of the hippocampal formation (36% of the pVis+, 20% of the aVis+, and 17% of the aVis−neurons). All of these neurons had one single place field similar to the proxi- mal CA1 and CA3c regions of the hippocampus [35]. However, their “place fields” were rela- tively large, usually spanning over more than one-third of the track (Fig 4FandS3 Fig).
The FRs of these “place cell—like” neurons were rate modulated by the presence of striped patterns to a similar extent as the activity of those that were active at every location. The spatial coding ability of the aVis+ neurons was slightly (but not significantly) better than either the pVis+ or the aVis−neurons and was not influenced by the presence of the striped pattern (selectivity of pVis+ cells: 1.98±0.14 and 2.11±0.21; aVis+ cells: 2.46±0.3 and 2.33±0.28;
aVis−cells: 2.11±0.11 and 1.96±0.09; sparsity of pVis+ cells: 0.88±0.01 and 0.87±0.01;
aVis+ cells: 0.85±0.02 and 0.85±0.02; aVis−cells: 0.87±0.01 and 0.87±0.01; spatial Infor- mation of pVis+ cells: 1.83±0.32 and 2.12±0.36; aVis+ cells: 1.63±0.25 and 1.90±0.39;
aVis−cells: 1.78±0.24 and 1.98±0.29, in the uniform and striped mazes respectively;
p>0.05 for all comparisons, pairedttest across conditions, and Kolmogorov-Smirnov test across neurons;N= 21 pVis+, 45 aVis+, 31 aVis−FFNs [35];Fig 4G–4I).
The locations and extent of the place fields were highly correlating in both the uniform and the striped trials. This suggests that the animals considered the two conditions spatially identi- cal despite the different visual percepts (mean Rho = 0.86±0.13;p<0.05 in 51 of 53 neurons, Pearson’s linear correlation of location-resolved FRs in the two conditions, 20 spatially binned
activity. See alsoS5 Fig. (K) Distribution of the spatial segments at which the FRs of the aVis+ neurons were significantly rate modulated by the perceived visual motion (bottom). Green and red lines represent the example aVis+ neurons shown on panels “B” and “F”, respectively. Note that the significantly modulated segments uniformly tiled the whole extent of the maze (top plot). aVis, active visual; FR, firing rate; ML, mediolateral; pVis, passive visual.
https://doi.org/10.1371/journal.pbio.2004712.g004
FR pairs per neuron,Fig 4JandS5 Fig), and the perceived visual motion caused only a rate remapping [36,37] but not a location remapping of the “place fields.” The spatial locations where the stripedness significantly altered the neuronal activity were determined by compar- ing the induced firing pattern differences to surrogate datasets (Fig 4BandS3 Fig). Of the aVis+ cells, 124 met the spatially resolved significance criteria (seeMaterials and methods).
The significantly modulated segments of the space-resolved firing patterns uniformly tiled the whole extent of the linear maze; 8.51%±0.38% of the 124 aVis+ neurons were modulated at any spatial location (p= 0.76,N= 2,444, chi-squared goodness-of-fit test against uniform dis- tribution,Fig 4K).
The visual modulation of the firing patterns was stronger when faster visual motion was perceived (i.e., faster running speeds), similarly to the spatiotemporal tuning found in the pVis task (Rho =−0.46,p<0.001, Pearson’s linear correlation of the instantaneous velocity and the visual MIs inN= 304 spatial bins from 28 sessions,S6A Fig).
Only a small fraction of the visually responsive neurons modulated their FRs as a function of the instantaneous running speed (p<0.05, Pearson’s linear correlation; number of modu- lated neurons = 3 of 25 pVis+, 20 of 221 aVis+, 26 of 233 aVis−). The velocity of the animals was identical in the two environments (83.3±18.9 cm/s versus 85.0±12.3 cm/s,n= 718 and 649 for uniform and striped conditions, respectively;p= 0.15, two-sample Kolmogorov-Smir- nov test;S6B Fig).
Although the overall brightness of the “uniform” gray and the black and white “striped”
conditions was identical, an alternative explanation of the FR modulation of the aVis+ cells may be that the striped pattern by itself could influence the neuronal activity, either by induc- ing a different contextual percept or by its local brightness fluctuations. To exclude these alter- natives, we performed a set of complementary experiments and analyses.
The rats perceived a relatively stationary representation of the striped and the blank pat- terns while they stayed at the reward zones (i.e., the last 10 cm of the maze at each end). We compared the firing patterns of the aVis+ cells during these segments to decide if the two con- texts induced the FR modulations. The animals spent comparable time in the reward zones (23.11±1.88 s and 26.46±2.14 s,N= 1,303 and 1,343 trials for uniform and striped condi- tions, respectively,p= 0.24, two-samplettest,S6C Fig), and the mean FRs of the aVis+ cells were almost identical (mean FRs = 9.01±0.89 Hz and 8.99±0.88 Hz for uniform and striped conditions, respectively,p= 0.83,N= 325 neurons, pairedttest,S6D Fig). By comparing the neuronal activity on a cell-by-cell and trial-by-trial basis, only 36 of the 325 aVis+ neurons showed significantly different FRs in the two conditions (p<0.05, two-samplettest on the per-trial firing patterns for each neurons,S6E Fig).
We also tested if the aVis+ neurons were sensitive to changes of brightness. First, to check their sensitivity for global changes, we exposed the rats to 0.5 Hz blinking light in the pVis environment.S6F Figshows 2 representative neurons modulated by the global luminance change (p<0.001 in both cases,N= 50 trials). Eleven and 2 of the 20 tested pVis+ cells, 5 and 11 of the 111 aVis+ cells, and 7 and 12 of the 124 aVis−neurons, respectively, responded with excitation and inhibition for the luminance increase (p<0.05, pairedttest,N= 50 trials for each neuron;S6F and S6G Fig).
Second, we analyzed FRs in the linear maze stripe cycle by stripe cycle to check if the aVis+ neurons display phasic responses to the gradually changing brightness of each stripe.
The aVis+ neurons were not sensitive to the local luminance changes of the black and white stripes. The FRs were nearly uniform at locations with low and high local luminance in the striped condition (p= 0.23 and 0.45,N= 193 and 358 spikes for the uniform and the striped conditions, respectively; Rayleigh test;S6H Figshows the stripe phase—resolved firing patterns of a representative example neuron). For all aVis+ neurons, the circular MIs of the FR patterns
were similar in the “striped” and the “uniform” trials (p= 0.86, two-samplettest, mean MI = 13.22%±1.50% and 13.61%±1.82%,N= 93 and 78 aVis+ neurons with nonuniform cir- cular distribution in the uniform and the striped conditions, respectively;S6I Fig).
These observations led us to conclude that the FR change of the aVis+ neurons between the two applied conditions was induced by the perceived visual motion, as all other aspects were kept and were perceived unchanged (i.e., trajectory, reward, global luminance, and other con- textual cues).
The neurons of the CPu were generally phase locked to the characteristic frequency bands of the local field potential (LFP,Fig 5A and 5B,S7 Fig) recorded in the dorsomedial CPu. In general, the pVis+ and aVis+ neurons were more weakly coupled to these oscillations than
Fig 5. Phase modulation of the recorded CPu neurons by the characteristic frequency bands of the striatal LFP.
(A) Mean LFP spectral power at locations of the pVis+ (red), aVis+ (green), and pVis−/aVis−somata (blue). The theta and beta powers were significantly weaker at locations where pVis+ neurons were present (the red horizontal lines show the significant segments). (B) Respective phase coupling of a representative neuron to the delta, theta, beta, low- gamma, and high-gamma bands. The mean preferred phase values and MIs are shown above each plot. Green curves mark the smoothed distributions. (C) Mean MIs of the pVis−/aVis−(blue), aVis+ (green), and pVis+ (red) neurons.
The pVis+ neurons were less coupled to the phase of the theta and beta band oscillations. The color codes are the same as on panel A. a.u., arbitrary unit; aVis, active visual; CPu, caudate putamen; LFP, local field potential; MI, modulation index; pVis, passive visual.
https://doi.org/10.1371/journal.pbio.2004712.g005
their pVis−/aVis−peers (mean MIs, delta: 10.84±0.50 versus 7.89±0.50 and 7.85±0.41;
theta: 12.89±0.76 versus 10.37±1.16 and 4.29±0.65; beta: 10.48±0.58 versus 8.12±0.65 and 6.80±0.58; low-gamma: 14.64±0.64 versus 11.36±0.53 and 10.93±0.59; high-gamma:
26.96±1.10 versus 23.02±1.12 and 22.57±1.12 for pVis−/aVis−versus aVis+ and pVis+ neu- rons, respectively). This difference in phase coupling was the most prominent in the theta band (p<0.001,n= 145 and 25, Kolmogorov-Smirnov test,Fig 5C).
To check if the anatomically identified cortical regions indeed play a role in shaping the activity of the visual motion—sensitive CPu cells, we lastly set out to investigate their func- tional connectivity. However, confirming the direct monosynaptic cell-to-cell interactions between the visual cortex and the CPu neurons in intact animals is like looking for a needle in a haystack. Cross-correlation-based analyses are very unreliable with sparsely firing neurons because of the low number of spikes, even if extensive recordings are done for many hours.
Optogenetics-based transsynaptic excitation/inhibition is also problematic because of the unknown synaptic transmission efficacy. Moreover, V1 is known to project only to a very thin medial strip of the CPu along its ventricular wall [20]. This is extremely difficult to investigate using electrophysiological approaches in freely moving animals. Because of these constraints, we employed two alternative approaches.
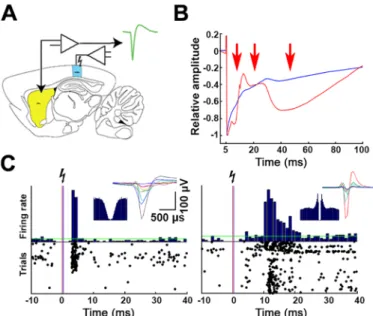
First, we implanted bipolar-stimulating electrodes into area V2 (AP−4.5 mm; ML 2.8 mm;
dorsoventral [DV] 0.5 and 2 mm) of 2 animals. In a subset of sessions, we delivered short electrical pulses (N= 21 sessions) to functionally verify the previously confirmed long-range anatomical connection (Fig 6A). The electrically evoked, complex LFP deflections had 3 distinct components whose latency and duration matched with the single unit—evoked responses: a narrow, precisely timed monosynaptic deflection was followed by a wider (pre- sumably disynaptic) one and an even longer polysynaptic waveform. In contrast, at cortical
Fig 6. Entrainment of the CPu activity by electrical stimulation of the V2. (A) Schematics of the electrical stimulation. The sites of the cortical stimulation and the striatal recordings are respectively marked by blue and yellow colors. (B) Representative striatal (red) and a control cortical (blue) mean LFP traces as a response to V2 electrical stimulation. Note the 3 remarkable evoked deflections in the striatal LFP (red arrows), which represent the aggregate population activity of the mono-, di-, and polysynaptically activated CPu neurons. (C) Representative peristimulus time histograms and raster plots of a monosynaptically (left panel) and a polysynaptically (right panel) entrained CPu neuron during electrical stimulation of the V2. The insets show the waveforms and autocorrelograms of each example neuron. CPu, caudate putamen; LFP, local field potential; V2, secondary visual cortex.
https://doi.org/10.1371/journal.pbio.2004712.g006
locations above the CPu, only a single monotonic deflection attributed to the volume-con- ducted stimulus artefact was present (Fig 6B). The brief electrical pulses evoked spiking in 32 out of 289 CPu neurons, either with very short response latency (4–6 ms, representing a mono- synaptic input) or through a longer multisynaptic pathway (Fig 6C). The group of neurons responsive to electrical stimulation of area V2 and the group of pVis+ neurons were mainly overlapping; 20 of 25 (80%) pVis+ neurons were also sensitive to electrical stimulation, while the same applied to only 12 of 252 (6%) pVis−cells. Consequently, the intrastriatal distribu- tions of these groups were similar; they were also mainly located at the mediodorsal part of the CPu.
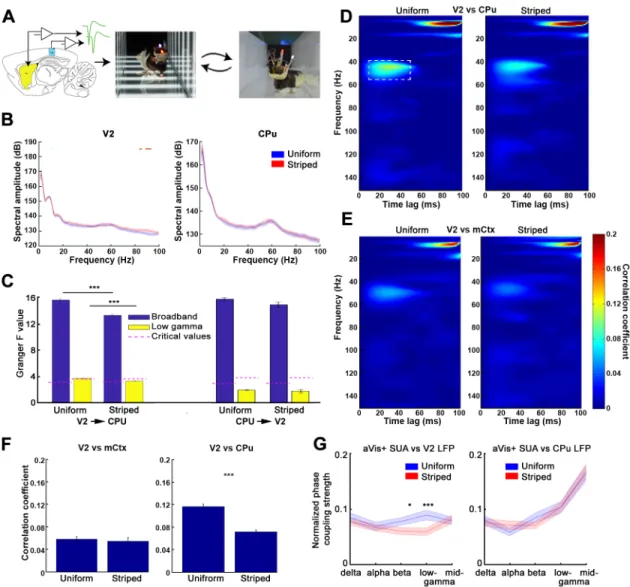
As a second approach, we implanted an additional 32-channel silicon probe into area V2 in 2 animals. We recorded both single units and LFPs while the animals were exposed to the aVis stimulation protocol in the linear maze (Fig 7A). The frequency spectra of the LFPs recorded at the CPu and at V2 were identical in the striped and uniform trials (except 80–90 Hz in V2,Fig 7B). This suggests that the visual environment does not alter the gross activity of these struc- tures. Still, V2 activity has a role in shaping the activity of the striatum, and its influence is approximately 10%–15% weaker in the striped environment than in the uniform trials. This was shown by the Granger causality between the V2 and CPu broadband and the low-gamma filtered LFPs (V2!CPU: Fbroadband= 15.58±0.22 and 13.27±0.2; Flow-gamma= 3.63±0.06 and 3.32±0.06; CriticalValuebroadband= 3.13±0.008 and 3.25±0.008; CriticalValuelow-gamma= 3.63±0.008 and 3.67±0.008;N= 3,424 and 4,096 trials in the uniform and the striped condi- tions, respectively;p<0.001 for both the broadband and low-gamma band comparison of the F-values of all trials; two-samplettest;Fig 7C). Regarding the information flow from the CPu to V2, the analysis could not reveal significant causality in the gamma band; however, the broadband causality was maintained. We did not find any difference between the uniform and striped conditions in this case (CPu!V2: Fbroadband= 15.71±0.24 and 14.85±0.4;
Flow-gamma= 1.98±0.08 and 1.81±0.25; CriticalValuebroadband= 3.01±0.008 and 3.01±0.008;
CriticalValuelow-gamma= 3.84±0.008 and 3.84±0.008;N= 3,424 and 4,096 trials in the uni- form and the striped conditions, respectively;p= 0.21 and 0.24 for the broadband and low- gamma band comparison of the F-values of all trials, respectively; two-samplettest;Fig 7C).
The high level of causality of the broadband signals in the CPu-V2 direction calls for the cautious interpretation of the Granger causality analysis [38]. Traditional correlation and coherence analyses cannot reveal sparse, package-like increases in the synchrony of discrete frequency bands, especially if they are lagging. This is because the asynchronous, uncorrelated majority of the signals hide it. To overcome this bottleneck, we employed a time and fre- quency—resolved cross-coherence estimation. This is particularly sensitive to lagging, inter- mittent changes in synchrony, such as “bursty” transmissions (S8 Fig). Using this method, we found that there are transient oscillations in the mid-gamma band that appear coherently in both V2 and the CPu with a constant time lag (V2 leading with approximately 30 ms,Fig 7D).
A similar but less coherent delayed pattern was present between V2 and the motor cortex (recorded above the CPu as control,Fig 7E).
In contrast to the V2–motor cortex coherence, which was similar both during running in the uniform and the striped mazes (correlation index = 0.058±0.004 and 0.054±0.006, respectively, for the uniform and striped conditions;p= 0.37;N= 64 recording-site pairs), the V2 coherence with the CPu became significantly weaker when the striped pattern was present (correlation index = 0.11±0.004 and 0.07±0.003, respectively, for the uniform and striped conditions;p<0.001;N= 96 location pairs,Fig 7F). To confirm if the decreased gamma band coherence also has an effect in shaping the striatal unit activity, we tested the LFP phase cou- pling of the striatal spike trains of the aVis+ neurons. The strength of the phase coupling to local LFP was identical in the uniform and the striped conditions. In contrast (as predicted by
the LFP coherence analysis), coupling to the distal V2 LFP was decreased in the beta and low- gamma bands when the animal was running in the striped environment (Fig 7G). These find- ings suggest the presence of a population-level communication “channel” between V2 and the dorsomedial CPu, which is influenced by the visual environment.
Fig 7. Activity coupling between V2 and the CPu. (A) Experimental schematics showing the simultaneous recording of the LFPs and SUA in both the V2 and the dorsomedial CPu. (B) Mean raw spectra of the V2 (left) and CPu (right) are almost identical when the animals are running in both the uniformly gray (blue lines) and the striped (red) environments (mean power spectra ofN= 30 and 175 LFP sessions, respectively). The only significant difference was detected in the high-gamma band of the V2 (red horizontal lines). (C) V2 LFP Granger causes striatal LFP oscillations both in the broadband (left panel, blue) and low-gamma filtered signals (left panel, yellow). Note the significant decrease of the causality strength in the striped environment compared to the uniform trials.
Right panel denotes the results of the causality analysis in the striato-cortical direction. (D) Average time and frequency—resolved coherence maps across all sessions and animals for trials in the uniform (left) and striped (right) environments. Note the presence of the high-coherence domain between 40 and 50 Hz with a temporal lag of 20–40 ms (V2 leading). (E) Same as in (D) when comparing V2 LFP with the LFP of the mCtx serving as a control. (F) Comparison of the maximal coherence values between 40–55 Hz and 5–50 ms (marked by a dashed white box on (D)). The left and right panels respectively compare the coherences of the mCtx versus V2 and CPu versus V2 during running in both striped and uniform environments. (G) Phase coupling of aVis+ CPu neurons to various frequency bands of the V2 (left) and the striatal (right) LFP during uniform (blue) and striped (red) trials. Note the stripedness- induced decoupling of the aVis+ cells from the V2 beta and low-gamma bands. aVis, active visual cortex; CPu, caudate putamen;
LFP, local field potential; mCtx, motor cortex; SUA, single-unit activity; V2, secondary visual cortex.
https://doi.org/10.1371/journal.pbio.2004712.g007
Discussion
We found a small, distinct group of the dorsomedial striatal neurons that are responsive to both self-motion-independent (passive) and self-motion-congruent (active) visual stimuli (pVis+ neurons). In addition, there is a larger subset of striatal cells that only sense visual motion, when congruent locomotion is simultaneously present (aVis+ neurons). These find- ings emphasize the importance of investigating visual motion—related sensory processing in freely moving animals instead of anesthetized or head-fixed preparations [9,22,39]. The per- ceptual capacity represented by these two cell groups may support survival. They allow for the recognition of incongruently moving objects (such as prey). At the same time, due to the self- motion of the observer, they also provide reafferentation about the continuously changing visual environment. Even though the two functional groups we identified in this study shared many electrophysiological properties, our results suggest that pVis+ neurons were overwhelm- ingly FFNs.
Identification of striatal cell types from extracellular recordings
Despite their extensive interconnections, the CPu has a very distinct cytoarchitecture from the cortex. The internal circuitry of the CPu is shaped almost exclusively by GABAergic inhibitory neurons, plus a few cholinergic neuromodulator cells. Of these GABAergic cells, 95% are medium spiny neurons forming the functional class of PFNs, while the cholinergic cells are acting as TFNs [40]. The remaining 5% of aspiny GABAergic cells were recently described as a mixture of at least eight morphologically, neurochemically, and electrophysiologically different classes of cells [41–43]. The FFN neurons in this study are most likely PV+, fast-spiking inter- neurons [27,43,44]. However, the functional classification of the CPu neurons can only puta- tively and cautiously be matched to the known neurochemical classes. We were able to isolate significantly fewer PFNs and more FFNs (similar to Thorn and Graybiel [45]), as was expected from the results of histological studies with unbiased sampling. PFNs are particularly sparsely firing neurons. Thus, they are the most vulnerable to forced exclusion due to numerical approximation issues or accidentally skipped detection.
Immediate early gene (IEG) expression in the CPu by visual stimuli
Immunohistochemistry allows for the exact identification of the histochemical cell types in the CPu. However, conclusions about their visual responsivity based on their cFos expression alone should be interpreted with caution. Although the CPu is known to express IEGs in response to cortical stimulation [46], they are not uniformly expressed among different cell types [47]. They can only report increases of FRs reliably [47]. Lastly, it is not possible to distin- guish between mono- and polysynaptic activation. We chose to detect cFos over JunB, FosB, or other IEGs for two reasons: first because of its very low constitutive expression in the CPu and second because it is expressed by most cell lines upon stimulation [46]. pVis+ neurons were inhibited by visual motion, which cannot explain the induced cFos expression. We specu- late that it was either induced by the blinking light or the stationary grating parts of the stimu- lation sequence (i.e., more than half of the pVis+ neurons were excited by the change of brightness, and they were also typically excited by the stationary gratings). An alternative explanation is that these neurons were activated through a disinhibition, as the pVis+ neurons were mainly FFNs, but the cFos+ cells were PV−. In this latter case, the cFos+ cells could be mainly medium spiny neurons, which are known to receive inhibitory innervation from the FFNs (putative PV+ fast-spiking interneurons [43]).
Origin and processing of the visual information in the dorsomedial striatum
Hunnicutt and colleagues [31] reported that neurons of the dorsomedial part of the mouse striatum respond to multiple sensory modalities and that they integrate auditory and visual inputs with emotional and contextual information. The exact drivers of the visual features of the CPu are not clear. We found that aVis+ neurons were sensitive to global (but not local) luminance changes. This finding is in agreement with earlier reports on the large receptive fields of striatal cells spanning almost the whole visual field in cats [29]. These results suggest that the striatum receives a preprocessed “global percept” of the visual environment, instead of a partial pixelated representation.
The cortical discrimination of self-motion-induced visual motion and object motion is gen- erally linked to higher-order visual areas along the dorsal stream of the visual cortex, such as the middle temporal and dorsal medial superior temporal area [39,48,49]. V6 also seems to be able to subtract self-motion-induced dislocations from the visual percept to enhance object motion detectability [48,50]. However, earlier stages of the visual pathway (including V1) can already detect visual motion [51], process features of the motion [52], and even integrate visual motion and locomotion percepts [53]. Upstream stages (such as V2 or V3) inherit these capac- ities [54] and can serve as a common source for motion-related information to both V5 and V6 pathways [48]. The anterolateral part of area 18a (the lateral extrastriate cortex) of the mouse (which is the homologue of the lateral secondary visual cortex [V2L] and mediolateral secondary visual cortex [V2ML] in the rat [55]) is also linked to the processing of self-motion cues [56]. These V2 neurons prefer lower spatial frequencies compared to V1 and have rela- tively large receptive fields [54].
Visual motion—sensitive CPu neurons have similar preferences. An earlier report [9]
found that caudate nucleus neurons of the cat prefer similar low spatial and high temporal fre- quencies to what we report here regarding the pVis+ neurons of rats. A direct connection between the visual cortex and dorsocaudal striatum was also confirmed by a few tracing stud- ies in rats and monkeys [20,23,57]. The inhibition of the FFNs by the visual motion in this study suggests an indirect cortical effect through other striatal interneurons (signal inversion).
However, this contradicts the direct electrical excitability of the pVis+ neurons. An alternative explanation may be provided by the already negative coding scheme of the corticostriatal affer- ents from the complex neurons of the V1 [58–60] or, for example, the so-called D cells of the feline extrastriate cortex. These neurons maintain high spontaneous FRs that are decreased when visual motion is perceived [61]. Such decrease in the cortical drive may explain the motion-induced decrease of spiking in the pVis+ neurons, as well as the monosynaptic cortical entrainment that we report here.
Our findings regarding the selective cortical excitability of the pVis+ (but not the aVis+
cells) and their different intrastriatal distribution offer the idea of multiple parallel visual streams as drivers. However, our results only partially support this concept. The more ventral and lateral parts of the dorsomedial CPu (where the aVis+ neurons are also located) did not receive direct V2 input, but the similar response profile in the striped maze indicates that the pVis+ neurons are more likely to be a subtype of the aVis+ group. Nevertheless, as one candi- date for the alternative innervation, the lateral-posteromedial nucleus of the thalamus projects to the same striatal and cortical subregions we investigated here [62,63]. This thalamic region may play an important supplemental role in the visual representation of context [64]. How- ever, its effect on the CPu is not yet known. An alternative candidate is the retina—superior colliculus—intralaminar thalamus—CPu pathway [65–67], which converges with tectonigral dopaminergic signals to enhance the detection of unpredictable salient signals [68].
Together, the electrical excitability of pVis+ neurons from the V2 and the corticostriatal gamma band coherence modulated by the visual percept during self-motion suggest a corti- cal origin for some aspects of the striatal visual information. However, the lack of electrical excitability of aVis+ neurons also predicts the presence of a complementary subcortical input.
The significance of the visual information processing in the striatum has been shown both in visuomotor associations [69,70] and oculomotor functions [8,71]. The exact role of the various striatal aspects of the visual information in shaping the behavior is less clear because studies perturbing selective visual inputs of the striatum are missing. Striatal responses to non- moving visual stimuli (mainly flashes and other static stimuli) have been unambiguously described in multiple species [7,14,72,73]. However, visual motion is applied mostly in relation to a guided oculomotor or choice task, whose protocols cannot differentiate if CPu neurons respond to the pure visual features of the motion or the abstract, task-associated meaning of the “cue.” The latter explanation is more likely, as responses were reported to enhance over tri- als of associative learning [74].
Several studies have made attempts to estimate the visual motion—related sensitivity of the striatum [9,10,29]. However, none of them have been performed during natural self-motion.
Further experiments are needed to understand the role of striatal representations of the pas- sively observed and self-motion-congruent visual motion percepts in neuronal computations and behavior. Speculatively (as projections of the intralaminar thalamic nuclei converge with visual cortical inputs at the striatum), it is possible that one role of this system is to map the external reflections of self-behavior with salient environmental changes during reinforcement learning [73,75]. In addition to the sensory and motor information, the integration of complex representations such as space, memory, reward, and motivations [76] can serve as a high-util- ity support to a system like that.
Multimodal integration in the dorsomedial striatum—Processing nonsensory modalities
Despite the remarkable topographic organization of the striatal afferentations, their functional- ity is not strictly separated by sharp borders but rather form overlapping gradients [77]. The dorsal part is considered to be an associative zone serving multisensory integration [45]. This segment of the CPu receives a broad repertoire of sensory modalities [7], contextual cues [33], and kinetic and positional information [78], as well as other sources reflecting the internal dynamics of the brain [7,79].
As the animals were running in the linear track, we found a substantial number of neurons possessing place field—like activity [32–34,80,81]. A few of them showed theta phase preces- sion as well [82]. Despite their singular “place fields,” the recorded CPu neurons were relatively weak space coders. Their selectivity and sparsity were approximately half and twice as large, respectively, as what we measured earlier in the case of CA1 place cells [35]. These features may be a projection of the hippocampal activity and not a purely de novo—generated feature, since in an earlier study, they have been found to be more strongly coupled to the hippocampal theta phases than to striatal theta [82]. Nonetheless, besides its possible volume-conducted component, striatal theta is also modulated, for example, by reward signals to some extent [82]. In the case of many neurons, the experimental approach of the current study could not reliably differentiate if the recorded spatial firing pattern was purely related to a coding of the location or if it was also shaped by a reward prediction as the animal was approaching the water ports [83]. The place fields were conserved in both running directions in the maze.
Thus, the head direction activity of the striatum [80] might not play a key role in forming
these place fields, although we did not investigate the head direction—related patterns in this study.
Besides the spatial information, striatal neurons are also capable of coding various behav- iorally relevant environmental contexts [4,40]. To avoid any associations of valence or other behavioral meaning to the “stripedness” of the maze, we designed our aVis stimulation experi- ment to employ a model-free reinforcement-learning paradigm [84]. The activity of the aVis+
neurons was only partially modulated by the visual stimuli in a similar way to rate remapping [85,86] (i.e., the presence of the striped pattern did not alter the spatial location of the place fields but could modulate the intraplace field FRs [36,37]). This rate modulation was stronger at high temporal frequencies of the perceived visual motion (i.e., at faster running speeds), similarly to the spatiotemporal tuning of the pVis+ neurons in the pVis experiment. Moreover, we found no difference in the FRs of the aVis+ neurons while the animals were not running and were observing the same but steady patterns. The identical running velocities and trajecto- ries in the two conditions ruled out further that the FR difference between the two conditions was induced by the different motor (i.e., locomotion) patterns. Our additional argument against the contextual but not visual motion modulation of the aVis neurons in the linear maze is that the appearance of the motion of identical striped patterns in the pVis environment did not alter the activity of the aVis+ neurons. These observations suggest that the animals did not consider the two conditions as two independent contexts and highlight the integrative nature of the neuronal activity in the striatum.
Traditionally, the hippocampus and the striatum were considered as two independent but complementary memory systems, respectively responsible for episodic and procedural mem- ory [87]. An alternative concept is that the CPu should be better considered as an integrator that has the chance to adjust procedural motor functions based on the internal representations of “past experiences” (i.e., through hippocampal episodic and spatial memory [5]) and the
“present circumstances” (i.e., through the contribution of sensory systems). Our finding regarding the coexistence and simultaneous, conjunctive expression of sensory-related and contextual/spatial (e.g., hippocampal) features in the CPu may support this latter concept.
Network oscillations in the dorsomedial striatum
During their striatal integration, the proper timing of the converging inputs of various modali- ties is orchestrated by local and global oscillations. The origin and significance of the various LFP oscillations in the CPu are unclear due to the lack of any ordered geometrical alignment of the striatal neurons [88–90]. LFP oscillations can be (1) locally generated by the local rever- berating excitatory—inhibitory connections, (2) passively and instantaneously volume-con- ducted to the site of observation, or (3) evoked locally, driven by rhythmic inputs from distal structures when the local neuronal activity resembles the original oscillation with a synaptic delay. In this third case, the current source density analysis of structures with unordered neu- rons (e.g., the striatum) will not reveal any characteristic source and sink patterns. Still, as most extracellular recordings in intact animals are referenced to a distal “electroneutral” loca- tion (e.g., the cerebellum), even the randomly arranged striatal neurons can give rise to large- amplitude LFP oscillations. This is because they rhythmically sink and release ionic charges from the extracellular space during their synchronized discharges [91,92]. In the striatum, all three ways most likely contribute to the generation of LFP oscillations.
Although theta phase coupling is present in a good number of striatal neurons, in vitro studies have not revealed any cellular properties that may support the local generation of the theta rhythms [93]. Since phase precession is more constrained to hippocampal theta than to the local rhythm [82], it is likely that the CPu only resembles the theta-modulated activity
from the hippocampus or connected structures (e.g., prefrontal cortex [94,95]). Similarly, delta oscillations are imposed by corticostriatal neurons driving striatal interneurons and medium spiny neurons [44,96]. However, beta band oscillation can be generated by the CPu on its own through the interplay between PV+ fast-spiking interneurons and medium spiny neurons under the control of dopamine neuromodulation [97].
The picture is not so clear in the case of gamma oscillations. Van der Meer and colleagues [77] found that at least part of the ventral striatal gamma activity is locally generated. However, the CPu network lacks the necessary inhibitory—excitatory loop that could generate these rhythms alone [98,99]. Along these lines, it is likely that rhythmicity is generated elsewhere (e.g., the hippocampal formation, the piriform, or the visual cortex) and that the striatal neu- rons only resonate with these inputs [88,89]. However, the synchronized, sudden switches between 50 and 80 Hz gamma rhythms along the whole extent of the ventral striatum also sug- gest the presence of some coherent internal mechanisms [83].
The distal and local generation of the respective lower- and higher-frequency oscillations is reinforced by the observation that the activation of TFNs selectively increases the power of both the beta and gamma bands but not the lower-frequency bands [97]. We strongly hypothe- size that the LFP oscillations of the dorsal striatum are at least partially generated by the coor- dinated discharges of the striatal neurons that are governed by their distal inputs (including the visual cortex). This idea is supported by the lagging gamma band coherence of the striatal and V2 LFP oscillations, as well as the differential phase locking of the recorded neurons to local and distal gamma oscillations.
The possible role of the corticostriatal LFP oscillations
We found that the neurons of V2 express oscillations in the low- and mid-gamma band. Such patterns also appear in the CPu with approximately 20–30 ms delay (called gamma-50 by van der Meer and Redish [83]). We interpret this delay as a sign of information transfer between the visual cortex and the striatum. This delayed synchrony is not present at other frequency bands (except for the theta band), and it quickly decays, even if the signals are further shifted with an integer number of cycles. This suggests that the detected events are discrete packages of a few gamma cycles but not a persistent gamma oscillation (seeS8 Figfor interpretation).
The lag of these gamma epochs is in agreement with the latency of the striatal excitatory post- synaptic potentials (EPSPs) compared to the V1-evoked potentials after visual stimulation, as reported by Reig and Silberberg [7]. We assume that these striatal gamma events are likely to be generated by the evoked gamma frequency bursts of PV+ fast-spiking interneurons [100], since similar PV+ interneurons are responsible for gamma oscillations in the hippocampus and cortex [101]. This hypothesis is compatible with our finding that the majority of pVis+
neurons are FFNs, underpinning that their modulation through sensory inputs may have an effect on the generated gamma events. We found that visual stimulation decreases the FR of the FFNs and presumably their cortical afferents as well. Thus, we assume that this decreased cortical “constrain” is the cause of the weaker gamma coherence in the striped maze.
Coherent LFP oscillations serve as “semaphores” for interactions between many circuits of the brain and are efficient filters for information transfer [102]. The detected oscillatory delay of the mid-gamma band matches the delay of the monosynaptic responses recorded in our electrical stimulation experiment. It is therefore possible that its purpose is to offer highly excit- able time slots when the CPu neurons become more sensitive to cortical information. It is doubtful whether these gamma patterns are related only to the visual cortical interactions or that multiple inputs are converging to the CPu during these short temporal windows, given that the importance of the striatal gamma patterns has already been shown in signal response—
association tasks [103]. On the other hand, the weak theta phase coupling of the pVis+ neurons reflects their relatively steady responsivity. This is a prerequisite for the reliable quick recogni- tion of moving objects at any moment. Further experiments are needed to gain evidence to ver- ify these hypotheses.
Differential innervation conclusively distinguishes pVis+ cells from the larger pool of per- ceptors detecting visual dislocations induced by self-motion (i.e., aVis+ neurons) and estab- lishes them as a separate functional group. We propose that the aVis+ neurons may provide robust feedback on the dislocation of the gait caused by the movements of the animal. In addi- tion, successive comparison of the activity of aVis+ and pVis+ neurons can extract the pres- ence of independently moving third-party objects such as prey or predators in a nonstationary (but otherwise neutral) visual environment. This process may be important in detecting self- independent moving objects and for selecting the appropriate action to challenge them. More- over, the aVis+ and pVis+ neurons also integrate spatial (and possibly contextual and kinetic) modalities. They are modulated by visual motion co-occurring with self-motion whose fea- tures may have a utility in sensorimotor integration while performing the chosen action.
Further experiments may confirm these hypotheses by revealing the origin of the visual infor- mation that drives the aVis+ neurons and testing the behavioral consequence of the selective manipulation of these two pathways. Optogenetic silencing of the specific axon terminals in the dorsomedial CPu may be a good approach to achieve this in the future.
Materials and methods Ethics statement
All experiments were approved by the Ethical Committee for Animal Research at the Albert Szent-Gyo¨rgyi Medical and Pharmaceutical Center of the University of Szeged (No. XIV/218/
2016 and XIV/471/2012). Thirty-two male rats (Long-Evans, 3–12 mo old) were used in this study.
Awake electrophysiological experiments
Surgery and recordings. Electrode fabrication and implantation surgery were described in details earlier [26,104]. Briefly, animals were anesthetized with isoflurane, and 1 or several craniotomies were performed under stereotaxic guidance. Sixty-four channel silicon probes (NeuroNexus, Ann-Arbor) were implanted in the dorsomedial striatum. In 2 animals, an addi- tional 32 channel silicon probe was implanted in the visual cortex of the same hemisphere. In 2 other animals, a bipolar stimulation electrode made of two 50μm thick parylene-insulated tungsten wires was implanted in the visual cortex (AP 4.5 mm posterior from the bregma; ML 2.8 mm; DV 0.5 and 2 mm, 1,500μm distance between the tips of the wires, 500μm uninsu- lated part at each tip). Silicon probes were mounted on custom-made micro-drives to allow their precise vertical movement after implantation. The probes were inserted above the target region, and the micro-drives were attached to the skull with dental cement. The craniotomies were sealed with sterile silicone. Two stainless steel screws were drilled bilaterally over the cer- ebellum, serving as ground and reference for the recordings. Several additional screws were driven into the skull and covered with dental cement to strengthen the implant. Finally, a cop- per mesh was attached to the skull with dental cement and connected to the ground screw to act as a Faraday cage, preventing the contamination of the recordings by environmental elec- tric noise. After postsurgery recovery, the probes were moved gradually in 75 to 150μm steps per day until the desired position was reached [104]. The CPu was identified physiologically by increased unit activity. The exact electrode locations were identified post hoc from histological sections.