Cross-Lingual Detection of Mild Cognitive Impairment Based On Temporal Parameters of Spontaneous Speech
G´abor Gosztolyaa,b,, R´eka Baloghc, N´ora Imrec, Jos´e Vicente Egas-L´opezb, Ildik´o Hoffmannd,e, Veronika Vinczea,b, L´aszl´o T´othb,, Davangere P. Devanandf,g, Magdolna P´ak´askic, J´anos K´alm´anc
aMTA-SZTE Research Group on Artificial Intelligence, Szeged, Hungary
bUniversity of Szeged, Institute of Informatics, Szeged, Hungary
cUniversity of Szeged, Department of Psychiatry, Szeged, Hungary
dUniversity of Szeged, Department of Linguistics, Szeged, Hungary
eResearch Institute for Linguistics, Budapest, Hungary
fColumbia University Medical Center, Department of Psychiatry, New York, NY
gNew York State Psychiatric Institute, Division of Geriatric Psychiatry, New York, NY
Abstract
Mild Cognitive Impairment (MCI) is a heterogeneous clinical syndrome, often considered as the prodromal stage of dementia. It is characterized by the subtle deterioration of cognitive functions, including memory, executive functions and language. Mainly due to the tenuous nature of these impairments, a high percentage of MCI cases remain unde- tected. There is evidence that language changes in MCI are present even before the manifestation of other distinctive cognitive symptoms, which offers a chance for early recognition. A cheap non-invasive way of early screening could be the use of automatic speech analysis. Earlier, our research team developed a set of speech temporal parameters, and demonstrated its applicability for MCI detection. For the automatic extraction of these attributes, a Hungarian- language ASR system was employed to match the native language of the MCI and healthy control (HC) subjects. In practical applications, however, it would be convenient to use exactly the same tool, regardless of the language spoken by the subjects. In this study we show that our temporal parameter set, consisting of articulation rate, speech tempo and various other attributes describing the hesitation of the subject, can indeed be reliably extracted regardless of the language of the ASR system used. For this purpose, we performed experiments both on English-speaking and on Hungarian-speaking MCI patients and healthy control subjects, using English and Hungarian ASR systems in both cases. Our experimental results indicate that the language on which the ASR system was trained only slightly af- fects the MCI classification performance, because we got quite similar scores (67-92%) as we did in the monolingual cases (67-92% as well). As our last investigation, we compared the proposed attribute values for the same utterances, utilizing both the English and the Hungarian ASR models. We found that the articulation rate and speech tempo values calculated based on the two ASR models were highly correlated, and so were the attributes corresponding to silent pauses; however, noticeable differences were found regarding the filled pauses (still, these attributes remained indicative for both languages). Our further analysis revealed that this is probably due to a difference regarding the annotation of the English and the Hungarian ASR training utterances.
Keywords: Mild Cognitive Impairment, dementia, temporal speech parameters, Automatic Speech Recognition, cross-linguality
∗Corresponding author
∗∗G´abor Gosztolya was supported by the National Research, Development and Innovation Office of Hungary via contract NKFIH FK-124413 G´abor Gosztolya and L´aszl´o T ´oth were supported by the J´anos Bolyai Research Scholarship of the Hungarian Academy of Sciences G´abor Gosztolya was also supported by the ´UNKP-20-5 New National Excellence Program by the Hungarian Ministry of Innovation and Technology.
This study was partially funded by the Ministry for Innovation and Technology, Hungary (grant TUDFO/47138-1/2019-ITM).
1. Introduction
Dementia is a chronic or progressive clinical syndrome, affecting mainly elderly people worldwide. It is character- ized by the deterioration of memory, language and problem-solving skills, which are severe enough to adversely affect the patients’ ability to carry out everyday activities (Alzheimer’s Association, 2020). According to the estimates, the number of affected individuals, which at present exceeds 46.8 million, may double by 2050 (Prince et al., 2015).
5
Since the currently available therapeutic agents are shown to be more effective in the earliest or preclinical stages of dementia (Szatl´oczki et al., 2015), recognizing the disease in the earliest phase is of utmost importance.
The most widely used term to describe the preclinical stage of dementia is Mild Cognitive Impairment (MCI), which condition is often considered to be the borderline between normal aging and dementia (Petersen et al., 2014).
This syndrome shows similar characteristics to dementia, although in the case of MCI the symptoms do not interfere
10
with the patients’ activity of daily living (Foster et al., 2019). However, given its high conversion rate to dementia (2- 31% annually, see e.g. Bruscoli and Lovestone, 2004), MCI should be regarded as a severe condition. As the transition phase from MCI to dementia can last even 15 years (Laske et al., 2015), there is a wide time window in which the subtle signs of cognitive decline could be detected. Since the timely identification of MCI could provide more effective therapeutic interventions to delay progression, the importance of developing methods that allow early recognition has
15
been emphasized in the recent years.
It has been shown that changes in language production are associated with subclinical declines in memory, e.g.
the fluency of spontaneous speech has been proven to deteriorate in people with early MCI (Mueller et al., 2018).
During the course of the disease, filled pauses (i.e. vocalizations like ‘uhm’ and ‘er’) and disfluencies become more and more frequent in the speech (de Ipi˜na et al., 2018), corresponding to the word-finding or word-retrieval difficulties
20
of patients (Szatl´oczki et al., 2015). Earlier studies also indicated that compared to healthy controls, MCI patients tend to have lower speech rate, and an increased number and length of hesitations (Szatl´oczki et al., 2015). The above-mentioned characteristics can strongly influence the overall time course of the speech; therefore, the analysis of such temporal aspects can help us explore the relationships between language and memory.
Since collecting speech samples is a quick, non-invasive, cheap and relatively easy way of gathering data and as it
25
minimizes the burden of the examination for the patients, the analysis of speech is a promising method for early MCI screening. There are several established methods for obtaining speech samples from participants. On the one hand, structured speech samples can be obtained by applying spoken tasks e.g. reading, counting backwards or sentence repeating (K¨onig et al., 2018; Fraser et al., 2019). On the other hand, unstructured or spontaneous speech samples can be collected, which seems to be a reliable source for language analysis as well. Spontaneous speech can be elicited
30
by using narrative recall tasks (e.g. picture description tasks) or by asking the participants to talk about a given topic (e.g. their hobbies, or their previous day). According to some results, the latter type might be more sensitive when discriminating between HC and MCI subjects (Beltrami et al., 2018).
In the last decade, numerous attempts have been made to distinguish cognitively healthy control (HC) subjects from people with MCI or with Alzheimer’s disease (AD) using different speech analysis techniques. In the ear-
35
lier studies, analyzed speech features were extracted mainly from manually transcribed data, which is rather labor- intensive. In more recent studies the goal was to find out whether extraction by automated techniques could produce similar results. In the past few years, several such automatic speech analysis studies have been published (e.g. K¨onig et al., 2015; Laske et al., 2015; de Ipi˜na et al., 2018; K¨onig et al., 2018; Themistocleous et al., 2018; T´oth et al., 2018;
Fraser et al., 2019; Gosztolya et al., 2019; Sluis et al., 2020; Themistocleous et al., 2020).
40
In the previous studies conducted by our team, we developed a set of temporal parameters that characterize hesi- tation in the spontaneous speech of the subjects (T´oth et al., 2015; Gosztolya et al., 2016; T´oth et al., 2018; Gosztolya et al., 2019). Hesitation is defined as an absence of speech, and it can be divided into two categories: silent pauses and filled pauses; while measuring the amount of silent pauses in human speech is quite common (see e.g. Mattys et al., 2005; Fraser et al., 2013; Igras-Cybulska et al., 2016; Al-Ghazali and Alrefaee, 2019; Sluis et al., 2020), our
45
temporal attribute set also expressed the amount offilledpauses in the speech of the subject. We also experimentally demonstrated that these temporal parameters can readily be used as features in a subsequent machine learning step (e.g. classification by using Support Vector Machines (SVM, Sch¨olkopf et al., 2001)). Furthermore, although in our initial studies we calculated these temporal attributes during a manual annotation process, later we demonstrated that they can efficiently be calculated by using speech processing tools, i.e. by relying on a phone-level Automatic Speech
50
Recognition (ASR) framework.
In these studies, however, we performed our experiments in a monolingual environment. That is, both the healthy control subjects and those suffering from mild cognitive impairment were native Hungarian speakers, and the ASR tool we employed to process their speech was also a Hungarian one (i.e. it used a Hungarian phone set, a Hungarian language model and the Deep Neural Network (DNNs, Hinton et al., 2012; T´oth, 2015) used as the acoustic model
55
was trained on Hungarian utterances). Of course, this is quite common in speech processing, and most studies also approach the MCI detection task strictly in a language-dependent manner. For example, Garcia et al. applied i-vectors for detecting Parkinson’s Disease, and they both trained the Universal Background Model (UBM) of the i-vector and extracted the i-vector features on a Spanish language corpus (Garc´ıa et al., 2018). Similarly, other studies use spontaneous spoken utterances in English language to predict MCI by means of linguistic features (Asgari et al., 2017;
60
Fritsch et al., 2019), while Themistocleous et al. carried out the identification of MCI from the speech of Swedish subjects by means of Deep Sequential Neural Networks trained on a Swedish corpus (Themistocleous et al., 2018).
While training the applied tools on data of the same language as the speech of the MCI and HC subjects might be well founded for some types of attributes, in other cases one might expect language-independence (at least to some extent), therefore this monolingual restriction might be obsolete. For example, i-vectors (Dehak et al., 2011) are
65
quite general models developed for speaker segmentation and verification, and as such, they are probably practically language-independent. Similarly, x-vectors (Snyder et al., 2018) (which can be viewed as a deep learning-based improvement over i-vectors) could also be expected to work over different languages, regardless of the language of the utterances used for training the model.
From our set of temporal parameters, silent pauses can be expected to be detectable in a language-independent
70
manner. However, the language-independence of filled pauses is not that straightforward; for example, de Leeuw found that the frequency of vocalic and vocalic-nasal hesitation markers significantly differed among Dutch, English and German speakers (de Leeuw, 2007). Nevertheless, recently several studies presented successful cross-lingual machine learning experiments in filler detection (e.g. Brueckner et al., 2017; Vetter et al., 2019), which suggests that our attribute set could also be calculated language-independently. Our attribute set contains temporal parameters
75
describing the speech rate of the speaker as well, expressed as the uttered phones per second. Obviously, trying to fit phones of a different language to the given utterance will change the values of such measurements; still, one might expect that these can tolerate some phonetic-level misidentifications, and using an ASR system trained on a different language might only introduce slight changes in the calculated values, which makes the attributes just as indicative as they are in the monolingual case. Our hypothesis is that attribute sets like the one proposed in our previous works (e.g.
80
in Gosztolya et al., 2019) might permit MCI detection with a similar performance when the ASR tool used for feature extraction is trained on a different language.
In this study, we experimentally investigate the language independence of the hesitation-based set of temporal speech parameters. For this, we collected the spontaneous speech of English-speaking and Hungarian-speaking MCI patients and healthy controls. Then we trained two ASR models for the automatic speech analysis step: for English,
85
we used a subset of the TEDLium corpus (Rousseau et al., 2012), while for Hungarian we used a subset of the BEA Hungarian Spoken Language Database (Neuberger et al., 2014). We carried out classification experiments to deter- mine the indicativeness of the different attributes. We performed both monolingual and cross-lingual experiments;
furthermore, we examined the similarity of the temporal parameters calculated by the two ASR systems.
The structure of this paper is as follows. In Section 2, we describe the two MCI databases we used in our
90
experiments. Then, in Section 3, we describe the acoustic markers we extracted from the spontaneous speech of the subjects. Next, in Section 4, we present the experimental setup of subject classification: the classification method used, the way of setting the meta-parameters, and the means of evaluation. Then we present and compare our monolingual (Section 5) and cross-lingual (Section 6) results. Lastly, in Section 7, we compare the attributes extracted by the two approaches.
95
2. The MCI-HC Recordings
A total of 88 elderly individuals were recruited in parallel from two outpatient clinics. The two institutions were:
• Memory Disorders Center of the Department of Psychiatry, New York State Psychiatric Institute and Columbia University (New York, NY, USA), and
• Memory Clinic, Department of Psychiatry, University of Szeged (Szeged, Hungary).
100
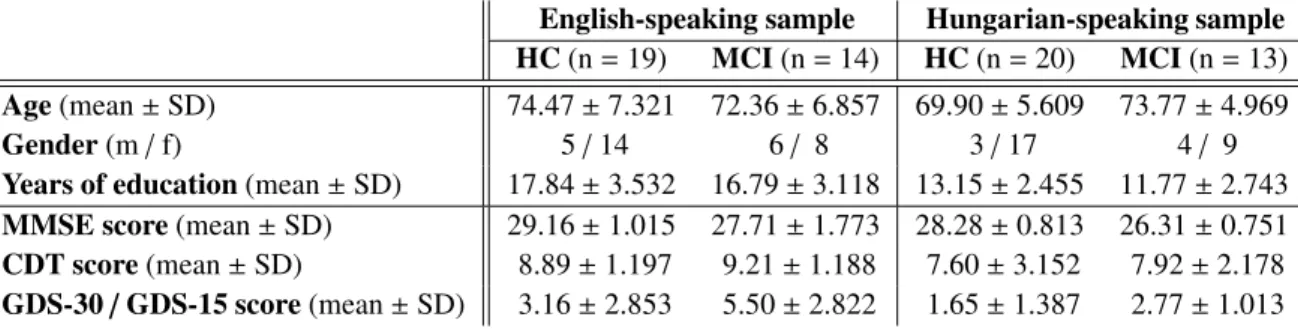
Table 1: Demographic characteristics (i.e. age, gender and years of education) and the results of the neurophysiological tests (MMSE, CDT and GDS) tests of the subject groups
English-speaking sample Hungarian-speaking sample HC(n=19) MCI(n=14) HC(n=20) MCI(n=13) Age(mean±SD) 74.47±7.321 72.36±6.857 69.90±5.609 73.77±4.969
Gender(m/f) 5/14 6/ 8 3/17 4/ 9
Years of education(mean±SD) 17.84±3.532 16.79±3.118 13.15±2.455 11.77±2.743 MMSE score(mean±SD) 29.16±1.015 27.71±1.773 28.28±0.813 26.31±0.751 CDT score(mean±SD) 8.89±1.197 9.21±1.188 7.60±3.152 7.92±2.178 GDS-30/GDS-15 score(mean±SD) 3.16±2.853 5.50±2.822 1.65±1.387 2.77±1.013
Exclusion criteria included deafness, manifest speech problems (any form of aphasia), significant articulation problems (e.g. stutter), history of substance use disorder, history of stroke, previous CT or MRI showing evidence of significant abnormality that would suggest another potential etiology for MCI or dementia. In the end, a total of 66 subjects were eligible for final inclusion.
Both the English-speaking (n=33, New York, NY, USA) and the Hungarian-speaking (n=33, Szeged, Hungary)
105
participants were diagnosed as MCI or HC. This decision was based on Petersen’s criteria (Petersen et al., 1999) in both language groups, with the Mini-Mental State Examination (MMSE, Folstein et al., 1975) serving as a measure for objective cognitive impairment in the Hungarian-speaking sample (30-28 points: HC; 27-24 points: MCI). In all other aspects, the inclusion/exclusion criteria were the same at both sites. The inclusion criteria were a minimum age of 60 years, a minimum of 8 years of formal education, and English/Hungarian as the native language (corresponding
110
to the country of recruitment). Bilingualism was not taken into account.
To get an overview of the participants’ characteristics and to acquire eligibility data, an interview focused on de- mographic features and medical history was administered, as well as a brief neuropsychological test battery (including the MMSE, the Clock Drawing Test (CDT, Manos and Wu, 1994), and the Geriatric Depression Scale (GDS)). All individuals were screened for possible dementia using the MMSE, and those with a score under 24 were not involved
115
in further participation. Following institutional protocols, the possibility of depression was also evaluated based on the 30-item (Yesavage et al., 1983) or the 15-item (Sheikh and Yesavage, 1986) version of the GDS (GDS-30 and GDS-15, for the English-speaking sample and for the Hungarian-speaking sample, respectively): patients scoring above 10 on GDS-30 or above 5 on GDS-15 were excluded from the study.
The investigation was conducted in accordance with the Declaration of Helsinki. Written informed consent was
120
obtained from all participants at both sites. The part of the study conducted in New York was approved by the Insti- tutional Review Board of the New York State Psychiatric Institute — Columbia University Department of Psychiatry (protocol number: 7611). The part of the study conducted in Szeged was approved by the Regional Human Biomedical Research Ethics Committee of the University of Szeged, Hungary (reference number: 231/2017-SZTE).
2.1. Demographics and Neuropsychological Test Performances
125
Detailed demographic characteristics and neuropsychological test scores of all groups (means and standard de- viations) are presented in Table 1. Concerning demographics (age, gender, and years of education) and the CDT test, there were no statistically significant differences between the MCI and the HC groups in either of the languages.
However, regarding the other neuropsychological tests, MCI patients achieved a significantly poorer performance in the MMSE than HCs (English-speaking sample:U =62.500;Z =−2.703;p =0.009; Hungarian-speaking sample:
130
U=0.000;Z=−4.879;p<0.001), and they also had higher scores in the GDS in both languages (English-speaking sample:U=71.000;Z =−2.277;p=0.024; Hungarian-speaking sample:U=59.000;Z=−2.736;p=0.008).
2.2. The Recording Protocol
After the clinical evaluation, spontaneous speech samples were obtained from all the participants. During this process, one of the investigators was in the same room as the subject, while a second investigator called the subject on
135
a mobile phone from another room. The first investigator informed the participant that a colleague would call him/her
(1) Articulation ratewas calculated as the number of phones per second during speech (excluding hesita- tions).
(2) Speech tempo(phones per second) was calculated as the number of phones per second divided by the total duration of the utterance.
(3) Duration of utterance, given in seconds.
(4) Pause occurrence ratewas calculated by dividing the number of pause occurrences by the number of phones in the utterance.
(5) Pause duration ratewas calculated by dividing the total duration of pauses by the length of the utterance.
(6) Pause frequencywas calculated by dividing the number of pause occurrences by the length of the utter- ance.
(7) Average pause durationwas calculated by dividing the total duration of pauses by the number of pauses.
Table 2:The examined temporal speech parameters, based on our previous studies (Hoffmann et al., 2017; T ´oth et al., 2018).
and asked the subject to pick up the phone when it rang. Then, the second investigator introduced herself over the phone and asked the participant to talk about his or her previous day (the standardized instruction was: “Hello, I’m . . ., can you hear what I’m saying? I would like you to tell me about your previous day in as much detail as you can.”).
Each participant’s monologue was recorded by a call recorder application installed on the mobile phone device. The
140
recordings obtained were then converted into an uncompressed PCM mono, 16-bitwavformat with a sampling rate of 8,000 Hz. These utterances were further edited to contain only the speech of the subject (i.e. instructions and possible silent parts before/after his/her speech were removed).
3. Extracting Acoustic Markers from Spontaneous Speech
To investigate the spontaneous speech of MCI patients and HC subjects, we calculated specific temporal parame-
145
ters from their spontaneous speech. We based our investigations on our previous studies (T´oth et al., 2015; Gosztolya et al., 2016; Hoffmann et al., 2017; T´oth et al., 2018; Gosztolya et al., 2019). To exploit and formalize the deteriora- tion of the verbal fluency of the MCI subjects, we developed a set of temporal parameters which mostly focus on the amount and duration of hesitation in the speech of the subject.
This set of temporal parameters can be seen in Table 2. The articulation rate and speech tempo (i.e. parameters
150
(1) and (2)) both describe how fast the subject speaks (although in a slightly different manner), while the duration of the utterance (parameter (3)) is related to the amount the subject could remember about his/her previous day.
The remaining parameters ((4)–(7)) all describe the amount of hesitation in the spontaneous speech of the subject by focusing on the number or on the duration of pauses in some way. However, we did not clarify which hesitation types (that is, silent and/or filled pauses) we were using during this calculation. To be able to analyze both pause types, we
155
included temporal parameters (4) to (7) in our set by calculating them for silent pauses only, for filled pauses only, and for taking all pause occurrences into account regardless of type. This led to 3×4=12 variations, hence we calculated 15 temporal parameters overall.
In our experiments we will also use specific subsets of these attributes. By ‘tempo-related attributes’ (or ‘tempo’
for short) we mean articulation rate, speech tempo and the duration of the utterance. By ‘silence-related’, we mean
160
parameters (4) to (7) calculated for the silent pauses only; similarly, ‘filler-related’ and ‘all pause-related’ mean these attributes when calculated for the filled pauses only, and for all pause types, respectively.
Recordings Utterance
Automatic Speech Recognition
Time-aligned phoneme
sequence Temporal
Parameter Calculation
Temporal
parameters Classification (SVM, C4.5, etc.)
Diagnosis hypothesis
Automatic temporal parameter extraction
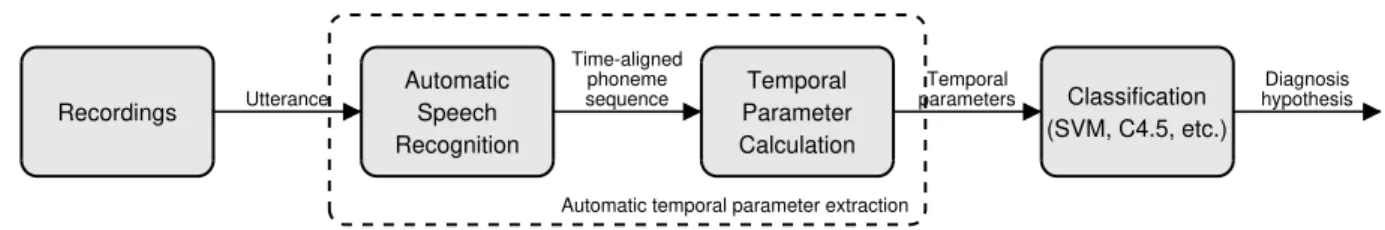
Figure 1:A simplified diagram of the applied subject classification workflow.
3.1. Automatic Acoustic Marker Extraction Using ASR
While in our early studies we calculated the above-listed (or very similar) acoustic markers manually (i.e. using Praat (Boersma, 2001)), this process was actually quite expensive and required skilled labor. Therefore, later we
165
sought to automate this step by using automatic speech processing techniques. Although distinguishing the silent parts and those containing speech can be done in an automated way quite easily (see e.g. Satt et al., 2014), these simple techniques cannot extract all the features of Table 2: most importantly, they cannot distinguish filled pauses from speech. Unfortunately, an off-the-shelf ASR tool (like the one employed by Fraser et al. (Fraser et al., 2013)) may also be suboptimal for several reasons. Firstly, standard speech recognizers are trained to minimize the transcription errors
170
at the word level, while here we seek to extract non-verbal acoustic features like the rate of speech and the duration of silent and filled pauses. Secondly, while the filled pauses do not explicitly appear in the output of a standard ASR system, our feature set specifically requires them to be found. And thirdly, by examining the speech of dementia patients it was observed that the amount of agrammatical sentences and incorrect word inflections increases (Fraser et al., 2014), which in our case also makes a standard ASR tool more prone to errors.
175
However, notice that our speech-related markers listed in Table 2 do not require the correct identification of the phonemes: we only need tocountthem. The only phenomena we need to take special care of are the two forms of hesitation: i.e. silent and filled pauses. Because of this, we decided to use a speech recognizer that just provides a phone sequence as output (including filled pause as a special phonetic label). This allows the automatic extraction of acoustic markers, which can then be employed to perform automatic subject categorization via machine learning
180
techniques. For our simplified workflow, see Figure 1. Of course, recognizing the spontaneous speech of elderly people is known to be difficult (Ramabhadran et al., 2003); and when one attempts to do this without a vocabulary (i.e.
only at the phonetic level), the number of errors can be expected to rise even further. However, as we pointed out, not all types of phone recognition errors harm the extraction of our acoustic markers. In our previous experiments (T´oth et al., 2015; T´oth et al., 2018; Gosztolya et al., 2019) we found that this kind of automatic feature extraction was
185
feasible for distinguishing speakers having MCI from healthy controls.
3.2. ASR Parameters
Due to the bilingual nature of our study, we employed two datasets to train the DNN acoustic models of our two ASR systems (i.e. English and Hungarian). Of course, in both cases we had to employ audio datasets consisting of spontaneous speech, as only spontaneous speech is expected to contain filled pauses. For English, we used the
190
TEDLium dataset (Rousseau et al., 2012); we made use of the utterances of 100 speakers (approximately 15 hours of recordings). For Hungarian, we chose the BEA Database (Neuberger et al., 2014); we trained our DNNs on the speech of 116 subjects (44 hours of recordings overall). We made sure that the annotation suited our needs for both corpora, i.e. filled pauses, breathing sounds, laughter, coughs and gasps were marked in a consistent manner.
The ASR system was trained to recognize the phones in the utterances, where the phone set included the spe-
195
cial non-verbal labels listed above (i.e. filled pauses, coughs, breath intakes etc.). We used a workflow based on HTK (Young et al., 2006); for acoustic modelling we used standard feed-forward Deep Neural Networks. The acous- tic DNNs had an identical structure for both languages: they had 5 hidden layers, each consisting of 1024 ReLU neurons, while we used softmax neurons in the output layer. We used 40 Mel-frequency filter banks along with raw energy as frame-level features, and included the first- and second-order derivatives (i.e.∆and∆∆). To improve model
200
accuracy, we evaluated our model on a sliding window with a width of 15 frames (1845 frame-level features overall).
As a language model, we employed simple phone bigrams (again, including all the above-mentioned non-verbal audio tags); and, of course, these were trained independently on the English data and on the Hungarian data.
4. Subject Classification by Machine Learning
A Support Vector Machine classifier was employed to discriminate the utterances of the subjects. We used the
205
libSVM implementation (Chang and Lin, 2011); we tested both linear and Radial basis function (RBF) kernels. The Ccomplexity parameter was set in the range 10−5,10−4, . . . ,102, while in the case of the RBF kernel,γwas set in the range 2−10,2−9, . . . ,25. The extracted temporal parameter vectors were standardized before using them in the machine learning step. From a machine learning perspective, having fewer than 100 examples (i.e. subjects) is an extremely small dataset. However, the number of diagnosed MCI patients is limited, collecting recordings of their speech and
210
obtaining a medical diagnosis is time-consuming; therefore, in studies similar to ours it is quite common to have fewer than 100 patients (e.g. Satt et al., 2014; Asgari et al., 2017; Themistocleous et al., 2018, 2020; Sluis et al., 2020).
Having so few (i.e. n = 33 for both languages) examples, we did not create separate training and test sets, but opted for speaker-wise cross-validation (CV); that is, we always trained our SVM model on the features extracted from the speech of 32 speakers. In the next step, this machine learning model was evaluated on the remaining speaker.
215
We repeated this for all speakers, and aggregated the results into one final score. To balance class distribution during model training, we employed upsampling by repeating examples (i.e. subjects) belonging to the class with fewer examples; in our case, this was the MCI subject category for both languages.
The meta-parameters of SVM (i.e.Candγ) were determined by a technique callednested cross-validation(Caw- ley and Talbot, 2010). That is, each time we trained on the data of 32 subjects, we performedanother(speaker-wise,
220
i.e. 32-fold) cross-validation session, looking for theC andγ meta-parameter values that led to the highest AUC score. After this, we trained an SVM model with the selected meta-parameters on the data of all 32 speakers, and this model was evaluated on the remaining speaker. This way we ensured that we avoided any form of peeking, which would have created a bias in our scores, had we used standard cross-validation.
4.1. Evaluation
225
The choice of evaluation metric is not a clear-cut issue for this task. Perhaps the most straightforward choice is to use the traditional classification accuracy metric. However, since we have somewhat fewer subjects belonging to the MCI category than healthy controls, it might be beneficial to measure classification performance by other evaluation metrics as well. Therefore we decided to also report the standard Information Retrieval metrics ofprecisionandrecall.
As there is evidently a trade-offbetween these two scores, they are usually aggregated together by theF-measure(or
230
F1-score), which is the harmonic mean of precision and recall. Medical studies tend to reportsensitivityandspecificity instead of the above-listed metrics, sensitivity being equivalent to recall, while specificity is practically the recall of the negative class (in this case, healthy controls). We calculated these values at Equal Error Rate (EER); that is, we chose the decision threshold between the posterior estimates of the two classes (provided by the SVM classifier) in a way which minimizes the absolute difference between the scores sensitivity and specificity (i.e. recall). This technique is
235
quite common in the medical speech processing area (see e.g. Satt et al., 2013; K¨onig et al., 2015; Vaiciukynas et al., 2017; Moro-Vel´azquez et al., 2018; Fritsch et al., 2019).
Furthermore, we also give the area under the ROC curve (AUC) as a metric frequently applied in medical speech processing studies; note that, since we have only two subject categories (i.e. classes), their AUC scores happen to be identical. Lastly, we also employ the evaluation metrics of log-likelihood ratio cost (Cllr) and minimum log-likelihood
240
ratio cost (minCllr), frequently used in forensic studies and in the area of speaker recognition (see e.g. Morrison et al., 2010; Frost and Ishihara, 2015; Nautsch et al., 2019). These values were calculated using the Bosaris toolkit (Br¨ummer and de Villiers). Note that, asCllrand minCllrare cost values, a lower value indicates a more accurate system.
From the list of our applied evaluation metrics, we find AUC and minCllrto be the most important one for two reasons. Firstly, since we have a limited number of subjects, the other metrics can take their values only from a quite
245
limited domain. For example, recall can take only one of 15 and 14 values (since we had 14 and 13 MCI subjects for English and Hungarian, respectively), therefore classifying one further MCI subject correctly leads to an increase of about 7%. In contrast, Area-Under-Curve and minCllr allow us to express classification performance in much finer detail. The second reason is that, during our meta-parameter selection for the Support Vector Machine classifier (i.e. at the inner loop of the nested cross-validation procedure), we maximized the AUC metric, selecting the SVM
250
meta-parametersCandγaccordingly.
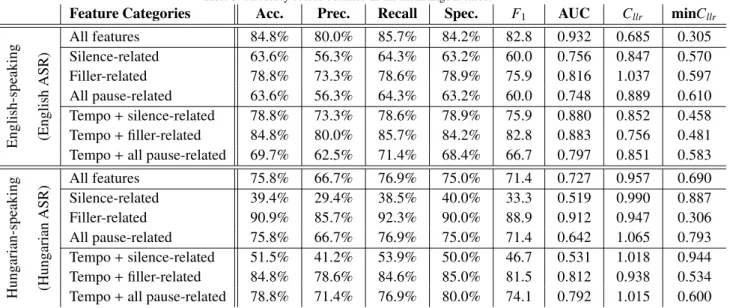
Table 3: Accuracy scores obtained in the monolingual cases.
Feature Categories Acc. Prec. Recall Spec. F1 AUC Cllr minCllr
English-speaking (EnglishASR)
All features 84.8% 80.0% 85.7% 84.2% 82.8 0.932 0.685 0.305
Silence-related 63.6% 56.3% 64.3% 63.2% 60.0 0.756 0.847 0.570
Filler-related 78.8% 73.3% 78.6% 78.9% 75.9 0.816 1.037 0.597
All pause-related 63.6% 56.3% 64.3% 63.2% 60.0 0.748 0.889 0.610
Tempo+silence-related 78.8% 73.3% 78.6% 78.9% 75.9 0.880 0.852 0.458 Tempo+filler-related 84.8% 80.0% 85.7% 84.2% 82.8 0.883 0.756 0.481 Tempo+all pause-related 69.7% 62.5% 71.4% 68.4% 66.7 0.797 0.851 0.583
Hungarian-speaking (HungarianASR) All features 75.8% 66.7% 76.9% 75.0% 71.4 0.727 0.957 0.690
Silence-related 39.4% 29.4% 38.5% 40.0% 33.3 0.519 0.990 0.887
Filler-related 90.9% 85.7% 92.3% 90.0% 88.9 0.912 0.947 0.306
All pause-related 75.8% 66.7% 76.9% 75.0% 71.4 0.642 1.065 0.793
Tempo+silence-related 51.5% 41.2% 53.9% 50.0% 46.7 0.531 1.018 0.944 Tempo+filler-related 84.8% 78.6% 84.6% 85.0% 81.5 0.812 0.938 0.534 Tempo+all pause-related 78.8% 71.4% 76.9% 80.0% 74.1 0.792 1.015 0.600
5. Monolingual Results
First, we present our monolingual results: that is, the classification scores we obtained by extracting the temporal parameters by using English-language ASR for our English-speaking subjects, and by using Hungarian-language ASR for our Hungarian-speaking speakers. The measured evaluation metric values are listed in Table 3.
255
5.1. English-speaking Subjects
Regarding the English-speaking MCI and HC subjects (see the upper half of Table 3), when we calculated our temporal parameters by relying on the English TEDLium corpus, we noticed that the achieved scores were quite high. Besides an accuracy score of 84.8%, the recall/sensitivity and specificity values were also around 85%. With a precision score of 80%, we achieved an F-measure value of 82.8. Furthermore, the AUC and minCllrvalues are
260
also quite good (0.932 and 0.305, respectively), indicating that the temporal parameters described in Table 2 allowed accurate MCI detection in this case.
Examining the scores achieved with only a subset of these parameters (i.e. calculating the indicators (4)-(7) for the silent pauses only, for the filler events only, for both hesitation types, and extending these sets with parameters (1)-(3)), we see that there are several identical values. We think that this is probably due to the fact that we calculated
265
these metric scores at the Equal Error Rate, and that we had a relatively low number of subjects (i.e.n=33). Despite this, we observe significant differences among the different feature subsets in terms of AUC; this is expected, though, because we optimized for the AUC score in the nested cross-validation steps.
Based on the AUC values, using just the filled pause-related attributes led to a slightly better performance than just using the silent pause-related ones or when we did not distinguish between the two hesitation types; on the
270
other hand, the minCllr values were quite similar in the three cases (0.570−0.610). Notice, however, that we got the worst values with the last case, which is quite reasonable, considering that the two hesitation types might have different temporal characteristics (such as average duration): treating them as the same phenomenon might lead to less descriptive temporal parameters, and lead to a lower classification performance.
Interestingly, when we combined these attribute subsets with articulation tempo, speech tempo and utterance
275
duration, silence-related and filler-related attributes produced similar (and similarly high) AUC scores (values 0.880 and 0.883, silent and filled pauses, respectively), and the minCllr values were also quite close (0.458 and 0.481).
However, the other evaluation metrics differed significantly, fillers producing better scores; while not distinguishing the two hesitation types led to the lowest (although still relatively high) metric values. As expected, we achieved the highest scores when we used all 15 temporal parameters.
280
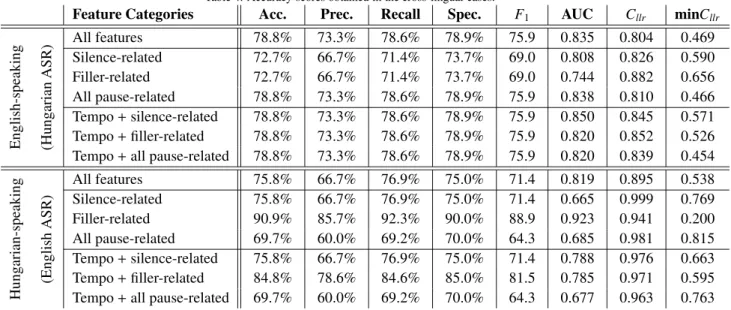
Table 4: Accuracy scores obtained in the cross-lingual cases.
Feature Categories Acc. Prec. Recall Spec. F1 AUC Cllr minCllr
English-speaking (HungarianASR) All features 78.8% 73.3% 78.6% 78.9% 75.9 0.835 0.804 0.469
Silence-related 72.7% 66.7% 71.4% 73.7% 69.0 0.808 0.826 0.590
Filler-related 72.7% 66.7% 71.4% 73.7% 69.0 0.744 0.882 0.656
All pause-related 78.8% 73.3% 78.6% 78.9% 75.9 0.838 0.810 0.466
Tempo+silence-related 78.8% 73.3% 78.6% 78.9% 75.9 0.850 0.845 0.571 Tempo+filler-related 78.8% 73.3% 78.6% 78.9% 75.9 0.820 0.852 0.526 Tempo+all pause-related 78.8% 73.3% 78.6% 78.9% 75.9 0.820 0.839 0.454
Hungarian-speaking (EnglishASR)
All features 75.8% 66.7% 76.9% 75.0% 71.4 0.819 0.895 0.538
Silence-related 75.8% 66.7% 76.9% 75.0% 71.4 0.665 0.999 0.769
Filler-related 90.9% 85.7% 92.3% 90.0% 88.9 0.923 0.941 0.200
All pause-related 69.7% 60.0% 69.2% 70.0% 64.3 0.685 0.981 0.815
Tempo+silence-related 75.8% 66.7% 76.9% 75.0% 71.4 0.788 0.976 0.663 Tempo+filler-related 84.8% 78.6% 84.6% 85.0% 81.5 0.785 0.971 0.595 Tempo+all pause-related 69.7% 60.0% 69.2% 70.0% 64.3 0.677 0.963 0.763
5.2. Hungarian-speaking Subjects
As for the classification scores of the Hungarian-speaking subjects based on attributes calculated by the Hungarian ASR model (see the lower half of Table 3), we got slightly different results (although, of course, the two parts of Table 3 cannot be compared, as the values were measured on different subjects). Using all 15 temporal parameters led to a fine performance, but exploiting the silent pause-related attributes was only scarcely better than simple guessing
285
(AUC scores of 0.519 and 0.531, without and with the speech tempo-derived attributes, respectively). However, filler- related temporal parameters turned out to be surprisingly useful: besides an AUC value of 0.912 and a minCllrvalue of 0.200, we achieved classification accuracy, recall (sensitivity) and specificity scores above 90%; with a precision score of 85.7%, it led to an F-measure value of 88.9. Not distinguishing the two hesitation types led to an average performance when judging by AUC (0.642) or minCllr(0.793), but the other evaluation metric values were the same
290
as those obtained by using all the attributes.
We can also notice the difference between the correspondingCllrand minCllrvalues. Indeed, the actualCllrscores are usually significantly higher (i.e. worse), sometimes even going above 1.0. In our opinion this indicates that the decision threshold between the two speaker categories was usually not set reliably. The other metric values did not reflect this, since they are insensitive to the actual threshold value: accuracy, precision, recall, specificity andF1were
295
calculated at Equal Error Rate (as common in the literature), and the AUC metric takes all possible decision levels into consideration. On the other hand, the AUC and minCllrvalues behaved quite similarly; the 14 value pairs presented in Table 3 have a correlation coefficient of -0.969.
6. Cross-Lingual Results
Next, we turn to the results of our cross-lingual experiments. That is, we will now calculate our set of tempo-
300
ral parameters (the features used for classification) with a Hungarian ASR system (trained on the BEA corpus) for the English-speaking MCI and HC subjects, while for the Hungarian-speaking subjects these were calculated by an English-language speech recognizer (trained on the TEDLium corpus). Note that, after this step, we still train and evaluate our SVM classifiers on subjects belonging only to one language (with the use of the nested cross-validation technique). Our results can be seen in Table 4.
305
6.1. English-speaking Subjects
The accuracy scores achieved when classifying the English-speaking MCI and HC subjects are listed in the upper half of Table 4. When using all 15 attributes, we obtained slightly lower scores than in the corresponding monolingual
case (shown in the upper half of Table 3), but these values are still quite high: accuracy, recall/sensitivity, specificity and UAR all appeared to be around 79%, while precision and theF1-score were 73.3% and 75.9, respectively. This, in
310
our opinion, indicates that the attribute set proposed in our previous studies, and outlined in Section 3, is quite robust, as it could be reliably extracted by an ASR system trained on a different language.
Examining the classification performances corresponding to the various attribute subsets, we see that when we relied only on the silent pause-related attributes, we measured slightly higher scores than in the mono-lingual case;
most importantly, the AUC score rose from 0.756 to 0.808 (but the other metric values improved as well with the
315
exception of minCllr, which appeared to be slightly worse). This supports our expectation that silent pauses can be located in a language-independent way. Still, in the case of using only the filled pause-related temporal parameters we observe lower performance scores, as the AUC value fell from 0.816 to 0.744 and the minCllr score rose from 0.579 to 0.656. Calculating the pause-related attributes for all pause types, however, again led to an increase in the classification performance: we measured practically identical scores as we did for the full feature set (in the cross-
320
lingual case), while for the monolingual case, AUC was 0.797 and the other metric values were around 60%.
6.2. Hungarian-speaking Subjects
The classification scores for the Hungarian-speaking subjects, when relying on the English ASR (see the lower part of Table 4) are usually slightly better than those obtained with the corresponding (i.e. Hungarian) ASR system (presented in the lower part of Table 3). More importantly, though, the tendencies of the evaluation metric values
325
measured mirror those of the monolingual case: the silence-related attributes were not remarkably useful (AUC value of 0.665 and minCllr score of 0.769), while filled pauses led to a very high (0.923) AUC and a very low (0.200) minCllrscore, while the other metrics also lay between 85% and 92%. When we included the articulation rate, speech tempo and utterance duration in our feature set, the AUC and minCllr scores improved slightly for the silent pause case, but for the filled pauses we found a slight drop in the scores (i.e. from 85.7-92.3% to 78.6-85.0%).
330
6.3. Summary
The classification results seem to support our hypothesis that the temporal speech parameters developed by our team can be calculated language-independently. For the English-speaking subjects, using all the attributes was, with- out a doubt, the most effective approach: although we obtained the same classification scores (not taking AUC,Cllr
and minCllrinto account) once for the English ASR case, and for most of the Hungarian ASR case, we never managed
335
to outperform it significantly. Looking at the feature subsets, attributes related to either hesitation types (i.e. silent or filler pauses) were of similar importance, although the filled pauses happened to be slightly more important in the monolingual case. Furthermore, the articulation tempo-related attributes proved to be beneficial in 5 out of the total of 6 cases.
From the classification results involving the Hungarian-speaking MCI and HC subjects, we also observe simi-
340
larities among the two ASR systems. First of all, we obtained the same metric values (again, with the exception of AUC) when we used all the temporal parameters, regardless of the language of the ASR model employed. For these speakers, filled pauses turned out to be significantly more useful than silent ones, while treating both pause types indifferently led to mediocre classification results regardless of the ASR language used. Lastly, the speech tempo- derived features were of little or no use (silent and filled pause-related attributes, respectively); and they only slightly
345
improved the classification performance for the monolingual case when we treated both hesitation types as identical in the monolingual case, while in the cross-lingual case there was no improvement at all.
Based on these results we can say that the language, for which the automatic speech recognition system was trained on, does not really affect the performance of the subsequent MCI-HC classification step. Therefore it seems that we can actually calculate the speech temporal parameters (described in Section 3) by using an ASR system of a
350
language different from that used by the MCI and HC subjects.
7. Comparing the Temporal Parameter Values
Up until now we have examined the temporal parameters extracted by the English and the Hungarian ASR systems by performing classification; however, the attributes themselves are interpretable, and (at least, by our hypothesis) for the two ASR systems they are expected to be quite similar for the same input (i.e. utterance). This allows us to make
355
Articulation rate
Speech tempo
Duration of utterance
Occurrence rate
Duration rate
Frequency Average
duration
Correlation
0 0.1 0.2 0.3 0.4 0.5 0.6 0.7 0.8 0.9 1
Silent pause Filled pause Both
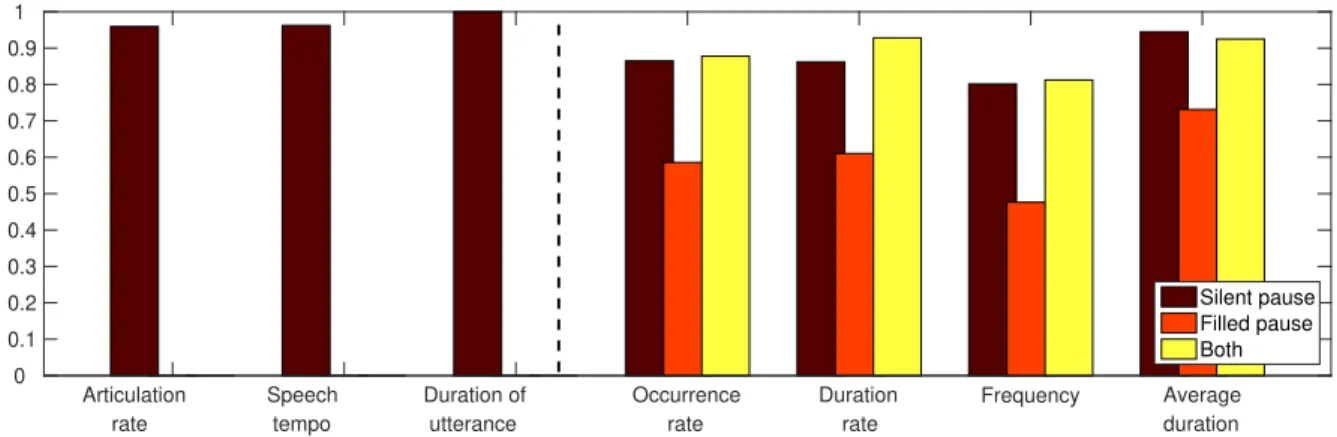
Figure 2:Correlation coefficients of the temporal speech parameters based on the output of the English and the Hungarian ASR models, measured on the utterances of the English MCI and HC subjects.
a more direct comparison of the calculated values. Therefore, next we took the temporal parameter values calculated for the English speech recordings got via both ASR systems, and calculated the (Pearson’s) correlation scores. The resulting values can be seen in Figure 2.
While it was not surprising that the duration of the utterances matched perfectly, we also measured high correlation scores for the articulation rate and for the speech tempo (0.959 and 0.962, respectively). These also support our
360
hypothesis that these attributes can be reliably calculated with the phone set of a different language.
For the silent pause-related attributes, we also notice quite high correlation values (i.e. in the range 0.801. . . 0.945); this supports our initial assumption that the silent pauses (and, of course, their starting and ending positions) can be located in a language-independent manner; in this case, using an English and a Hungarian ASR system for the English utterances. From the four values, the average duration was the most correlated attribute: it had a correlation
365
coefficient of 0.945, while we got the lowest correlation coefficient for pause frequency (0.801). This probably means that not all (but still, most) pause occurrences were found by the two ASR models, but they (roughly) agreed on the starting and ending points of these occurrences.
Examining the correlation coefficients measured for the filled pause-related temporal parameters, we see much lower values. As in the silent pause case, the average duration was the most correlated attribute (Pearson’s correlation
370
coefficient value of 0.731), while the pause frequency again had the lowest value. This suggests that one of the ASR systems (actually, the English one) found fewer filled pause occurrences than the other (i.e. the Hungarian); however, we found no huge difference in the duration of the filled pause events found by both ASR models. (Note, however, that the temporal speech parameters calculated from these pause occurrences remained similarly indicative for the subsequent classification step.)
375
To investigate whether this difference came from the languages used by the two ASR models, we conducted a final experiment. For this, we calculated our temporal speech parameters for thetraining setsof the two ASR systems (following the annotation we used for ASR training), i.e. the 15-hour subset of the TEDLium corpus and the 44- hour subset of the BEA database. Next, we calculated the ratio of these values; i.e. we took each attribute for the English training utterances, and divided it by the corresponding attribute value of the Hungarian training set (case
380
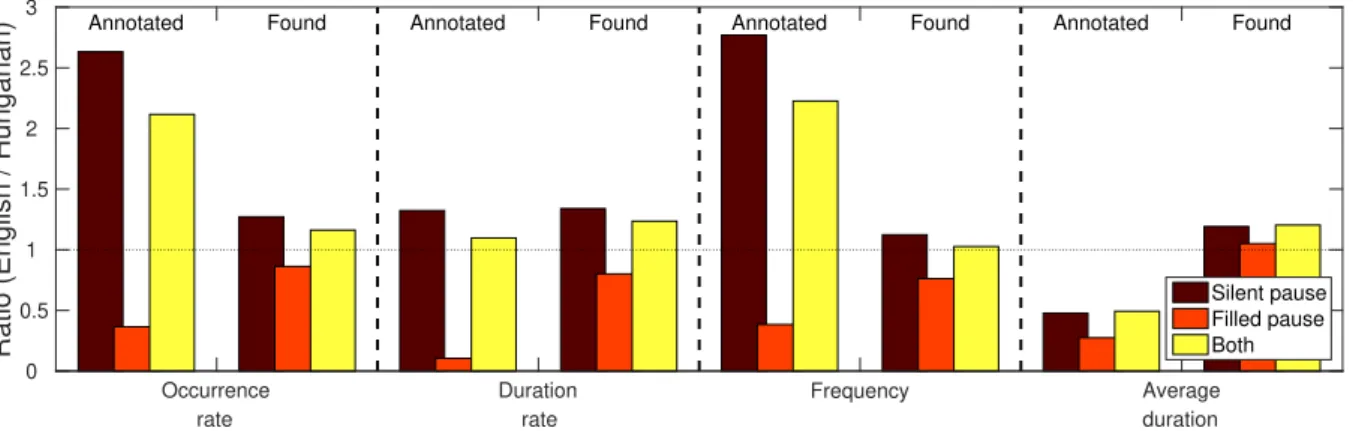
“annotated”). For example, a ratio value of 0.8 for the “average duration of filled pauses” attribute would mean that in the TEDLium corpus the annotated occurrences of filled pauses are, on average, 20% shorter than they are in the Hungarian BEA database. We repeated this process for the utterances of the English MCI and HC subjects; here we used the phonetic segmentation produced by the English and the Hungarian ASR models, and then we took the ratio of these two scores (case “found”). The resulting ratio values of our attributes are shown in Figure 3.
385
Looking at this graph, we see that the trends of the calculated temporal speech parameter values using the two ASR systems, generally follow the distribution of the samples in the two training sets. Regarding silent pauses, the TEDLium corpus contains significantly more (i.e. 2.5 times) silent pause occurrences than BEA does; and although their average duration is much smaller, their combined duration is still higher by 32%. (Surprisingly, 29% of the used subset of the TEDLium dataset corresponds to silence, while it is only 22% for the BEA corpus.) Examining the
390
Occurrence rate
Duration rate
Frequency Average
duration
Ratio (English / Hungarian)
0 0.5 1 1.5 2 2.5
3 Annotated Found Annotated Found Annotated Found Annotated Found
Silent pause Filled pause Both
Figure 3:Ratio of the temporal speech parameters calculated for the training set of the English and the Hungarian ASR systems (case “Annotated”), and for the output of the English and the Hungarian ASR models on the utterances of the English MCI and HC subjects (case “Found”).
detected silent pause occurrences in the speech of the (English) MCI and HC subjects, we observe similar trends: the English one found more pause occurrences than the Hungarian one, expressed by any of our temporal parameters (i.e.
occurrence rate, duration rate or frequency).
Regarding filled pauses, we see just the opposite. This subset of the TEDLium corpus contained fewer and shorter filled pauses than the 44-hour long BEA subset did: there, only 0.6% of the phones corresponded to filled pauses
395
(BEA: 1.7%), and only 0.5% of the total duration of the utterances were filled pauses (BEA: 5.0%). This was also reflected by the recognition results: in the very same utterances of the 14 MCI and 19 HC subjects, fewer filled pauses were hypothesized by the English ASR system than by the Hungarian one. Although the difference in this case is not as large as it was for the training corpora (for example, using the English ASR system 5.5% of the duration was marked as filled pause, while for the Hungarian ASR model it was 6.8%), the temporal speech parameters calculated from the
400
spontaneous speech utterances show the same tendencies as we found for the training sets. The only parameters which seem to be insensitive to this training data difference are the average durations: they appeared to be quite similar for all three cases (i.e. for silent pauses only, for filled pauses only, and for treating the two as the same event).
These values, in our opinion, suggest that the actual language of the ASR model is of secondary importance when calculating the proposed set of temporal speech parameters. However, thetype of utterancesand theannotationof
405
the corpus used to train the speech recognition system might lead to noticeable differences in these attributes. In our case, the TEDLium corpus consists of planned speech; and although such talks do contain filled pauses, they occur less frequently than in narrated spontaneous conversations, which comprise the BEA dataset. In contrast, lots of short pauses were marked in the annotation of TEDLium, which (at least, according to Fig. 3) were probably unannotated in the BEA Hungarian database. The ASR models trained on these two corpora led to phonetic transcripts which
410
followed this tendency: the English system, evaluated on the same utterances, found more silent and fewer filled pause occurrences than its Hungarian counterpart.
8. Conclusions
In this study, we investigated the language-dependence of our speech processing workflow, developed for dis- tinguishing between patients suffering from mild cognitive impairment (MCI) and healthy controls (HCs) based on
415
the analysis of their spontaneous speech. We decided to focus on a set of temporal speech parameters, consisting of the articulation rate, speech tempo, utterance duration, and attributes describing various characteristics of hesitation present in the speech of the subject. We distinguished two different types of hesitations: silent pauses, being the absence of any sound uttered by the speaker, and filled pauses, referring to vocalizations like ‘uhm’, ‘er’ and ‘ah’. We used a phone-level ASR system to obtain a phonetic-level, time-aligned transcription of each utterance, serving as the
420
basis of temporal speech parameter calculation.
To test the language-independence of this attribute set, we performed experiments using two different languages.
That is, we collected speech samples both from English and from Hungarian MCI and HC subjects, and analyzed
their speech using English-language and Hungarian-language ASR models. The calculated attribute vectors were then used as features for subject classification by Support Vector Machines in a nested cross-validation process into
425
two categories. Our hypothesis was that in the cross-lingual setup we could extract similarly indicative attributes for articulation rate, speech tempo, for the silent pause-related attributes and even for the filled pause-related ones.
The monolingual cases, i.e. when we applied the English ASR system to analyze the speech of the English- speaking subjects, and when we used the Hungarian ASR model for the Hungarian speakers, served as our baseline.
For the English subjects, we achieved high classification scores (in the range 80.0-85.7%, an Area-Under-Curve
430
score of 0.932 and minCllr = 0.305), while for Hungarian, the classification performance was acceptable (with classification metrics falling into the range 66.7-76.9% and with an AUC value of 0.727). By only using specific subsets of our temporal parameters, we noticed that filled pauses were more useful for both speaker groups (i.e.
English and Hungarian) than silent pauses; surprisingly, silent pauses were not useful at all for distinguishing the Hungarian subjects. Calculating the temporal attributes and treating the two pause types as the same phenomenon
435
proved to be less indicative than focusing on filled pauses only, for both languages.
In the next part of our study, we turned to the cross-lingual experiments: we used our Hungarian ASR model to analyze the English-speaking subjects, while the English ASR system was employed for the Hungarian subjects.
The classification results confirmed our hypothesis: although we got slightly lower scores for the English-speaking subjects than we did in the monolingual case, for the Hungarian-speaking sample our scores remained the same or even
440
improved. Furthermore, silent and filled pauses led to a similar classification performance for the English-speaking subjects. For Hungarian, filled pauses remained the most indicative despite using an ASR model trained for a different language (i.e. English), while the metric values corresponding to the silent pause-related attributes improved relative to the monolingual case. These results, in our opinion, support our hypothesis that both silent and filled pauses can be detected robustly, even when the ASR system used is trained on a different language.
445
In the last part of our study, we compared the calculated attributes more directly. To do this, we calculated Pearson’s correlation coefficient for all 15 temporal parameters obtained for the English subjects by both (i.e. English and Hungarian) ASR models. We found that the articulation rate and speech tempo were well correlated (coefficients around 0.96); we also got high correlation coefficients for the silent pause-related attributes (0.801 to 0.945), indicating that silence was detected by the two ASR systems to a similar extent. For the filled pauses, however, the attributes
450
were significantly less correlated (0.476. . .0.731), reflecting a difference in the outputs of the two ASR models in this regard. By examining the training sets of the two ASR systems, however, we found that this is most likely not due to the language difference, but it can be accounted for the distribution of silent and filled pauses in the training utterances. Indeed, the TEDLium corpus, used to train the English ASR system, contained significantly more silent pause occurrences than its Hungarian counterpart (the BEA Hungarian Database), while it had fewer filled pauses
455
present (or at least annotated). The outputs of the two ASR systems mirrored these trends: there were more silent and fewer filled pauses in the phonetic-level output of the English ASR model than in the output of the Hungarian one.
Overall, in our opinion, the differences we found in the temporal parameters appear to be the effect of a difference in thetraining databases, and they have little to do with the difference in the languages. However, speech recognition datasets which do contain filled pause occurrences, and, more importantly, where these occurrences are properly
460
annotated, are not so common. Finding datasets for different languages with the same (or at least similar) recording and annotation protocols is quite difficult. Fortunately, according to our experimental results, it is not even necessary:
our temporal speech parameters proved to be indicative both for the English-speaking and for the Hungarian-speaking subjects, regardless of the speech recognition dataset used for acoustic DNN model training.
Acknowledgments
465
This study was supported by the National Research, Development and Innovation Office of Hungary via contract NKFIH FK-124413, by the grant TUDFO/47138-1/2019-ITM of the Hungarian Ministry of Innovation and Tech- nology, and by the Hungarian Artificial Intelligence National Laboratory. G´abor Gosztolya was also funded by the J´anos Bolyai Scholarship of the Hungarian Academy of Sciences and by the Hungarian Ministry of Innovation and Technology New National Excellence Programme ´UNKP-20-5.
470
References
Al-Ghazali, A., Alrefaee, Y., 2019. Silent pauses in the speech of Yemeni EFL learners. ELS Journal on Interdisciplinary Studies on Humanities 2.
Alzheimer’s Association, 2020. 2020 Alzheimer’s disease facts and figures. Alzheimer’s & Dementia 16, 391–460.
Asgari, M., Kaye, J., Dodge, H., 2017. Predicting Mild Cognitive Impairment from spontaneous spoken utterances. Alzheimer’s & Dementia:
Translational Research & Clinical Interventions 3, 219–228.
475
Beltrami, D., Gagliardi, G., Favretti, R.R., Ghidoniand, E., Tamburini, F., Calza, L., 2018. Speech analysis by natural language processing techniques: A possible tool for very early detection of cognitive decline? Frontiers in Aging Neuroscience 10.
Boersma, P., 2001. Praat, a system for doing phonetics by computer. Glot International 5, 341–345.
Brueckner, R., Schmitt, M., Pantic, M., Schuller, B., 2017. Spotting social signals in conversational speech over IP: A deep learning perspective, in: Proceedings of Interspeech, pp. 2371–2375.
480
Br¨ummer, N., de Villiers, E., . The BOSARIS toolkit: Theory, algorithms and code for surviving the new DCF.arXiv: 1304.2865.
Bruscoli, M., Lovestone, S., 2004. Is MCI really just early dementia? A systematic review of conversion studies. International Psychogeriatrics 16, 129–140.
Cawley, G.C., Talbot, N.L.C., 2010. On over-fitting in model selection and subsequent selection bias in performance evaluation. Journal of Machine Learning Research 11, 2079–2107.
485
Chang, C.C., Lin, C.J., 2011. LIBSVM: A library for support vector machines. ACM Transactions on Intelligent Systems and Technology 2, 1–27.
Dehak, N., Kenny, P.J., Dehak, R., Dumouchel, P., Ouellet, P., 2011. Front-end factor analysis for speaker verification. IEEE Transactions on Audio, Speech, and Language Processing 19, 788–798.
Folstein, M., Folstein, S., McHugh, P., 1975. Mini-mental state: A practical method for grading the cognitive state of patients for the clinician.
Journal of Psychiatric Research 12, 189–198.
490
Foster, N.L., Bondi, M.W., Das, R., Foss, M., Hershey, L.A., Koh, S., Logan, R., Poole, C., Shega, J.W., Sood, A., Thothala, N., Wicklund, M., Yu, M., Bennett, A., Wang, D., 2019. Quality improvement in neurology. Neurology 93, 705–719.
Fraser, K., Rudzicz, F., Graham, N., Rochon, E., 2013. Automatic speech recognition in the diagnosis of primary progressive aphasia, in: Proceed- ings of SLPAT, Grenoble, France. pp. 47–54.
Fraser, K.C., Fors, K.L., Eckerstr¨om, M., ¨Ohman, F., Kokkinakis, D., 2019. Predicting MCI status from multimodal language data using cascaded
495
classifiers. Frontiers in Aging Neuroscience 11.
Fraser, K.C., Meltzer, J.A., Graham, N.L., Leonard, C., Hirst, G., Black, S.E., Rochon, E., 2014. Automated classification of primary progressive aphasia subtypes from narrative speech transcripts. Cortex 55, 43–60.
Fritsch, J., Wankerl, S., N ¨oth, E., 2019. Automatic diagnosis of Alzheimer’s Disease using Neural Network language models, in: Proceedings of ICASSP, pp. 5841–5845.
500
Frost, D., Ishihara, S., 2015. Likelihood ratio-based forensic voice comparison on L2 speakers: A case of Hong Kong native male production of English vowels, in: Proceedings of ALTA, Parramatta, Australia. pp. 39–47.
Garc´ıa, N., V´asquez-Correa, J.C., Orozco-Arroyave, J.R., N ¨oth, E., 2018. Multimodal i-vectors to detect and evaluate Parkinson’s Disease, in:
Proceedings of Interspeech, Hyderabad, India. pp. 2349–2353.
Gosztolya, G., T ´oth, L., Gr´osz, T., Vincze, V., Hoffmann, I., Szatl´oczki, G., P´ak´aski, M., K´alm´an, J., 2016. Detecting Mild Cognitive Impairment
505
from spontaneous speech by correlation-based phonetic feature selection, in: Proceedings of Interspeech, San Francisco, CA, USA. pp. 107–111.
Gosztolya, G., Vincze, V., T ´oth, L., P´ak´aski, M., K´alm´an, J., Hoffmann, I., 2019. Identifying Mild Cognitive Impairment and mild Alzheimer’s disease based on spontaneous speech using ASR and linguistic features. Computer, Speech & Language 53, 181–197.
Hinton, G., Deng, L., Yu, D., Dahl, G.E., Mohamed, A.R., Jaitly, N., Senior, A., Vanhoucke, V., Nguyen, P., Sainath, T.N., Kingsbury, B., 2012.
Deep neural networks for acoustic modeling in speech recognition: The shared views of four research groups. IEEE Signal Processing Magazine
510
29, 82–97.
Hoffmann, I., T ´oth, L., Gosztolya, G., Szatl´oczki, G., Vincze, V., K´arp´ati, E., P´ak´aski, M., K´alm´an, J., 2017. Besz´edfelismer´es alap´u elj´ar´as az enyhe kognit´ıv zavar automatikus felismer´es´ere spont´an besz´ed alapj´an. ´Altal´anos nyelv´eszeti tanulm´anyok 29, 385–405.
Igras-Cybulska, M., Zi´ołko, B., ˙Zelasko, P., Witkowski, M., 2016. Structure of pauses in speech in the context of speaker verification and classification of speech type. EURASIP Journal on Audio, Speech, and Music Processing 2016, 18.
515
de Ipi˜na, K.L., de Lizarduy, U.M., Calvo, P.M., Beitia, B., Garc´ıa-Melero, J., Fern´andez, E., Ecay-Torres, M., Faundez-Zanuy, M., Sanz, P., 2018.
On the analysis of speech and disfluencies for automatic detection of mild cognitive impairment. Neural Computing and Applications 9.
K ¨onig, A., Satt, A., Sorin, A., Hoory, R., Derreumaux, A., David, R., Robert, P.H., 2018. Use of speech analyses within a mobile application for the assessment of cognitive impairment in elderly people. Current Alzheimer Research 15, 120–129.
K ¨onig, A., Satt, A., Sorin, A., Hoory, R., Toledo-Ronen, O., Derreumaux, A., Manera, V., Verhey, F., Aalten, P., Robert, P.H., David, R., 2015.
520
Automatic speech analysis for the assessment of patients with predementia and Alzheimer’s Disease. Alzheimer’s & Dementia: Diagnosis, Assessment & Disease Monitoring 1, 112–124.
Laske, C., Sohrabi, H.R., Frost, S.M., de Ipi˜na, K.L., Garrard, P., Buscema, M., Dauwels, J., Soekadar, S.R., Mueller, S., Linnemann, C., Briden- baugh, S.A., Kanagasingam, Y., Martins, R.N., O’Bryant, S.E., 2015. Innovative diagnostic tools for early detection of Alzheimer’s disease.
Alzheimer’s & Dementia 11, 561–578.
525
de Leeuw, E., 2007. Hesitation markers in English, German, and Dutch. Journal of Germanic Linguistics 19, 85–114.
Manos, P.J., Wu, R., 1994. The ten-point clock test: A quick screen and grading method for cognitive impairment in medical and surgical patients.
International Journal of Psychiatry in Medicine 24, 229–244.
Mattys, S.L., Pleydell-Pearce, C.W., Melhorn, J.F., Whitecross, S.E., 2005. Detecting silent pauses in speech: A new tool for measuring on-line lexical and semantic processing. Psychological Science 16, 958–964.
530
Moro-Vel´azquez, L., G ´omez-Garc´ıa, J.A., Godino-Llorente, J.I., Villalba, J., Orozco-Arroyave, J.R., Dehak, N., 2018. Analysis of speaker recog- nition methodologies and the influence of kinetic changes to automatically detect Parkinson’s Disease. Applied Soft Computing 62, 649–666.
Morrison, G.S., Thiruvaran, T., Epps, J., 2010. Estimating the precision of the likelihood-ratio output of a forensic-voice-comparison system, in:
Proceedings of Odyssey, Brno, Czech Republic. pp. 63–70.