Current Alzheimer Research
ISSN: 1567-2050 eISSN: 1875-5828
Impact Factor Current: 2.952 5-Year: 3.459
BENTHAM SCIENCE
Current Alzheimer Research, 2018, 15, 130-138
RESEARCH ARTICLE
A Speech Recognition-based Solution for the Automatic Detection of Mild Cognitive Impairment from Spontaneous Speech
László Tóth
c,*, Ildikó Hoffmann
a,b, Gábor Gosztolya
c, Veronika Vincze
c, Gréta Szatlóczki
d, Zoltán Bánréti
b, Magdolna Pákáski
dand János Kálmán
daLinguistics Department, University of Szeged, Szeged, Hungary; bResearch Institute for Linguistics, Hungarian Acad- emy of Sciences, Budapest, Hungary; cMTA-SZTE Research Group on Artificial Intelligence, Szeged, Hungary;
dDepartment of Psychiatry, University of Szeged, Szeged, Hungary
A R T I C L E H I S T O R Y Received: July 02, 2017 Revised: September 10, 2017 Accepted: October 15, 2017 DOI:
10.2174/1567205014666171121114930
Abstract: Background: Even today the reliable diagnosis of the prodromal stages of Alzheimer’s dis- ease (AD) remains a great challenge. Our research focuses on the earliest detectable indicators of cogni- tive decline in mild cognitive impairment (MCI). Since the presence of language impairment has been reported even in the mild stage of AD, the aim of this study is to develop a sensitive neuropsychological screening method which is based on the analysis of spontaneous speech production during performing a memory task. In the future, this can form the basis of an Internet-based interactive screening software for the recognition of MCI.
Methods: Participants were 38 healthy controls and 48 clinically diagnosed MCI patients. The provoked spontaneous speech by asking the patients to recall the content of 2 short black and white films (one di- rect, one delayed), and by answering one question. Acoustic parameters (hesitation ratio, speech tempo, length and number of silent and filled pauses, length of utterance) were extracted from the recorded speech signals, first manually (using the Praat software), and then automatically, with an automatic speech recognition (ASR) based tool. First, the extracted parameters were statistically analyzed. Then we applied machine learning algorithms to see whether the MCI and the control group can be discrimi- nated automatically based on the acoustic features.
Results: The statistical analysis showed significant differences for most of the acoustic parameters (speech tempo, articulation rate, silent pause, hesitation ratio, length of utterance, pause-per-utterance ratio). The most significant differences between the two groups were found in the speech tempo in the delayed recall task, and in the number of pauses for the question-answering task. The fully automated version of the analysis process – that is, using the ASR-based features in combination with machine learning - was able to separate the two classes with an F1-score of 78.8%.
Conclusion: The temporal analysis of spontaneous speech can be exploited in implementing a new, automatic detection-based tool for screening MCI for the community.
Keywords: Mild cognitive impairment, spontaneous speech, diagnosis, acoustic analysis, temporal features, speech recogni- tion, machine learning.
1. INTRODUCTION
Alzheimer’s disease (AD) is a quite distinct neurodegen- erative disorder that develops for years before clinical mani- festation. Although it has been extensively researched, un- certainty regarding the diagnosis of its prodromal stages still exists. However, the symptoms of mild cognitive impairment (MCI) might be detected years before the actual diagnosis [1]. This tells us that the clinical appearance of AD is pre- ceded by a prolonged, preclinical phase. Hence, early diag- nosis and timely treatment are very important, as the pro-
*Address correspondence to this author at the MTA-SZTE Research Group on Artificial Intelligence, Szeged, Hungary; Tel./Fax: ++36-62-544142, ++36-62-54-6737; E-mail: tothl@inf.u-szeged.hu
gression can be slowed down and the occurrence of new symptoms can be delayed [2].
MCI is a heterogeneous syndrome that has a clinical im- portance in the early detection of both AD [3] and the pro- dromal state of dementia. MCI often remains undiagnosed, as recognizing cognitive impairment is challenging for clini- cians at any stage of the disease: up to 50% of even later stage dementia fails to be recognized [4]. Widely used screening tests such as the Mini-Mental State Examination (MMSE) are not sensitive enough to reliably detect subtle impairments present in patients with early-stage MCI. Lin- guistic memory tests like word list and narrative recall are more effective in the detection of MCI, but they tend to pro- duce undesired false positive diagnoses [5].
1875-5828/18 $58.00+.00 © 2018 Bentham Science Publishers
MCI is known to influence the linguistic abilities of the patient in the following aspects: temporal changes in sponta- neous speech [5-11], phonemic paraphasia [7, 9, 10, 12-14], word retrieval and word finding difficulties [11, 15-20] and verbal fluency difficulties [5, 10, 17, 21-25]. Although lan- guage impairment has been known to occur early in the dis- ease process [26], only minimal attention has been paid to a formal language evaluation when diagnosing AD [27]. Since language impairment has been reported even in the mild stage of AD, we recently developed a sensitive neuropsy- chological screening method that is based on a memory task, triggered by spontaneous speech [7]. In the future, this ap- proach might from the basis of screening for MCI through a computerized, interactive test implemented as a software package [28].
MCI is known to influence the (spontaneous) speech of the patient via three main aspects [11]. Firstly, the verbal fluency of the patient deteriorates, which results in distinc- tive acoustic changes – most importantly, in longer hesita- tions and a lower speech rate [9, 10]. Secondly, as the patient has trouble finding the right word, the lexical frequency of words and part-of-speech tags may also change significantly [19, 20, 29]. Thirdly, the emotional responsiveness of the patient was also reported to change in many cases. There are attempts to detect these changes based on the paralinguistic and prosodic features of the patient’s speech [30-34].
The goal of the study we present here was twofold. First, we sought to find acoustic (temporal) parameters that have a high correlation with MCI. For this, our starting point was our earlier study, where we examined the speech of AD pa- tients [7]. There we compared the articulation rate, speech tempo, hesitation ratio, and rate of grammatical errors of AD patients versus a normal control group. Our results showed that these acoustic parameters may have a diagnostic value for mild-stage AD and thus can be viewed as acoustic bio- markers of AD. Here, we perform the statistical evaluation of a similar set of temporal features, but in this case on the speech recordings of MCI patients.
The manual extraction and analysis of the temporal fea- tures can be very informative regarding the acoustic corre- lates of MCI. However, performing the same analysis for each new patient for diagnostic purposes would be very time consuming. Hence, finding ways of automating the feature extraction process would be vital. Furthermore, if the diag- nostic decision process could be automated as well, then the corresponding algorithms could form the basis of a fully automatic screening test.
The simplest way of automating the feature extraction procedure is to apply signal processing methods. With these, one can separate voiced and voiceless segments, speech and non-speech, or periodic-aperiodic parts [9, 30]. However, the precise measurement of temporal features such as articula- tion rate would require the use of automatic speech recogni- tion (ASR) tools. Several researchers have already used ASR in the detection of dementia or MCI, but they usually applied off-the-shelf ASR solutions [5, 10, 19, 35]. In this study, we present an ASR system that was especially tailor-made for detecting our acoustic biomarkers. The most important dif- ference is that, instead of minimizing the word error rate, our system focuses on finding the phones. Even more unusually,
our biomarker extraction step requires the ASR only to find the phone boundaries, as the actual phone labels are not re- quired by the feature extraction procedure. A further differ- ence compared to standard ASR solutions is that finding and identifying filled pauses is important for us, while these segments are usually filtered out from a standard ASR output as garbage. More details and explanation will be given in Sections 3 and 4.
The second step of automation is to obtain a diagnostic decision algorithmically. For this purpose, we applied ma- chine learning technologies. Based on the manual labeling (yes/no diagnosis) of our MCI and control patients, we trained the Weka machine learning toolkit [36] to distinguish the two classes. We performed this classification experiment with both the manually and the automatically extracted fea- tures, in order to see how the two feature sets compare.
The structure of this article is as follows. First, we pre- sent the subjects and the data acquisition method in Section 2. We introduce our set of temporal features and perform statistical analysis on them in Section 3. In Section 4 we pre- sent our method for the automation of feature extraction us- ing ASR, and in Section 5 we attempt to automatically clas- sify MCI cases using machine learning methods. Lastly, in Section 6, we make some concluding remarks.
2. SUBJECTS AND DATA COLLECTION
A total of 84 subjects participated in the study. From this, 48 persons were MCI patients and 36 were healthy controls.
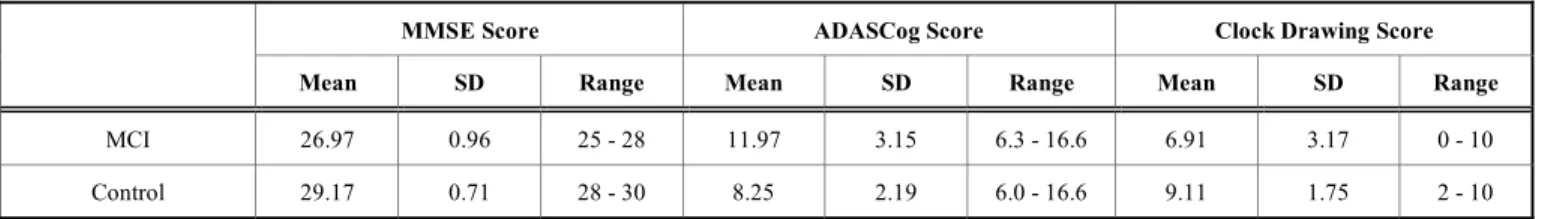
All the 48 subjects with MCI were right-handed, native speakers of Hungarian and they also had a negative medical history for hearing impairment. They were also free of any medication that might influence cognitive functions in any way. The healthy control (NC) group included 36 partici- pants, who were also right-handed, native speakers of Hun- garian. The NC group did not differ significantly from the MCI group in either gender ( χ2-test, p=0.791) or years of education (t-test, p=0.0807). As regards age, the MCI group differed significantly from healthy controls (t-test, p = 0.0322). That is, subjects older than 71 years were more likely to belong to the MCI group. The following clinical tests were applied to assess the cognitive state of the sub- jects: Clock Drawing Test [37], Mini-Mental State Examina- tion [38], ADAS-Cog [39]. The state of depression was as- sessed using the Geriatric Depression Scale. The main statis- tical properties of the MCI and the control group are summa- rized in Tables 1a and 1b.
All the tests were carried out at the Alzheimer Disease Research Centre of the University of Szeged, Hungary. The research was approved by the Ethics Committee of the Uni- versity of Szeged, and all experiments were conducted in accordance with the Declaration of Helsinki.
The linguistic protocol of collecting the speech samples from the subject consisted of the following steps. After pre- senting a specially designed one-minute-long animated movie, the subjects were requested to talk about the events they saw to happen the film (Task 1 - “immediate recall”).
After this, we asked the subjects to describe their previous day (Task 2 - “spontaneous speech”). Finally, as the last task, a second film was presented, and the subjects were
Table 1a. The main statistics of the MCI and the control groups - personal data.
Age Years of Education Sex
Mean SD Range Mean SD Range Male Female Total
MCI 73.08 7.95 55 - 93 11.82 3.29 8 - 18 16 32 48
Control 64.13 7.08 57 - 84 12.47 3.21 8 - 20 13 23 36
Table 1b. The main statistics of the MCI and the control groups - mental test results.
MMSE Score ADASCog Score Clock Drawing Score
Mean SD Range Mean SD Range Mean SD Range
MCI 26.97 0.96 25 - 28 11.97 3.15 6.3 - 16.6 6.91 3.17 0 - 10
Control 29.17 0.71 28 - 30 8.25 2.19 6.0 - 16.6 9.11 1.75 2 - 10
asked to talk about this film after a one-minute long distrac- tion (Task 3 – "delayed recall"). This way, we obtained three recordings from each subject, corresponding to the three different tasks. The recording was performed with an Olym- pus WS-750M digital voice recorder and a König tie clip microphone. The sound samples were recorded in wma for- mat, which was later converted into an uncompressed PCM mono, 16-bit wav format with a sampling rate of 16000 Hz.
3. MANUALLY EXTRACTED TEMPORAL FEA- TURES
After a careful listening, the recordings were transcribed both orthographically and phonetically. The manual analysis of the signals was carried out with the help of the PRAAT software (www.praat.org, [40]). The acoustic parameters we examined are the temporal variables listed in Table 2. We mention that hesitation was defined as the absence of speech for more than 30 ms [41].
Notice that while the first three features focus on the phonetic content of the signals, the remaining five features try to extract information about the pauses found in the re- cordings. However, hesitations do not necessarily mean si- lent pauses, but can also correspond to filled pauses where the speaker hums, or produces other hesitating sounds (uhm, er, etc.). Hence, we decided to calculate the last five features both for silent and filled pauses separately. Furthermore, we also calculated them with both types of pauses taken into account. Hence, these five features resulted in fifteen values, so altogether with the first three features we extracted eight- een features from each utterance.
It should be mentioned that, technically speaking, the calculation of the acoustic parameters requires the precise placement of the phonetic segment boundaries, and the iden- tification of each segment as pause, filled pause or phoneme.
Hence, the manual processing step using PRAAT basically consisted of the phonetic segmentation and labeling of the utterances. We will try to replace this manual process by speech recognition methods in Section 4.
Table 2. The proposed acoustic features.
Name Description
Duration The total duration of the utterance (ms)
Speech rate
The number of phonemes per second during speech (including hesitations); the number of total phonemes uttered, divided by the total duration of the utterance
Articulation rate The number of phonemes per second during speech (excluding hesitations)
Number of pauses The number of pause occurrences Total length of pauses The total duration of pauses (ms) Total length of pauses /
Duration
The ratio of total pause duration and the length of the utterance (%)
Pause rate The number of pause occurrences divided by the total duration of the utterance
Average length of pauses
The total duration of pauses divided by the number of pauses
3.1. Statistical Analysis of the Features
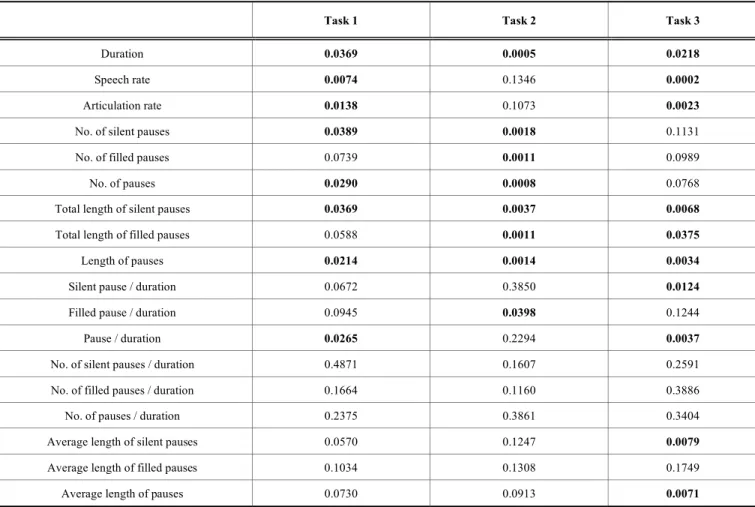
In order to investigate the importance of each feature, we carried out a statistical analysis. We applied the t-test to each temporal feature for each task and compared the data from the MCI group to those got from the NC group. The t-test applied was a one-tailed t-test for unpaired samples and une- qual variances. Table 3 shows the p-values for each parame- ter and for each of the three tasks. The cases where the dif- ference between the two groups is significant (i.e. where p <
0.05) are marked in bold.
Our analysis found that duration, the total length of silent pauses and the (total) length of pauses indicated significant differences between controls and MCI patients for all the three tasks. As for articulation rate, speech rate and the ratio of pauses and duration, there were significant differences
Table 3. The significance of each feature in the three tasks.
Task 1 Task 2 Task 3
Duration 0.0369 0.0005 0.0218
Speech rate 0.0074 0.1346 0.0002
Articulation rate 0.0138 0.1073 0.0023
No. of silent pauses 0.0389 0.0018 0.1131
No. of filled pauses 0.0739 0.0011 0.0989
No. of pauses 0.0290 0.0008 0.0768
Total length of silent pauses 0.0369 0.0037 0.0068
Total length of filled pauses 0.0588 0.0011 0.0375
Length of pauses 0.0214 0.0014 0.0034
Silent pause / duration 0.0672 0.3850 0.0124
Filled pause / duration 0.0945 0.0398 0.1244
Pause / duration 0.0265 0.2294 0.0037
No. of silent pauses / duration 0.4871 0.1607 0.2591
No. of filled pauses / duration 0.1664 0.1160 0.3886
No. of pauses / duration 0.2375 0.3861 0.3404
Average length of silent pauses 0.0570 0.1247 0.0079
Average length of filled pauses 0.1034 0.1308 0.1749
Average length of pauses 0.0730 0.0913 0.0071
among controls and MCI patients in tasks 1 and 3 but not in task 2. The number of silent pauses and pauses differed sig- nificantly in tasks 1 and 2, whereas the total length of filled pauses showed significant differences in tasks 2 and 3.
There were also certain parameters that were significant only in the case of one of the tasks. Namely, the number of filled pauses and the ratio of filled pauses and duration showed significant differences only in task 2, while the ratio of silent pauses and duration, the average length of silent pauses and the average length of pauses were significant only in task 3.
4. AUTOMATIC EXTRACTION OF ACOUSTIC BIO- MARKERS
In the last section we saw that the majority of the tempo- ral features examined correlate with the diagnosis of MCI, so they might be regarded as acoustic biomarkers of MCI.
However, extracting these biomarkers manually is rather tedious and requires skilled labor, as their calculation is based on the phonetic segmentation of the recordings. In this section we present our special, speech recognition-based solution for the automatic extraction of the relevant acoustic features. But before doing this, we will give a brief overview of the related studies found in the literature.
4.1. Related Work
The simplest way of automating the feature extraction procedure is to apply signal processing methods. For exam- ple, signal processing algorithms can be used for the separa- tion of voiced and voiceless segments, for finding the silent sections of a recording, or for the extraction of prosodic fea- tures. Satt et al. derived continuity features from the dura- tions of contiguous voice and silence segments, and from the lengths of periodic and aperiodic segments. They separated the voiced and the silent segments using a simple voice ac- tivity detection algorithm, based on the pitch-synchronous intensity curve of the recorded speech signal. The periodic and aperiodic segments were detected based on the pitch contour. They calculated these features using the PRAAT software, and intentionally avoided speech recognition tools in order to keep their system language-independent [9]. De Ipiña et al. also applied Praat to cut the acoustic signal into voiced and voiceless segments. They applied an automatic voice activity detector for this purpose, and they represented the segments by creating a statistics of their duration, short- term energy and the location of spectral centroids [30]. Rap- can et al. separated the speech and non-speech parts of the input signal using relatively simple signal processing meth- ods. They employed a thresholding method to the energy
contour of the speech signal, and also applied an edge detec- tion algorithm to find the boundaries of breath sounds. An important novelty of this paper is that the authors recognized that elongated breaths may correspond to filled pauses, and thus they may be discriminative features in the cognitive function. Based on this observation, Rapcan et al. took spe- cial care to separate breath sounds from speech [42].
The advantage of the above-mentioned signal processing methods is that they are relatively simple, and also largely language-independent. However, extracting features like periodicity/aperiodicity can give only a rough estimate of such temporal features like the rate of speech. Moreover, as Fraser et al. correctly note, these simple techniques cannot distinguish filled pauses from speech, so they will find only the silent pauses [43]. An alternative option is to involve automatic speech recognition (ASR) tools in the process of feature extraction. This approach is language-dependent, but allows the precise calculation of phone duration-based measures. Baldas et al. proposed the use of ASR for tran- scribing the speech signal, and extract lexical features from the transcripts that may help the early detection of AD.
However, they did not apply the ASR to extract acoustic features, and their short conference paper contains no ex- perimental results [29]. Lehr et al. also applied ASR in the detection of MCI, but similar to Baldas et al., they employed the ASR only to obtain an orthographic transcript, and not for the purpose of extracting acoustic features. We note that their ASR system produced relatively large word error rates (between about 30% and 50%), and the error rates were sig- nificantly higher for the MCI group than for the control group [35]. Fraser et al. applied the off-the-shelf ASR tool of Nuance in the diagnosis of primary progressive aphasia.
They argued that the accuracy of ASR systems for elderly voices usually decreases with the age of the speaker, and that speech recognition can be even more challenging in the pres- ence of linguistic impairments [43]. Roark et al. extracted temporal features that are very similar to the ones we pro- pose here, for example, the pause rate and the phonation rate.
They also made use of an ASR tool in the extraction of the features. However, in their case the transcript is obtained manually, and ASR is applied only for creating a forced time alignment. Hence, their approach allows only the automation of narrative recall tests in the best case [5]. The closest study to ours is that of Jarrold et al, who applied ASR to extract both acoustic and lexical features. Their acoustic feature set consisted of duration-based measures like the duration of consonants, vowels, pauses, and other acoustic-phonetic categories. However, they did not turn special attention to handling breaths or any other types of filled pauses [10].
Here, however, we apply a dedicated ASR tool which was adapted to the special needs of extracting the acoustic fea- tures discussed in Section 3. We explain the specialties of our ASR system below.
4.2. Extracting the Features using a Dedicated ASR Tool As we have seen, some authors already attempted to use an ASR tool as part of the feature extraction process. How- ever, using off-the-shelf ASR software (similar to that used by Fraser et al. [43]) may be suboptimal. The explanation is that standard speech recognizers are optimized to minimize the number of transcription errors at the level of words,
while here we want to extract non-verbal acoustic features such as the rate of speech or the duration of pauses. Note, for example, that none of our acoustic features require the actual identity of the phones; instead, we need only to count them, and to measure their duration. Furthermore, the filled pauses do not appear explicitly in the output of a conventional ASR system, while for our purposes they convey an important piece of information. Also, our data collection method – Task 2 in particular – would require a domain-independent or "open-domain" ASR software. Because of the highly ag- glutinative nature of Hungarian, such recognizers do not yet exist for Hungarian, and the few exceptions (like Google's free ASR tool) work with a surprisingly large word error rate [44]. In addition to this, the speech of dementia patients has been observed to contain an increased amount of agrammati- cal sentences and incorrect word inflections [19, 43]. Prepar- ing a standard ASR system to handle all these non-standard errors would require a statistical model of the language of demented people, for which our sample set was definitely too small. Moreover, similar studies that experimented with the automatic recognition of the speech of MCI patients re- ported quite large word error rates in the range of 30 to 50%
[35].
Because of the reasons presented above, we decided to create a dedicated version of our speech recognizer that has been tailored to the special requirements of the task. Rather than producing a word-level transcript, it provides only a phone sequence as output, which includes filled pause as a special ‘phone’. Of course, the recognition of spontaneous speech of elderly people is known to be relatively difficult [43, 45]. Doing this only at the phonetic level, that is, with- out restricting the vocabulary obviously increases the num- ber of recognition errors. However, as we already pointed out, many types of phone recognition errors do not harm the extraction of the acoustic indicators. Hence, the main ques- tion of our experiments was whether our acoustic features (and the subsequent classification step described later) toler- ates the inaccuracies introduced by switching from the man- ual to the automatic extraction method.
The technical details of how we constructed our dedi- cated ASR system is as follows. To train the speech recog- nizer we used the BEA Hungarian Spoken Language Data- base [46]. This database contains spontaneous speech, simi- lar to the recordings collected from the MCI patients. We used approximately seven hours of speech from the BEA corpus, mostly recordings from elderly persons, in order to match the age group of the targeted MCI patients. Although the BEA dataset contains spontaneous speech, its original annotation did not perfectly fit our needs. It contained the word-level transcript of the utterances, but the filled pauses and other non-verbal audio segments (coughs, laughters, sighs, breath intakes etc.) were not or improperly marked.
Thus we adjusted the annotation of the recordings to our needs. This mainly consisted of extending the transcripts by annotating filled pauses, breath intakes and exhales, laughter, gasps and coughs in a consistent manner.
We rained the ASR system to recognize the phones in the utterances, where the phone set was extended to include the special nonverbal labels mentioned above. For acoustic modeling we applied a special convolutional deep neural
network (CNN) based technology. With this approach we achieved one of the lowest phone recognition error rates ever reported on the TIMIT database [47]. As a language model we applied a phone bigram, which is a very simple statistical model that estimates the probability of the next phone based on the actual one. Naturally, these phone bigrams also in- cluded the non-verbal audio tags mentioned earlier. The ASR system outputs the phonetic segmentation and labeling of the input signal, including the filled pauses. Using this output, the acoustic biomarkers we introduced in Section 3 can be easily extracted by performing simple calculations.
More technological details on our ASR solution can be found in our conference paper [48].
5. CLASSIFYING MCI VIA MACHINE LEARNING Our final goal is the development of a software applica- tion that would allow the users to self-test themselves for MCI. Depending on the results of the test, the program would suggest the subject to visit a neurologist to go through a more detailed examination. To create such a piece of soft- ware, not only the feature extraction process but also the decision making step needs to be automated. We made the decision making procedure automatic using machine learn- ing as follows. The values of the acoustic features are for- warded to a machine learning method, which classifies the patient as either having MCI or not. The manually extracted feature values were at our hands for all the test files, so the classification results produced by the machine learning on this feature set were used as our baseline. We repeated the feature extraction step using the ASR tool, and we compared the resulting accuracy scores with the baseline.
For machine learning, we applied the Weka tool, which is a free and open-source collection of machine learning algo- rithms [36]. As our dataset was very small, we restricted ourselves to simpler classification methods, namely Naive Bayes, linear SVM and Random Forests. Naive Bayes is a natural choice in the case of very small datasets, as it has a very efficient modeling strategy to alleviate the so-called
"curse of dimensionality" [49]. We chose SVM because it is one of the most popular classification methods in bioinfor- matics [50]. Finally, Random Forest is a relatively new clas- sification algorithm which is also known to be robust in the case of limited data, but its modeling strategy is much more sophisticated than that of Naive Bayes [51, 52].
The technical details of training Weka for the MCI classi- fication task are as follows. We treated the three utterances of each patient as one training sample, so altogether we had 84 training samples. The goal of training was to decide whether a given speaker has MCI or not, which results in a 2-class classification task. As for each subject we had three recordings collected from the three different tasks, by con- catenating the eighteen biomarkers shown in Table 2 we obtained 54 feature values per subject. From a machine learning perspective, this dataset is rather small. Unfortu- nately, the number of diagnosed MCI patients is quite lim- ited, and it is tedious to collect recordings from them. All the similar studies we found worked with fewer than 100 pa- tients [5, 9, 10, 35, 43].
Having so few examples, we did not form separate train- ing and test sets, but applied the so-called leave-one-out
method. This means that we withheld one example (i.e. one subject), trained our classifier on the remaining ones, and then evaluated the model on the withheld sample. We re- peated this step for all the examples and finally aggregated the resulting accuracies into one final score.
From Weka, we used the implementations called Naive- Bayes, SMO and RandomForest. We applied Naive Bayes with its default settings; for Random Forest we used 100 decision trees, while we varied the number of randomly cho- sen features (on which these trees were trained on). We used SVM with a linear kernel, and varied the C complexity meta- parameter in the range of 10-5 to 102. The optimal meta- parameters for the Random Forest and SVM methods were found by iterating through these fixed sets and choosing the value that produced the highest F-measure.
The choice of evaluation metric is not an easy and clear- cut issue for this task. From a machine learning perspective, we can apply standard information retrieval metrics: preci- sion measures what percentage of the MCI detections corre- spond to real MCI cases (true positives per true plus false positives), whereas recall tells us what percentage of the real MCI occurrences were detected (true positives per true posi- tives plus false negatives). For those who prefer to express the performance of the classifier by just one number, the standard choice is the F-measure (or F1-score), which is the harmonic mean of precision and recall. Lastly, as in this case the class distribution is quite balanced, optimizing for accu- racy (defined as the number of correctly classified examples over the total number of examples) makes sense as well.
Readers coming from the field of biomedicine might be more familiar with the terms sensitivity (the same as recall) and specificity (false positives per true positives plus false negatives), and might also be interested to see the ROC curve and the corresponding area under the curve (AUC) values. We list all these metrics in the tables, and also show ROC curves for the sake of completeness, but we stress that during training the parameters were chosen to optimize the F1-score of the MCI class. Hence, the other metrics may not be perfectly optimal due to the well-known tradeoff between specificity and sensitivity (or precision and recall).
5.1. Classification Results and Discussion
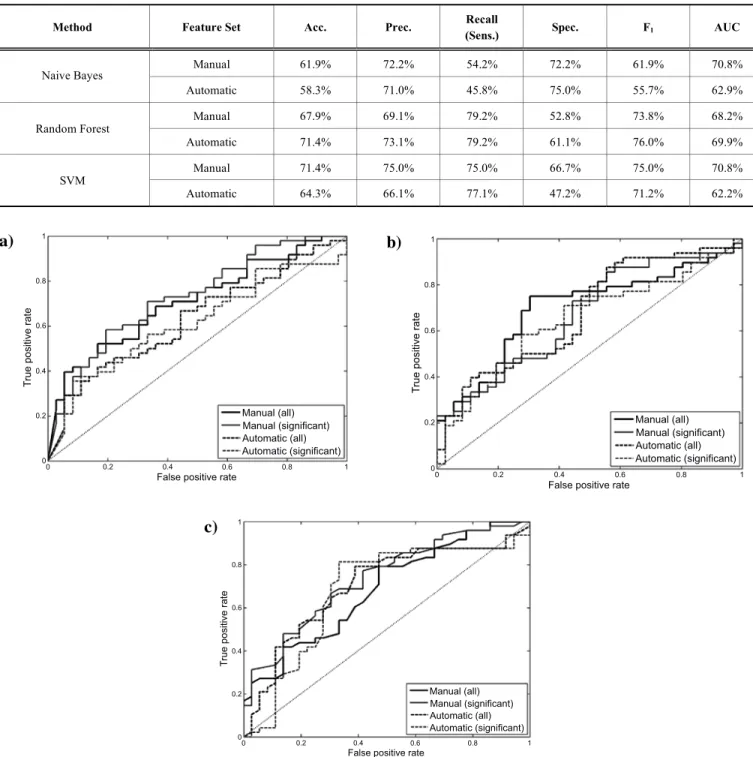
Table 4 shows the classification accuracy measures ob- tained using all the features extracted. We compared the per- formance of three classifier algorithms – Naive Bayes, SVM and Random Forest - using the manually and the automati- cally extracted features. It can be seen that, for the manually extracted feature set, SVM outperformed both Random For- est and Naive Bayes. However, Random Forest worked somewhat better than SVM with the automatic feature set.
Hence, while Naive Bayes performed clearly the worst for both features sets, we cannot draw a definite conclusion as regards which machine learning algorithm - SVM or Fandom Forest - is more suitable for the given classification task.
Comparing the two feature sets, the best accuracy scores attained (with Random Forest for the automatic features, and with SVM for the manual features) are equivalent (71.4%), and the F1-score with the automatic features is slightly better (76.0% vs. 75.0%). The fact that the F1-scores and accuracy
Table 4. The accuracy scores using all the features.
Method Feature Set Acc. Prec. Recall
(Sens.) Spec. F1 AUC
Manual 61.9% 72.2% 54.2% 72.2% 61.9% 70.8%
Naive Bayes
Automatic 58.3% 71.0% 45.8% 75.0% 55.7% 62.9%
Manual 67.9% 69.1% 79.2% 52.8% 73.8% 68.2%
Random Forest
Automatic 71.4% 73.1% 79.2% 61.1% 76.0% 69.9%
Manual 71.4% 75.0% 75.0% 66.7% 75.0% 70.8%
SVM
Automatic 64.3% 66.1% 77.1% 47.2% 71.2% 62.2%
Fig. (1). (a). The ROC curve for the Naive Bayes classifier. (b). The ROC curve for the SVM classifier. (c). The ROC curve for the Random Forest classifier.
scores achieved with the automatically extracted feature set are competitive with the scores of the manually calculated features demonstrates that our approach of using ASR tech- niques for feature extraction is viable.
Comparing the precision and recall values, the Random Forest method shows a clear preference for the automatic feature set, as the recall values are the same, while the preci- sion is higher. The case of SVM is not that clear as it gives a higher recall for the automatic features set, and a higher pre- cision for the manual set. In this case the ROC curve is worth examining, as it allows the evaluation of a classifier at
various true and false positive rates. Figs. (1a, 1b, 1c) show the ROC curves of the three classifiers. In the case of the Naive Bayes classifier, the automatic feature set is worse than the manual one in almost all cases, and this fact is also clearly reflected by the corresponding AUC value in Table 1.
However, none of the curves have a clear dominance in the case of the SVM and the Random Forest classifiers, and the best AUC values are also very close (70.8% for the manual and 69.9% for the automatic feature set).
Lastly, we performed an experiment where we removed those features that were found not to be significant in Section
a) b)
c)
1
0.8
0.6
0.4
0.2
00 0.2 0.4 0.6 0.8 1
False positive rate
Manual (all) Manual (significant) Automatic (all) Automatic (significant)
True positive rate
1
0.8
0.6
0.4
0.2
00 0.2 0.4 0.6 0.8 1
False positive rate
Manual (all) Manual (significant) Automatic (all) Automatic (significant)
True positive rate
1
0.8
0.6
0.4
0.2
00 0.2 0.4 0.6 0.8 1
False positive rate
Manual (all) Manual (significant) Automatic (all) Automatic (significant)
True positive rate
3.1. This way, from the 54 features only 26 were retained (cf. Table 2). The machine learning methods were applied the same way as before. Table 5 shows the classification accuracy values obtained using only the statistically signifi- cant features.
In the case of the SVM classifier, we obtained slightly worse results compared to using all the features, which, in our opinion, reflects the fact that SVM could make use of even those features which did not display a statistically sig- nificant difference among the two groups. On the other hand, the performance of the Random Forest classifier slightly improved with the reduction of the feature set. In summary, the best F1-score we could achieve is 78.8% with the auto- matic features (reduced feature set, Random Forest classi- fier), and 75.0% for the manual features (full feature set, SVM classifier). The achieved F1-score of 78.8% is far better than what a random guesswork would give, and we hope that with future refinements our approach will serve as the start- ing point for developing a fully automatic MCI screening software package.
CONCLUSION
Here, we performed a statistical analysis of a previously proposed acoustic feature set on the spontaneous speech of MCI patients. The analysis indicated that the speech rate the number and duration of silent and filled pauses, and some other derived features behave significantly differently for MCI patients than those for control people, and hence these features can be used as acoustic biomarkers to strengthen the diagnosis of MCI. We also went one step further, and intro- duced a speech recognition based method for the automatic extraction of these features. Lastly, we attempted to auto- mate the diagnosis as well, using machine learning methods.
In our experiments, we were able to separate the MCI pa- tients from the control group with an F1-score of 78.8% us- ing only automatically extracted features and automatic clas- sification.
DISCLOSURE
Part of this article has been previously published in 16th Annual Conference of the International Speech Communica- tion Association, INTERSPEECH 2015 Dresden, Germany 2694-98.
ETHICS APPROVAL AND CONSENT TO PARTICIPATE
All the tests were carried out at the Alzheimer Disease Research Centre of the University of Szeged, Hungary. The research was approved by the Ethics Committee of the Uni- versity of Szeged, and all experiments were conducted in accordance with the Declaration of Helsinki.
HUMAN AND ANIMAL RIGHTS
No animal were used in this research. All humans research procedures followed were in accordance with the standards set forth in the Declaration of Helsinki principles of 1975, as revised in 2008 (http://www.wma.net/en/
20activities/10ethics/10helsinki/).
CONSENT FOR PUBLICATION
Patient consent of all participants were obtained.
CONFLICT OF INTEREST
The authors declare no conflict of interest, financial or otherwise.
ACKNOWLEDGEMENTS
László Tóth was supported by the János Bolyai Research Scholarship of the Hungarian Academy of Sciences.
REFERENCES
[1] De Ipiña KL, Alonso JB, Travieso CM, Sol-Casals J, Egiraun H, Faundez-Zanuy M, et al. On the selection of non-invasive methods based on speech analysis oriented to automatic Alzheimer disease diagnosis. Sensors 13(5): 6730-45 (2013).
[2] Kálmán J, Pákáski M, Hoffmann I, Drótos G, Darvas G, Boda K, et al. Early mental test - developing a screening test for mild cogni- tive impairment. Ideggyógyászati Szemle 66(1-2): 43-52 (2013).
[3] Negash S, Petersen L, Geda Y, Knopman D, Boeve B, Smith G, et al. Effects of ApoE genotype and mild cognitive impairment on implicit learning. Neurobiol Aging 28(6): 885-93 (2007).
[4] Boise L, Neal M, Kaye J. Dementia assessment in primary care:
results from a study in three managed care systems. J Gerontol Se- ries A: Biol Sci Med Sci 59(6): 621-26 (2004).
[5] Roark B, Mitchell M, Hosom JP, Hollingshead K, Kaye J. Spoken language derived measures for detecting mild cognitive impair- ment. IEEE Trans Audio, Speech, Lang Proc 19(7): 2081-90 (2011).
Table 5. The accuracy scores using only the significant features.
Method Feature Set Acc. Prec.
Recall
(Sens.) Spec. F1 AUC
Manual 66.7% 79.4% 56.3% 80.3% 65.9% 73.0%
Naive Bayes
Automatic 57.1% 68.8% 45.8% 72.2% 55.0% 61.3%
Manual 69.1% 71.2% 77.1% 58.3% 74.0% 73.4%
Random Forest
Automatic 75.0% 76.5% 81.3% 66.7% 78.8% 67.6%
Manual 65.5% 67.9% 75.0% 52.8% 71.3% 73.4%
SVM
Automatic 64.3% 69.6% 66.7% 61.1% 68.1% 63.9%
[6] Forbes KE, Venneri A. Detecting subtle spontaneous language decline in early Alzheimer’s disease with a picture description task.
Neurol Sci 26: 243-54 (2005).
[7] Hoffmann I, Németh D, Dye C, Pákáski M, Irinyi T, Kálmán J.
Temporal features of spontaneous speech in Alzheimer’s disease.
Int J Speech Lang Pathol 12(1): 29-34 (2010).
[8] Meilán JJG, Martínez-Sanchez F, Carrol J, Sánchez JA, Pérez E.
Acoustic markers associated with impairment in language process- ing in Alzheimer’s disease. Span J Psychol 15: 2081-90 (2012).
[9] Satt A, Hoory R, König A, Aalten P, Robert PH. Speech-based automatic and robust detection of very early dementia. Proc Inter- speech 2014, Singapore, 2538-42 (2014).
[10] Jarrold W, Peintner B, Wilkins D, Vergryi D, Richey C, Gorno- Tempini ML, et al. Aided diagnosis of dementia type through com- puter-based analysis of spontaneous speech. Proc ACL Workshop Comp Linguistics Clin Psychol 27-37 (2014).
[11] Laske C, Sohrabi HR, Frost SM, de Ipiña KL, Garrard P, Buscema M, et al. Innovative diagnostic tools for early detection of Alz- heimer’s disease. Alzheimers Demen 11: 561-78 (2015).
[12] Croot K, Hodges JR, Xuereb J, Patterson K. Phonological and articulatory impairment in Alzheimer’s disease: a case series. Brain Lang 75: 277-309 (2000).
[13] Forbes KE, Venneri A, Shanks MF. Distinct patterns of spontane- ous speech deterioration: a mild predictor of Alzheimer’s disease.
Brain Cogn 48: 356-61 (2002).
[14] Wutzler A, Becker R, Lammler G, Hayerkamp W, Steinhanen- Thiessen E. The anticipatory proportion as an indicator of language impairment in early-stage cognitive disorder in the elderly. Dement Gertatr Cogn Disord 36: 300-9 (2013).
[15] Garrard P, Maloney LM, Hodges JR, Patterson K. The effects of very early Alzheimer’s disease on the characteristics of writing by a renowned author. Brain 128(2): 250-60 (2005).
[16] Taler V, Phillips NA. Language performance in Alzheimer’s dis- ease and mild cognitive impairment: a comparative review. J Clin Exp Neuropsychol 30: 501-56 (2008).
[17] Dos Santos V, Thomann PA, Wüstenberg T, Seidl U, Essig M, Schröder J. Morphological cerebral correlates of CERAD test per- formance in mild cognitive impairment and Alzheimer’s disease. J Alzheimers Dis 23: 411-20 (2011).
[18] Cardoso S, Silva D, Maroco J, de Mendonca A, Guerreiro M. Non- literal language deficits in mild cognitive impairment. Psychogeria- tr 14: 222-8 (2014).
[19] Fraser KC, Meltzer JA, Graham NL, Leonard C, Hirst G, Black SE, et al. Automated classification of primary progressive aphasia sub- types from narrative speech transcripts. Cortex 55: 43-60 (2014).
[20] Garrard P, Rentoumi V, Gesierich B, Miller B, Gorno-Tempini ML. Machine learning approaches to diagnosis and laterality ef- fects in semantic dementia discourse. Cortex 55: 122-29 (2014).
[21] Barth S, Schönknecht P, Pantel J, Schröder J. Mild cognitive im- pairment and Alzheimer’s disease: an investigation of the CERAD- NP test battery. Fortschr Neurol Psychiatr 73: 568-76 (2005).
[22] Juncos-Rabadán O, Pereiro AX, Facaly D, Rodríguez N. Una re- visión de la investigación sobre lenguaje en el deterioro cognitivo level, Revista de Logopedia, Foniatría y Audiología 30(2): 73-83 (2010).
[23] Manouilidou C, Dolenc B, Marvin T, Pirtošek Z. Processing complex pseudo-words in mild cognitive impairment: the interaction of preserved morphological rule knowledge with compromised cognitive ability. Clin Linguistics Phonetics 30(1):
49-67 (2016).
[24] Haeyoon K, Yeonwook K, Kyung-Ho Y, Byung-Chul L. A com- parison of the deterioration characteristics in verbal fluency be- tween amnestic mild cognitive impairment and vascular mild cog- nitive impairment. Commun Sci Disorder 20(4): 587-95 (2015).
[25] Burhan AM, Anazodo UC, Chung JK, Arena A, Graff-Guerrero A, Mitchell DGV. Working Memory Processing in mild cognitive impairment versus healthy controls: an exploratory fMRI study in female participants. Behav Neurol 2016: 1637392 (2016).
[26] American Psychiatric Association. Diagnostic and Statistical Man- ual of Mental Disorders (4th ed, text rev.), DSM-IV-TR. American Psychiatric Association, 2000.
[27] Bayles K. Language function in senile dementia. Brain Lang 16(2):
265-80 (1982).
[28] Kálmán J, Hoffmann I, Hegyi A, Drótos G, Heilmann A and Pákáski M. Spontaneous speech based web screening test for MCI.
Proceedings of ADI 2014 San Juan, Puerto Rico, 315-18, (2014).
[29] Baldas V, Lampiris C, Capsalis C, Koutsouris D. Early diagnosis of Alzheimers type dementia using continuous speech recognition.
Proceedings of MobiHealth, 2010 Oct 18-20 Ayia Napa, Cyprus, 105-10 (2011).
[30] De Ipiña KL, Alonso JB, Solé-Casals J, Barroso N, Henriquez P, Faundez-Zanuy M, Travieso CM, et al. On automatic diagnosis of Alzheimer’s disease based on spontaneous speech analysis and emotional temperature. Cogn Comput 7(1): 44-55 (2015).
[31] Kato Sh, Homma A, Sakuma T. Easy screening for mild alz- heimer's disease and mild cognitive impairment from elderly speech. Curr Alzheimer Res 15(2): 104-110 (2018).
[32] Meilán JJG, Martínez-Sánchez F, Carro J, Carcavilla N, Ivanova O.
Voice markers of lexical access in mild cognitive impairment and Alzheimer's disease. Curr Alzheimer Res 15(2): 111-119 (2018).
[33] König A, Satt A, Sorin A, Hoory R, Derreumaux A, David, R et al.
Use of Speech Analyses within a mobile application for the As- sessment of cognitive impairment in elderly people. Curr Alz- heimer Res 15(2): 120-129 (2018).
[34] Mekyska J, Beitia B, Barroso N, Estanga A, Tainta M, Ecay-Torres M. Advances on automatic speech analysis for early detection of Alzheimer Disease: a non-literal multi-task approach. Curr Alz- heimer Res 15(2): 139-148 (2018).
[35] Lehr M, Prudhommeaux E, Shafran I, Roark B. Fully automated neuropsychological assessment for detecting mild cognitive im- pairment. Proceedings of Interspeech, Portland, OR, USA (2012).
[36] Hall M, Frank E, Holmes G, Pfahringer B, Reutemann P, Witten I.
The WEKA data mining software: an update. ACM SIGKDD Ex- plorations Newsletter 11(1): 10-8 (2009).
[37] Freedman MI, Leach L, Kaplan E, Winocur G, Shulman KJ, Delis DC (Eds.). Clock drawing. Oxford Oxford University Press (1994).
[38] Folstein MF, Folstein SE, McHugh PR. Mini mental state: a practical method for grading the cognitive state of patients for the clinician. J Psychiatric Res 12: 189-98 (1975).
[39] Rosen WG, Mohs RC, Davis KL. A new rating scale for Alzheimer’s disease. Am J Psychiat 141(11): 1356-64 (1984).
[40] Boersma P. Praat, a system for doing phonetics by computer. Glot Intern 5(9-10): 341-45 (2002).
[41] Gósy M. The paradox of speech planning and production. Magyar Nyelvőr (Hungarian Language Guard) 122: 3-15 (1998).
[42] Rapcan V, D'Arcy S, Penard N, Robertson I, Reilly R. The use of telephone speech for assessment and monitoring of cognitive func- tion in elderly people. Proceedings of. Interspeech 2009, Sept. 6- 10. Brighton, United Kingdom, 943-46 (2009).
[43] Fraser K, Rudzicz F, Graham N, Rochon E. Automatic speech recognition in the diagnosis of primary progressive aphasia. Pro- ceedings of SLPAT, Grenoble, France, 47-54 (2013).
[44] Szabó L, Tarján B, Mihajlik P. and Fegyó T. Speeding up error correction in a Hungarian dictation system (in Hungarian), Proceedings of MSZNY, 182-91 (2015).
[45] Ramabhadran B, Huang J, Picheny M. Towards automatic tran- scription of large spoken archives – English ASR for the MALACH project. Proceedings of ICASSP, 2003, April 6-10, Hong Kong, 216-19 (2003).
[46] Gósy M. BEA: a multifunctional Hungarian spoken language data- base. The Phonetician 105(106): 50-61 (2012).
[47] Tóth L. Phone recognition with hierarchical convolutional deep maxout networks. EURASIP Jon Audio, Speech, and Music Proc- essing 25: 1-13 (2015).
[48] Tóth L, Gosztolya G, Vincze V, Hoffmann I, Szatlóczki G, Biró E, et al. Automatic Detection of mild cognitive impairment from spontaneous speech using ASR. Proc Interspeech 2015; Dresden, Germany 2694-98 (2015).
[49] Lewis DD. Naive (Bayes) at forty: the independence assumption in information retrieval. Machine Learning: ECML-98, 4-15 (2005).
[50] Schölkopf B, Platt J, Shawe-Taylor J, Smola A, Williamson R.
Estimating the support of a high-dimensional distribution. Neural Computation 13(7): 1443-71 (2001).
[51] Breiman L. Random forests. Mach Learn 45(1): 5-32 (2001).
[52] Hastie T, Tibshirani R, Friedman J. The elements of statistical learning – Data mining, inference and prediction. Springer (2008).