Exploring Effectiveness Reserves in Hospitals with the DEA
Method
Daniella Kucsma
University of Miskolc
kucsma.daniella@uni-miskolc.hu
Krisztina Varga
University of Miskolc
varga.krisztina@uni-miskolc.hu
summary
In our study, we undertake a relative efficiency analysis of hospitals providing inpatient care, which play a key role in the Hungarian health care system. According to the competitiveness Report 2020 of the Hungarian National Bank, the Hungarian health care system has a number of reserves, and the sustainability of the system can be improved by using these reserves. In the 2015-2019 period, particular attention has been paid to the identification of achievable and meaningful indicators in the sector under review. The relative effectiveness analysis (DEA) method can be used to address this challenge. The units of our analysis are state-owned institutions in Hungary, typologised by the total number of beds. General profile hospitals with a bed count between 600 and 1200 beds were included in the analysis. The results of running the programme have clearly shown that there are some institutions that do not operate as efficiently as the majority of the organisations included in the study, but further research and refinement of the indicators is needed to determine the practical application of the pilot studies.
Keywords: hospital, effectiveness analysis, DEA method JEL codes: I14, H11
DoI: https://doi.org/10.35551/PFQ_2021_s_2_4
T
The aim of our study is to examine the relative effectiveness of general profile inpatient hospitals with a 600-1200 bed capacity, which play a key role in the Hungarian health care system. our research question is what results (outputs and outcomes) were achieved by the hospitals in Hungary between 2015-2019, and what and how much resources they used for that.A key objective of performance-based auditing is the effectiveness-based assessment of the organisations involved (Pulay, simon, 2020; Veresné somosi, Hogya, 2011), which allows for the formulation of recommendations to increase operational effectiveness, in addition to relative effectiveness assessment.
When comparing different organisations, there is usually no single indicator available that expresses all the key elements of the organisation’s performance, and the data included in the analysis cannot always be expressed in the same dimension (Koltai, Tamás, 2019). In the analysis, particular attention should be paid to identifying the indicators that are available and meaningful in the sector/sector under study. This challenge can be addressed by the relative effectiveness analysis (DEA) method, which has a mathematical background in linear programming.
Literature review
The study of hospital effectiveness is becoming increasingly important, as the effectiveness reserves of hospitals are a central issue.
According to the competitiveness Report of Magyar Nemzeti Bank, the Hungarian healthcare system has a number of reserves that could be exploited to improve the sustainability of the system (e.g. in 2017, bed occupancy was 66 per cent and the average hospital stay is 2 days longer than in the Euro- pean union (MNB, 2020).
The improvement of healthcare institutions is based on knowledge and measurement of operational effectiveness (Dénes et al., 2017).
Hospitals in Hungary can be differentiated according to various criteria (Dózsa, Ecseki, 2012):
• central – non-central hospitals,
• hospital groups by owner,
• groups according to progressivity levels (small town, city, county, university hospitals).
Based on these factors, the measurement of performance and effectiveness is a complex task, which requires the use of methods that address the different scales of assessment criteria measured in different dimensions (Dénes et al., 2017; Koltai, Tamás, 2019). This challenge is addressed by the DEA analysis.
The DEA method not only calculates the absolute effectiveness of a given unit, but also gives a ratio, which is a function of the effectiveness of the unit analysed in relation to the data of all the units included in the study (Lapid, 1997).
The DEA method is a performance evaluation technique based on the work of Farrell (1957), formalised by Charnes et al.
(1978) and further developed by Banker et al.
(1984), which can be identified as a decision support tool for management (Tamás, Koltai, 2020). After a structured screening of the literature, it can be concluded that the application of the relative effectiveness analysis (DEA method) can be extended to a number of areas (restaurant analysis: Reynolds, Thompson, 2007; hotel analysis: Hwang, chang, 2003; assessment of higher education:
Johnes, 2006; analysis of simulation games:
Tamás-Koltai, 2020), however, the frequency with which the method is used in effectiveness testing of health care providers can be clearly identified. Barnum et al. (2009) examine the performance of hospital pharmacies, while Dénes and colleagues (2017) analyse
the relative effectiveness of musculoskeletal rehabilitation departments in Hungary.
Dózsa and Ecseki (2012) examine the domestic hospital sector, while Nepomuceno (2020) presents an effectiveness study of the evacuation of hospital beds necessitated by the covid-19 pandemic using the DEA method in response to recent changes.
The DEA method can be defined in two approaches: input-oriented (cost-oriented) and output-oriented (result-oriented). When measuring effectiveness, we also have to take into account that not all inputs are utilised in the same way: if we expect the same level of resource incorporation, we should expect a constant rate of return (cRs - constant Return to scale), if not, we should expect a variable rate of return (VRs - Variable Return to scale) (Gál, Komlósi, 2010).
MethodoLogy
The DEA (Data Envelopment Analysis) method defines the effectiveness values (ra- tio) and the effectiveness frontier as a linear programming task. It has the advantage of be- ing non-parametric, because knowledge of the production function is not a prerequisite (Dó- zsa, Ecseki, 2012).
In the analysis, the effectiveness scores of the decision-making units are compared, with the unit with the highest effectiveness scoring 1 (100 per cent). The procedure is used to calculate an effectiveness threshold (best practice), which is used to determine an effectiveness ranking (each unit is ranked in percentage terms).
The analysis compares organisations performing the same activity on the basis of the outputs of each organisation and the weighted share of inputs used. Input is the quantity of resources that is decisive for the evaluation. output is any significant
operational result for which the organisation uses resources. The amount of resource used is an autonomous decision of the organisation, so the organisation can be identified as a Decision Making unit (DMu). The comparison of DMus is based on the ratio of the weighted sum of outputs to the weighted sum of inputs. Weighting can be determined objectively, using mathematical tools, based on the characteristics of the organisations.
Determining the ratio of weighted inputs to outputs can be done for two purposes:
• maintaining the current value of outputs with fewer inputs (input-oriented approach, relative effectiveness index between 0 and 1),
• higher output at the current value of inputs (output-oriented approach, relative effectiveness ratio between 1 and infinite).
The effectiveness function is the weighted sum of outputs divided by the weighted sum of inputs (Ragsdale, 2007; Iberhalt, 2017):
Ei =
∑
no Oijwjj =1 (1)
∑
nj =1i Iijvjwhere:
Ei : effectiveness of the i-th unit
Oij: weighted value of the j-th output factor of the i-th unit
no: number of outputs
wj: evaluation of a unit of the j-th output lij: weighted value of the j-th input factor of the i-th unit
ni: number of inputs
vj: evaluation of a unit of the j-th input The formula can be used to determine the effectiveness of the “i”-th unit, based on the weighted output and input components of the unit. This function is the basis for the DEA, which is run for all hospitals in the analysis.
In connection with the run, the balance
sheet conditions for the DEA analysis are defined (Ragsdale, 2007; Iberhalt, 2017).
The balance conditions of the analysis are constraints that ensure that maximum effectiveness can be identified.
Balance conditions:
1 No unit tested can have an effectiveness greater than 100 per cent. The effectiveness of each hospital is thus less than or equal to 1.
∑nj=1o Okjwj ≤ ∑nj=1i Ikjvj (2)
(k=1, 2, ... , number of units analysed), i.e.,
∑nj=1o Okjwj – ∑nj=1i Ikjvj ≤0 (3)
2 output evaluations (w1, w2, w3, w4) and input evaluations (v1, v2, v3, v4) can be used to maximise effectiveness at the “i”-th unit (effectiveness indicator value 1).
3 It is necessary to ensure that input costs and output valuations are strictly positive.
Because if, e.g., wj = 0 then DEA cannot find those non-effective solutions, which contain the j-th output; and if vj = 0, then DEA is unable find non-effective solutions that contain the j-th input (Iberhalt, 2017).
Based on the effectiveness measurement function and the balance conditions, a linear programming exercise can be performed for each hospital under study, with the aim - in the context of this study - to minimise the weighted inputs of each unit.
The objective function of the model:
∑nj=1i Iijvj → MIN (4) Based on the literature (Barnum et al., 2009; Dózsa, Ecseki, 2012; Dénes et al., 2017; Iberhalt, 2017; Koltai, Tamás,
2019; Nepomuceno et al., 2020) and the methodology developed, input and output indicators can be identified to support the measurement of relative effectiveness, which also allow the development of a relative effectiveness ranking for the hospitals under study.
Survey
In the framework of this study, we present the main results of the survey conducted between 2015 and 2019.
For the institutions included in the analysis, difficulties such as limited resource management can be identified, so it is worth identifying a best practice in effectiveness and benchmarking against it. This step will support the institutions to become aware of a good practice that can be used to model effectiveness processes and implement them in their own institutions.
The study was conducted using an input- oriented approach, where we aimed to minimise inputs for a given level of output.
The scale-insensitive cRs model assumes the same rate of resource incorporation (output/
input ratio unchanged). The method presented in this study assumes a constant return on scale factor, i.e. perfect substitutability of outputs at a fixed rate. In the literature, this condition is referred to as cRs (constant Return on scale) or ccR (charnes-cooper-Rhodes) (EIF).
A major advantage of the method is that the determination of reduced input values is not arbitrary (Dózsa, Ecseki, 2012).
As a starting step, we looked for input and output indicators (potential indicators are described in Table 1). The indicators have been selected primarily to test the method, but more research is needed to select the right indicators before the actual effectiveness study. In this selection, we have identified as a main objective
both to ensure that the indicators used are significant and to avoid multicollinearity. In addition, the selection criteria are availability, appropriateness for the purpose and relevance.
Many of the variables identified as a result of the international outlook are available only to a limited extent in national central statistics, which is also a limitation of the analysis.
Taking these factors into account, limitations of the effectiveness analysis for domestic hospitals can be identified:
• the small number of variables that can be included based on available statistical data,
• the lack of standardisation (e.g. job classification),
• the performance volume limit (the limit on how much of a given health service a hospital can provide in a month. Each year, the state determines how much a hospital can receive per month for different types of care, and how much of the excess the hospital will be paid by NEAK if it exceeds the limit),
• the complexity of ownership (public and private).
The indicators included in the study are shown in Table 2.
To support effectiveness audits of hospitals, a set of indicators can be defined, which can be broken down into input and output indicators, following the DEA methodology.
In the analysis of hospitals, 4 indicators were included in each indicator group.
As a first step, we looked for indicators in each area and made the following suggestions:
• the source of the indicators is the database of the central statistical office (2015-2019) and the budget reports of the individual institutions (the budget reports are processed from the crefoPort database),
• for the indicators, an average of 5 years has been included in the analysis, allowing year-to-year fluctuations to be filtered out (while taking structural changes into account),
• the analysis looked for a link between Table 1 Potential indicators to be included in the analysis
(to test the method)
input output
• number of beds (number)
• number of physicians (persons)
• number of nurses (persons)
• non-medical staff (administrative staff)
• total staff (persons)
• tools (number)
• total cost (huF)
• other cost (huF)
• health expenditure per capita (huF)
• outpatient (persons)
• number of nursing days (number)
• other case (care, number)
• total cases (care, number)
• number of surgeries (number)
• inpatient care (huF)
• per capita surgical care (huF)
• other service (number)
• income (huF)
Source: own edited
performance and actual performance (the difference between the expected maximum and the actual performance in relation to the organisation’s capabilities).
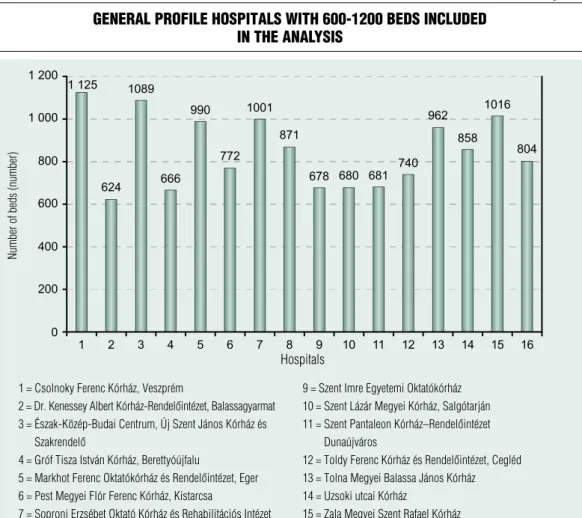
The list of hospitals included in the analysis is presented in Figure 1. The units of the DEA analysis are state-run institutions in Hungary, and each unit is typologised according to the total number of beds. county hospitals with between 600 and 1200 beds were included in the analysis. The list of hospitals is not exhaustive, as we have not looked at institutions that typically serve one area (e.g. psychiatry).
Next to the names of the hospitals, the number of beds is stated, which was determined on the basis of the cso database (for the year 2019).
In the database, hospitals have been processed out of order and not by name to ensure anonymity, which is why the institutions are indicated by letters (A-P) when presenting the results of the study.
our DEA analysis was based on a database defined on the basis of pre-defined indicator values. The analysis focuses primarily on efficient operation, where the maximum value assigned to each unit is 1 (100 per cent). The procedure calculates best practice threshold based on the data of the best performing decision-making units, i.e. those with an effectiveness score of 1, and then
gives a percentage of the effectiveness reserves of the poorest performing hospitals. This suggests that institutions with an effectiveness index of 1 are operating with a reliable level of effectiveness. For hospitals that do not achieve the maximum value relative to the best value of the indicator, it is worthwhile to conduct a more in-depth analysis, as there is a difference in their operations compared to other institutions.
A unit is non-effective if the value of the effectiveness indicator is less than 1, so the study concludes that five hospitals are non- effective (institutions marked with the letters B, D, H, N, P). The lowest score went to the hospital marked with N (0.9797), so there is room for improvement for this institution as well. Figure 2 shows a predominance of values of 1 or close to 1, which requires a demonstration of the practical side of the methodology. The DEA analysis has a mathematical background, but it also performs a comparison, so that the best value is selected from the given indicators. This highlighting provides the basis for comparison with the best value of the indicator under the DEA method. This comparison allows differences to be identified, so that effectiveness can be assumed on the basis of the relative values.
Table 3 presents the comparisons based on Table 2 indicators included in the analysis
input indicators output indicators
• number of active hospital beds (number)
• total staff (persons)
• number of nursing days that can be completed (number)
• number of beds actually in operation (number)
• number of patients discharged (persons)*
• number of nursing days completed (number)
• total income (huF)
Remark: * total of patients discharged, transferred to another ward and patients who died.
Source: own edited
the institutions for which the DEA method calculated a value of 1 (effectiveness) based on the indicators provided by our database, and which institutions were given a different score (non-effective). Those institutions for which effectiveness cannot be assumed on the basis of a comparison with the best institution have been compared with other institutions.
The table shows that the highest number of comparisons (5 associations) were made between D- and H-marked hospitals, which supports the results in Table 3. In a detailed
study, it is worthwhile to make and analyse a comparison that shows which input values need to take on a different value to achieve the desired effectiveness. For this question, it is necessary to examine the non-effective hospitals described in Table 4. our tests were input-oriented, i.e. we aimed to minimise the input for a given level of output. The method assumes a constant return on scale factor, i.e.
perfect substitutability of outputs at a fixed rate. Table 4 and Table 5 show the input and output values, respectively.
Figure 1 General Profile hosPitals with 600-1200 beds included
in the analysis
Source: own edited (based on CSo database) 1 = Csolnoky Ferenc Kórház, veszprém
2 = Dr. Kenessey Albert Kórház-Rendelőintézet, Balassagyarmat 3 = Észak-Közép-Budai Centrum, Új Szent János Kórház és
Szakrendelő
4 = Gróf Tisza István Kórház, Berettyóújfalu
5 = Markhot Ferenc Oktatókórház és Rendelőintézet, Eger 6 = Pest Megyei Flór Ferenc Kórház, Kistarcsa
7 = Soproni erzsébet oktató Kórház és rehabilitációs intézet 8 = Szent Borbála Kórház, Tatabánya
9 = Szent imre egyetemi oktatókórház 10 = Szent Lázár Megyei Kórház, Salgótarján 11 = Szent Pantaleon Kórház–Rendelőintézet
Dunaújváros
12 = Toldy Ferenc Kórház és Rendelőintézet, Cegléd 13 = Tolna Megyei Balassa János Kórház 14 = uzsoki utcai Kórház
15 = Zala Megyei Szent rafael Kórház 16 = Bajcsy-Zsilinszky Kórház és Rendelőintézet
Number of beds (number)
hospitals
overall, after reviewing the tables, it can be concluded that the input and output values are correlated. It is worth noting that the targets in Table 4 take a different value from the actual value (this is in bold italics in the table for non- equivalence). The target value represents the indicator that can be identified as the optimal value in relation to the indicators of the institution with high effectiveness. This can be explained by the fact that the programme is proportionate to the indicators of efficient operation. All this suggests that if the target were met, each institution would operate more effectively than at present.
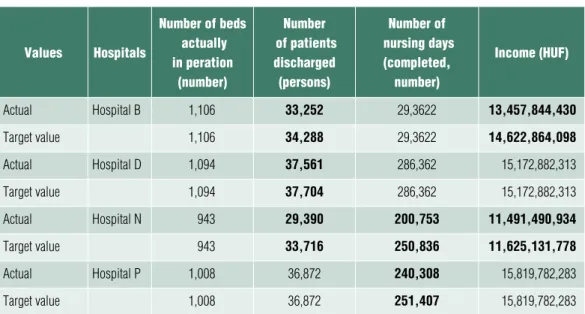
It is more interesting to observe the output values, since, as shown in Table 5, no correction from the output side is needed for the hospital marked H, and therefore it is not marked separately in the table (this is also reflected in the effectiveness, since its value
is 0.999). For this hospital, full effectiveness could be assumed if no corrections were needed in the input rows. For the other institutions, the correction is reflected in the number of patients discharged, which typically took a value below the target value, and the evolution of the number of nursing days and the value of the income needs further examination (area in bold italics in Table 5).
All this suggests that there are institutions, where 3 indicators are below target on the output side, but there are also institutions (D and P labelled institutions) where only 1 indicator can be identified, indicating non- appropriateness. In the cases outlined above, it is worth analysing the results of the survey in more detail, and for these indicators within the institution, we recommend a deeper analysis to help the organisation achieve a higher level of effectiveness. It should be stressed, however, Figure 2 relative effectiveness analysis (county hosPitals)
Source: own edited (based on CSo data and budget reports)
hospitals
that there is no significant difference between the effectiveness values based on this analysis.
The deviations found by the DEA model only shed light on certain problems of non- effective units, the causes of non-effectiveness and the extent to which critical factors deviate from optimal. Accordingly, the information revealed by this analytical method can serve as a useful exercise for organisational management to plan and implement changes in which areas and in which direction to improve effectiveness.
In view of the above, it is worth mentioning that implementing and running the DEA methodology is a necessary step for an organisation, as it enables the organisation to measure whether the strategic objectives previously set have been met, i.e. whether the
organisation is operating effectively or not.
However, it is not sufficient to fully test an organisation, because if an organisation does not get the desired results, it is necessary to incorporate additional models and methods to correct these errors. However, the DEA is a very flexible methodology for identifying or defining failures, as it is able to compare institutions and highlight good practices based on specific indicators.
SuMMary
The effective functioning of organisations and the measurement of their effectiveness is a key issue in all healthcare institutions. In our study, we have presented a methodology Table 3 Procedural method for comParinG hosPitals
column1 matching 1 matching 2 matching 3 matching 4 matching 5
hospital a hospital a - - - -
Hospital B hospital e Hospital J hospital K hospital M -
hospital C hospital C - - - -
hospital d hospital C Hospital J hospital K hospital M hospital o
hospital e hospital e - - - -
hospital F hospital F hospital M - - -
hospital g hospital g - - - -
hospital h hospital e hospital F Hospital J hospital K hospital M
hospital i hospital i - - - -
Hospital J Hospital J - - - -
hospital K hospital K - - - -
hospital L hospital L - - - -
hospital M hospital M - - - -
hospital N hospital e Hospital J hospital K - -
hospital o hospital o - - - -
hospital P hospital a Hospital J hospital K hospital o -
Source: own edited (Based on DEA software)
Table 5 a nemhatékonynak bizonyult kórházak vizsGálatba bevont outPutmutatói
értékeinek összehasonlítása a célértékekkel
values hospitals
number of beds actually in peration
(number)
number of patients discharged (persons)
number of nursing days
(completed, number)
income (huf)
actual Hospital B 1,106 33,252 29,3622 13,457,844,430
target value 1,106 34,288 29,3622 14,622,864,098
actual hospital d 1,094 37,561 286,362 15,172,882,313
target value 1,094 37,704 286,362 15,172,882,313
actual hospital N 943 29,390 200,753 11,491,490,934
target value 943 33,716 250,836 11,625,131,778
actual hospital P 1,008 36,872 240,308 15,819,782,283
target value 1,008 36,872 251,407 15,819,782,283
Source: own edited (based on CSo data and budget reports)
Table 4 comParison of the inPut indicator values of the hosPitals in the study that
were found to be non-effective with the tarGet values values hospitals
total number of active hospital
beds (number)
staff (total, persons)
number of nursing days (possible to complete, number)
expenditure (huf)
actual Hospital B 1,119 1,903 404,161 13,693,839,288
Target value 1,107 1,516 399,869 13,548,428,381
actual hospital d 1,120 1,551 398,645 14,784,318,386
Target value 1,097 1,529 393,067 +14 577 463 943
actual hospital h 1,001 1,398 354,536 9,205,194,672
Target value 975 1,230 354,358 9,200,591,188
actual hospital N 966 1,789 343,932 11,761,291,112
Target value 946 1,320 336,957 11,522,783,033
actual hospital P 1,026 1,671 368,716 15,160,298,225
Target value 1,016 1,506 363,185 15,016,175,232
Source: own edited (based on CSo data and budget reports)
that could be a solution for measuring effectiveness. The DEA method is based on the definition of input and output indicators for organisations (indicators that contribute to the operation on the one hand, and indicators that are created after the operation on the other hand). our study clearly supports the view of Lapid (1997) that the DEA method has the advantage of not only calculating the effectiveness of a particular unit, but also of displaying comparative figures. The focus of the method is the definition of best practice, which represents 100 per cent, i.e.
1 effectiveness, and thus forms the basis for comparison (Dózsa, Ecseki 2012). In developing the methodology, pairs of input and output indicators were formulated for easier comparability and quantification. Examples of indicator pairs are revenue and expenditure, or the number of active beds and the number of beds actually in operation. Furthermore, in order to avoid bias, the typologisation of
health institutions has become a necessity. We selected general profile hospitals with between 600 and 1200 beds for the analysis, as their size allowed for comparability. The results of running the DEA programme have clearly shown that there are some institutions that do not operate as efficiently as the majority of the organisations included in the study.
The methodology is highly recommended for comparing the operational effectiveness of institutions with a similar profile, subject to certain limitations. current research is still testing and piloting the methodology, and further research and refinement of the indicators are needed to put it into practice.
Quality is a key factor in competitiveness, which is also a determining factor when assessing healthcare providers. Based on the current testing, it can be concluded that the institutions are comparable in this sector as well, and the DEA method provides a good basis for effectiveness testing. ■
Banker, R. D., charnes, A., cooper, W. W.
(1984). some Models for Estimating Technical and scale Inefficiencies in Data Envelopment Analysis.
Management Science, 30(9), pp. 1078–1092, http://dx.doi.org/10.1287/mnsc.30.9.1078
Barnum, D. T., Karlaftis, M. G., Tandon, s.
(2009). Improving the Efficiency of Metropolitan Area Transit by Joint DEA of Its Multiple Providers.,
http://dx.doi.org/10.2139/ssrn.1399091
charnes, A., cooper, W.W., Rhodes, E.
(1978). Measuring the efficiency of decision making units. European Journal of Operational Research, 2(6), pp. 429–444,
https://doi.org/10.1016/0377-2217(78)90138-8
Dénes R. V., Koltai T., uzonyi-Kecskés J., Dénes Z. (2017). A magyarországi mozgásszervi rehabilitációs osztályok relatív hatékonyság vizsgálata (DEA) [Analysis of the relative effectiveness of musculoskeletal rehabilitation departments in Hungary (DEA)], IME – Interdiszciplináris Magyar Egészségügy, (Interdisciplinary Hungarian Healthcare) Vol. XVI. No. 1
Dózsa cs., Ecseki A. (2012). Fókuszban a hazai kórházszektor. (The domestic hospital sector in focus.) Egészségügyi Gazdasági Szemle, 2 (Health Economic Review 2)
Farrell, M. J. (1957): The measurement of productive efficiency. Journal of the Royal Statistical Society: series A (General), 120(3), pp. 253–281, https://doi.org/10.2307/2343100
References
Gál T., Komlósi I. (2010). sztochasztikus Data Envelopment Analysis (DEA) alkalmazása magyarországi tehenészeti telepek hatékonyságának mérésére. (Application of stochastic Data Envelopment Analysis (DEA) to measure the effectiveness of dairy farms in Hungary.) Acta Agraria Kaposváriensis, (14)3, pp. 195–203
Hwang s-N, chang, T-Y (2003). using data envelopment analysis to measure hotel managerial efficiency change in Taiwan. Tourism Management, Vol. 24, No. 4, pp. 357–369,
https://doi.org/10.1016/s0261-5177(02)00112-7 Iberhalt, M. (2017). A DEA elemzési módszer gyakorlati alkalmazásának bemutatása egy konkrét mezőgazdasági vállalkozás példáján keresztül. (The introduction of the practical application of the DEA method by the example of a specific agricultural company.) E-CONOM, 7(1), pp. 31–42,
https://doi.org/10.17836/Ec.2017.1.031
Johnes, J. (2006). Data envelopment analysis and its application to the measurement of efficiency in higher education. Economics of Education Review, 25(3), pp. 273–288
Koltai T., Tamás A. (2019). Relatív hatékonyságvizsgálat (DEA) alkalmazása az államigazgatásban: gyakorlati eredmények és elméleti problémák. (The use of relative effectiveness analysis (DEA) in public administration: practical results and theoretical problems.) Mérleg és Kihívások»
XI. Nemzetközi Tudományos Konferencia (Balance and challenges XI International scientific conference), Miskolci Egyetem Gazdaságtudományi Kar (university of Miskolc, Faculty of Economics, Miskolc, Hungary, pp. 183–194
Lapid K. (1997). A gazdasági hatékonyság számí- tása DEA lineáris programmal (calculation of economic effectiveness with DEA linear program) Statisztikai Szemle (statistical Review), http://www.ksh.hu/statszemle_
archive/1997/1997_06/1997_06_515.pdf
Nepomuceno, T. c. c., silva, W. M. N., Nepomuceno, K. T. c., Barros, I. K. F. (2020).
A DEA-Based complexity of Needs Approach for Hospital Beds Evacuation during the coVID-19 outbreak. J Healthc Eng,
https://doi.org/10.1155/2020/8857553
Pulay Gy., simon J. (2020). A közpénzügyi gazdálkodás makrogazdasági teljesítményének mérése. (Measuring the macroeconomic per- formance of public finance management.) Pub- lic Finance Quarterly, (special issue no. 1), pp.
23–43,
https://doi.org/10.35551/PsZ_2020_k_1_2 Ragsdale, c. T. (2007). Spreadsheet Modelling
& Decision Analysis: A Practical Introduction to Management Science. Fifth Edition, Thomson
Reynolds, D., Thompson, G. M. (2007).
Multiunit restaurant productivity assessment using three-phase data envelopment analysis. International Journal of Hospitality Management, 26(1), pp.
20–32,
https://doi.org/10.1016/j.ijhm.2005.08.004
Tamás A., Koltai T. (2020). A relatív hatékonyságvizsgálat (DEA) alkalmazása üzleti szimulációs játékban nyújtott teljesítmény értékelésére. (The use of relative effectiveness analysis (DEA) to evaluate performance in a business simulation game.) Vezetéstudomány (Budapest Management Review) 51 (special issue), pp. 85–
100,
https://doi.org/10.14267/VEZTuD.2020.KsZ.08 Veresné somosi, M., Hogya o. (2011).
Performance management. Nemzeti Tankönyvkiadó (National Textbook Publisher)
Magyar Nemzeti Bank (2020). Versenyképességi Jelentés (competitiveness Report) ISSN2560- 1261 Budapest https://www.mnb.hu/letoltes/
versenykepessegi-jelentes-hun-2020-0724.pdf
Nemzeti Fejlesztési Ügynökség (National Development Agency) (somogyi cs. Á. author).
Data Envelopment Analysis módszertan alkalmazási lehetőségei a 2007–2013-as időszaki NsRK- támogatási intézményrendszere hatékonyságának
vizsgálatában (Possibilities of applying the Data Envelopment Analysis methodology to assess the effectiveness of the institutional system of the 2007- 2013 NsRF funding period), Központi Monitoring Főosztály (central Monitoring Department)