A
András Kecskés
Price Movements of IPO Stocks during the Lock-Up Period
Summary: The main question of the study is whether there is a relationship between the success of stock market launches, i.e.
initial public offerings (IPOs), in innovative industries and the stock price movements in the first six months after the IPO.
The starting point is the examination of the efficient market theory and the analysis of the types of secondary market price stabilisation processes. Seventy IPOs with shares that had been launched and traded on NASDAQ for at least six months before August 2017 constitute the data examined. The period examined is only six months, as this was the so-called lock-up period.
The study focused on the fact that not every IPO in the sample was successful, as indicated by returns and stock prices. The first hypothesis of the author is that the IPO price has a substantial influence on later returns. The second hypothesis stipulates that sector characteristics have an effect on the success of the IPO, and that there are significant differences between the sectors examined regarding return and stock price indicators. Descriptive statistics have clearly shown that for a significant part of the companies the stock market launch was not successful, as shares generated a negative return for investors and owners, and according to the stock prices, the assets of owners decreased by 60 percent from their initial investment. At the first hypothesis, a partial correlation was established, but the IPO price has no effect on later returns mostly. It has been confirmed, however, that performances move in the same direction, which means return levels are correlated, and if a company’s performance is good in the first thirty days, it is likely to be successful in the future as well in terms of returns. The second hypothesis has been partly confirmed, differences among sectors, stock prices and returns have only been found in a few cases. It is important to note, however, that the first six months on the stock exchange do not provide adequate predictions about the future of the company, as we have seen with the shares of Facebook.
KeywordS: IPO, NASDAQ, capital market JeL codeS: K22, D53
A classic solution for business associations to raise capital is the initial public offering (IPo).
Going public is an important test of business maturity. After raising small amounts of pri- vate capital from a very limited number of in-
vestors, when a company goes public its shares become available for every stakeholder on the market. This transaction on the capital mar- ket, however, is just the beginning of a long process: After going public and entering the world of professional investors, the manage- ment of the company is under a new and in- cessant pressure to perform. This is also an in- E-mail address: kecskes.andras@ajk.pte.hu
dicator of business maturity (Lentner, 2002).
Before the stock market launch, the compa- ny steps into the limelight, presenting its busi- ness plan at an international roadshow. Large, portfolio-based asset management companies, with assistance from the investment bank han- dling the IPo as an advisor, learn about the company and decide whether to take part in the transaction or not. Highly successful and failed IPos get substantial media coverage, and considerable profits can be achieved in a relatively short period of time with these in- vestments.
The decisive factor, however, is the appro- priate and attractive price.
In an analysis of pricing practices, the pe- riods before and after the dot-com crash must be viewed separately. Before 2000, in many cases there was intentional underpricing, the IPo price was set low so that the investment services provider handling the subscription would give its key clients an advantage with the underpriced shares allocated during the IPo. clients in this favourable position could make considerable capital gains in the initial days of the IPo with this practice, which is called spinning (Lavigne et al., 2011; Mantell, 2016). A Voluntary Initiative was introduced by the self-regulatory body FINRA in 2003 to curb this phenomenon, and FINRA rule 5131 introduced restrictions regarding the alloca- tion of shares to the executive officers of the is- suer during the IPo, and an obligation of the lead underwriter to continuously provide in- formation to the issuer about investor inter- est during the pricing period. As a result, un- derpricing has significantly decreased in the us at IPos. overpricing is less prevalent and the reputational risk for the investment service provider handling the subscription is dissua- sive enough. This pricing problem can be de- scribed with the concept of information asym- metry: The lead underwriter has significantly more information than the issuer and retail in-
vestors and can use this to their benefit. With the issuer, it is underpricing, with retail inves- tors, it is overpricing. Retail investors have the least amount of information about the issuing company, in their case there is also the risk of adverse selection decreasing the chance of re- ceiving a return on their investment (Mantell, 2016).
For existing private investors to achieve re- turns proportionate to the risks they took and to make selling their shares worthwhile, and for the years of work by the founders/own- ers to be acknowledged by the market, a price must be set that is attractive enough for them to sell their shares. The standard deviation of initial IPo returns shows if price-setting was adequate. This suggests that there is a signif- icant difference between the standard devia- tion of the two selling techniques, subscrip- tion at the set price based on the price range and auctions, in favour of the latter. (Lowry et al., 2006) This way an appropriate supply of shares can be ensured. For new investors, how- ever, the possibility of further significant re- turns is also important, as this is the basis of adequate demand. This means the IPo price must be low enough for new investors. This is a price that allows new investors to realise fur- ther capital gains. Finally, a price range must be set, taking the interests of the supply and the demand side into consideration, so that the participants of the IPo can decide how many shares and at what price they want to sell or buy. Empirical research has shown that the success of the IPo pricing depends large- ly on the time of the IPo. The standard devi- ation of initial IPo returns is lower during an upward trend than during a sideways drift or a downward trend (Lowry et al., 2006).
As the subscription of shares is a binding offer, this decision requires careful considera- tion, and for that the data in the prospectus (which is sometimes several hundred pages long) can provide some guidelines. Why just
guidelines? Because in this period, the business model is typically being tested, and the long- term viability of the model on the market, i.e.
the profit-generating ability of the company, is only visible in the long term (Bács, Lukács, Turóczi, Zéman, 2016). companies often en- ter the capital market at such an early stage of their life cycle and the market is so competi- tive, that it takes years to gain actual profits, and sometimes developments sweep away the business model and profit expectations are not or not fully met. Empirical research has shown that the success of the IPo pricing depends largely on the type of the issuing company as well. If the issuer is a firm that is difficult to value (recently established, small tech firms), the standard deviation of the IPo returns is much higher than at issuers with a longer his- tory that are active in traditional industries (Lowry et al., 2006).
In the latter case, capital gains also fall short of expectations, and as disappointed investors sell their shares, it leads to a further decrease in the stock price. Besides, new, disruptive technologies may appear that are significant- ly different from the previous business model, so much so that they disrupt this model com- pletely (Bujtár, 2018). Whether such disrup- tive technologies are commercially viable is only determined in the medium or long term.
Whichever scenario it is, failure or success, to clearly and finally determine whether the new technology is viable on the market, sometimes it needs to be present on the market and, in our case, on the stock exchange for years.
The aim of the study is to examine the IPos of NAsDAQ1 from the previous year – as this is the stock exchange that lists and predom- inantly represents innovative industries – to answer the question whether the stock price movements in the first six months predict the success of stock market launches.
Before giving a detailed description of the present research, it should be noted that based
on his previous research, the author has al- ready analysed distortive effects that have a significant impact on trading in the first six months after the stock market launch (Kecs- kés, Halász, 2011). The first period after the IPo attracts special attention from investors and major media coverage. A successful mar- ket launch can significantly increase the de- mand for the securities of a company, and it has a major impact on its long term reputa- tion. At the same time underwriters want to make quick profits after the initial issue and want to quickly realise the capital gains that have accumulated on paper since the stock market launch. This is why it is important for investment service providers handling the IPo – in the us investment banks – to main- tain the stock price. With the exit of previous investors on the supply side, stock prices can start going down. The lock-up period was cre- ated to restrict this phenomenon (it is typi- cally 180 days on the stock markets in the us ), which postpones this price depressing ef- fect from the supply side. Lock-up periods in the us are typically shorter. In the Eu, how- ever, lock-up periods are typically longer, in the uK it is 600 days. Empirical research has not found significant changes between stock price movements during and after the lock- up period, with the exception of the us, on the day of the expiry. The fact that there is no such change confirms that the lock-up period is necessary and that it fulfils its purpose, i.e.
it decreases the fall in the stock price (Goer- gen et al., 2004).
MODelS OF The behAvIOur
OF cAPITAl MArKeT STAKehOlDerS
several models have been created in econom- ics for the operation of market participants, but no model has perfectly described the oper- ation of the market. The main reason for this is
the complexity of such large-scale and perma- nently numerous transactions of human be- haviour.
The models of adaptive and rational expectations
To be able to understand the specific events of the capital market, it is important to un- derstand what drives market operators. Mar- ket operators rely on their expectations when they make decisions. These expectations may be formed based on past data, current market information or an estimate about the future.
until the 1950s and 1960s, economists as- sumed that future economic events are defined by past experience. According to this model, they assumed that if inflation was three per- cent in the past ten years, it will be around three percent in average in the coming years, too. When you expect that future changes will happen slowly, according to the changes in past data, it is called adaptive expectations (Bélyácz, 2013).
However, because of the increasing amounts of information and some chang- es that had shock effects, it has become clear that the model of adaptive expectations can- not adequately describe future expected val- ues. Just think about how the oil crises in the 1970s changed the global economy and how the scandals of some corporations can change the operating environment of a whole indus- try. As a result of such events, decision-mak- ers quickly change their previous expectations.
John Muth, an American professor of econom- ics2, developed a more efficient model that de- scribes the changes in market expectations bet- ter. This is the model of rational expectations (Muth, 1961). The essence of Muth’s model is that expectations are the same as the opti- mal forecast (the best guess of the future) if all available information is used.
The efficient market theory
By applying rational expectations to financial markets, the model of rational expectations led to the efficient market theory, a new the- ory that was dominant on the financial and capital market for a long time. With this cor- respondence, price movements on the market can also be described nicely. According to the efficient market theory, current prices in a fi- nancial market will be set so that the optimal forecast of a security’s return using all available information equals the security’s equilibrium return (Mishkin, 2013).
We can draw two important conclusions from this hypothesis.
u
If the value of the variables of the model that determine the equilibrium return changes, the price changes. The model includes, for ex- ample, the risk-free return, which the market equates to the return of the three-month dis- count treasury bills. This return changes as a re- sult of the monetary policy of the central bank, so this is what influences the price of a stock or a bond as well. This is the macroeconom- ic level, which affects the price of everything that is traded in the given country. Positive and negative changes in the life of the issuer of the given financial instrument as a company, like the market authorisation of a new active sub- stance for medicinal products or a scandal re- lated to the accounting of the company, change the variables on which the price is based on the level of the company, i.e. on a microeconom- ic level. As a result, this change affects expect- ed future returns, based on which the current prices can be determined according to the effi- cient market theory.v
The other important conclusion is that in average, prediction errors converge to zero and thus cannot be predicted. This means that mar- ket operators keep changing their rational ex- pectations by integrating new information. The basis of the practical implementation of thisconclusion is the activity of arbitrageurs. An ar- bitrageur is a market operator who makes use of the fact that the equilibrium price is not yet re- flected in the market price, by entering the mar- ket as a buyer to make profit from the increasing price, or as a seller, to make profit from the ex- pected fall in the price (selling short) and to buy back the same instrument later for a lower price.
In this case it may seem that the efficient mar- ket theory doesn’t work, as the market couldn’t ensure the equilibrium price immediately. This, however, does not contradict the model, as, ac- cording to the second conclusion, prediction errors do occur, just the deviation of the error from the average cannot be determined for the future. However, it is also true that not all in- formation is available to every market operator and even if it is, it is not certain that every mar- ket operator processes that information accord- ing to rational expectations or does so for every single market instrument. Even those who con- trol smart money3, i.e. investors who exploit op- portunities to make quick profits, can’t moni- tor every single financial instrument on each and every market, or there is so little difference from the optimal price that it is not worth mak- ing the transaction because of the transaction costs, the low level of liquidity and high spread4 (the difference between the bid price and the ask price). However, it should be noted that in the case of an IPo transaction, it is not possi- ble to make profit with this method, as there is no possibility of arbitrage between the time of issue and the time trading begins on the stock exchange, as the securities from the issue cannot be publicly traded during this period.
Efficient market theory: Models of different strength
As opposed to this, in practice the name of the efficient market theory is not perfect to begin with, as it does not refer to whole markets but
to specific financial instruments. The strong model of efficient markets stipulates that a certain kind of investment is as good a saving form as any other, as the price of a financial instrument is a perfect reflection of its intrin- sic value. The other assumption is that all the information that affects the intrinsic value of a financial instrument is always incorpo- rated in the price of the instrument. Finally, the most important assumption according to the strong model is that the leaders of finan- cial and non-financial companies can accu- rately determine the cost of capital and based on that they can decide accurately whether it is worth taking the given investment deci- sion or not (Borzán et al., 2011). According to the third assumption, yields on the treas- ury bond market can be perfectly predicted at all times. However, with this we would also assume that every operator on the market fo- cuses their investments on the treasury bond market, since, as a result of predictable pric- es, here it is possible to make profits with low or zero risk. This, however, is not at all true.
This way the yield curve would become pre- dictable, too, which would make the predict- ability of recessions risk-free. With this, stock market crashes could also be prevented. These theoretical conditions, however, because of the complexity of the system of its many var- iables, are not met in practice.
Thus, it can be established that it is prob- ably the semi-strong version of efficient mar- kets that is true for financial instruments and financial markets, which assumes that prices reflect the fundamental value of financial in- struments. unfortunately, this is not true for financial and capital markets, either, because of the capital market bubbles5 that develop.
Eventually it was only the weak form of the ef- ficient market theory that proved to be true.
According to this model, the prices of finan- cial instruments only include past informa- tion. As a result, there are no long-term trends
on the markets that, when followed, could lead to returns persistently above the market average (market index). This means that past prices do not predict future price movements, either, so exploiting short-term profit oppor- tunities is important for market operators. It is discernible in the increased volatility of prices, i.e. in the long-term increase of the amplitude of price swings. This is why financial instru- ments on financial markets can deviate from the fundamental value for longer time inter- vals, and because of this market bubbles and market crashes can’t be predicted, either. Based on these facts, only the weak model is con- firmed in the efficient market theory.
lOcK-uP PerIOD
During the IPo, there is usually a lock-up peri- od set for the existing shareholders of the com- pany (Hurt, 2006). In this period, they are not allowed to sell their shares, and they commit to this in their agreement with the lead man- ager (Rueda, 2001). Investors find it attractive when there is no option of an immediate exit for existing shareholders at an IPo. As a re- sult, lock-up agreements are common practice (Geddes, 2008). one advantage is that certain shareholders (e.g. venture capital funds) are not allowed to sell their shares immediately af- ter the initial public offering (Kecskés, Halász, 2011). It is an important sign that those with reliable information on the company do not wish to leave the firm because of some negative prospects. The lock-up period also helps stabi- lise the price, as it temporarily caps the sup- ply of shares and decreases the supply pressure on the price (Draho, 2005). If existing share- holders wanted to sell their shares (or a part of them) immediately, it would clearly be a diffi- cult task for the lead manager to keep the sec- ondary market price above the offering price in the first trading days with price stabilis-
ing tools (Geddes, 2008). Because of this, the approval of the lead manager is required for shortening the period or getting an exemption from the ban on sales (Hurt, 2006). Howev- er, according to an empirical study, if the lock- up period is shortened after the transaction, it results in a 23 percent fall in the stock price within ten days of the announcement (Kecs- kés, Halász, 2011).
In the 1990s in the us, the average lock- up period was 180 days, and the restraint on alienation extended to approximately 95 per- cent of previously issued shares (Geddes, 2008). In the sample of 70 examined in the present study, the lock-up period was 180 days in every case. However, 90, 270 and 365-day lock-up periods are also frequently set (Ged- des, 2008). The length of the lock-up period is determined by the capital market practices of national economies, and the relevant capi- tal market regulations (Goergen et al., 2004).
Basically, a 180-day lock-up period is suffi- cient, as during this period, two sets of quar- terly data are published, which confirms how the business plan presented in the prospectus is being implemented. Different lock-up peri- ods can be set for the management of the com- pany and other shareholders (Geddes, 2008).
However, even with lock-up agreements, share- holders can apply various techniques to trans- fer the risks. shares may be used, for exam- ple, as collateral in loan transactions, and risks are also transferred when the shares are used in derivative (off-exchange, forward) transactions (Kecskés, Halász, 2011).
SOurce AND ANAlySIS OF The DATA uSeD
The data used is from data provided by NAs- DAQ6. A database of seventy IPos with shares that had been launched and traded on NAs- DAQ for at least six months before August
2017. The issues were categorised by indus- tries by the author. It is important to note that as the second largest stock exchange in the us, NAsDAQ still attracts firms with new tech- nologies primarily, while its competitor, the New York stock Exchange (NYsE), mostly lists companies from traditional industries. It should be noted that while, due to several fac- tors, underpricing in IPos is typical in devel- oping countries (Basti et. al, 2015), it is not a problem for major operators on developed markets, including NAsDAQ, but it doesn’t mean that there can’t be some exceptions, like it happened with the LinkedIn IPo (Dem- bosky, 2011).
Even though there are companies from tra- ditional industries listed on NAsDAQ, the business models of these companies (from the vehicle industry or mining, for example) are also mostly based on the new technologies in the respective industry. It should be noted that the Jumpstart our Business startup Act (Jobs Act) of 2012 achieved its goal, as it had a sig- nificant influence on the stock market launch of companies with advanced technologies: Af- ter the act came into effect, the number of IPos of IT companies increased by 25 percent over the previous year (Dambra et al., 2015).
As the available datasets for the sample of 70 IPos over the course of almost a year re- veal, there is no significant correlation be- tween the long-term success of IPos and the price movements in the first six months. Re- garding the various industries, the general de- cline in the raw material and energy sectors in the past year clearly had an impact on the price movements of the analysed issues after the stock market launch. The performance of the IT sector, which is dominated by the FAANG stocks7, had the opposite effect. FAANG stocks soared in the period examined, which clearly had a positive effect on the price move- ments of the new firms in this industry after their IPo. In the financial sector it was obvi-
ous that the success or failure of the first peri- od after the IPo almost exclusively depend- ed on the issuer and its business model. In the case of financial companies, a former study re- vealed a relationship between the initial suc- cess of the IPo, debt levels, and venture capi- tal backing in the early financing stages of the company (Barry, 2015).
However, regarding expectations, it is im- portant to emphasise one phenomenon here.
From the stocks mentioned earlier, it is the most visible in the case of Facebook that the first six months on the stock exchange do not predict the future of the company adequately (see Figure 1). In this short period and based on the years before the stock market launch, the market typically sees a business mod- el built on one product or one service. It has also been established that even the innovation strategy of the company can change as it goes public (Bernstein, 2015). This is because mar- ket penetration takes more time with products that ensure a larger market share in the long term. As a result, it takes years even for prod- ucts that develop extremely fast and gain mar- ket shares quickly to become market leaders.
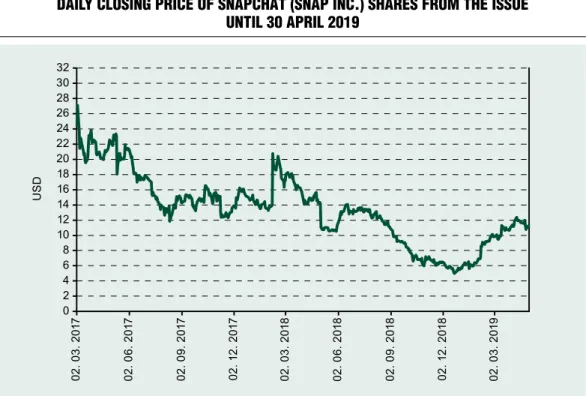
The launch of Facebook competitor snap- chat on the stock exchange in March 2017 suggests a similarly rocky road. While the of- fering price of usD 19 saw a nearly 44 percent growth on the first trading day, and the price on the stock exchange went up to usD 24, five months later, the shares of the company traded at usD 17. The success of the company on the first day was not due to a well-founded business model but due to an attractive price and the euphoria that is so typical at IPos.
This phenomenon was summarised nicely by an analyst regarding the snapchat IPo, stat- ing that on the first day of an IPo investors feel that if they miss the ‘success’ of an IPo, they miss a new and great opportunity (Fear of Missing out—FoMo) (Lien et al., 2017).
However, in this case they don’t take due ac-
count of the long term risks of the company and the resulting challenges, as it is clear from Figure 2.
Analysis of the database based on statistical methodology
Hypotheses
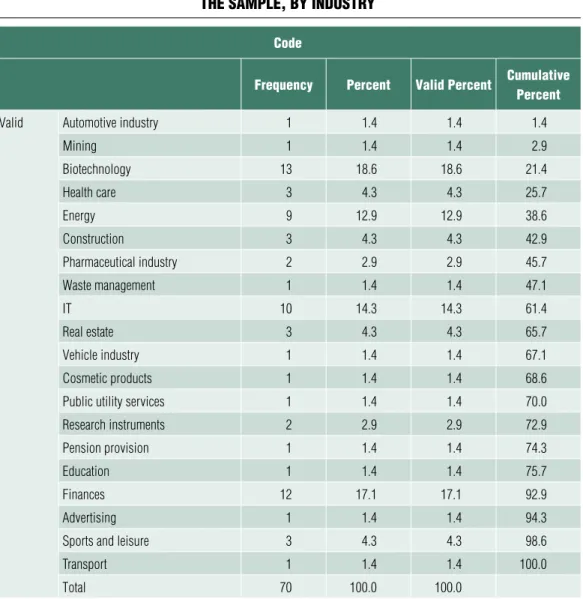
The industry characteristics of IPos in late 2016, by January 2017, reflect the megatrends, as in recent years companies in biotechnolo- gy, financial services, IT and energy play a ma- jor role in the global economy. A large part of the sample, 62.9 percent, are companies from these industries (see Table 1 and Table 4).
Following the theoretical introduction, the author formulated two hypotheses and one re- search question.
Research question: Not every IPo in the
sample was successful, as indicated by returns and stock prices.
H1: The IPo price has a substantial influ- ence on later returns.
H2: sector characteristics have an effect on the success of the IPo, and there are signifi- cant differences between the sectors regarding return and stock price indicators.
The research question was examined with descriptive statistical tests, using percentiles.
correlation calculation was performed to sub- stantiate the first hypothesis, and variance analysis to substantiate the second.
statistical analysis was carried out with the sPss 22 software package and the Microsoft office suite.
Results
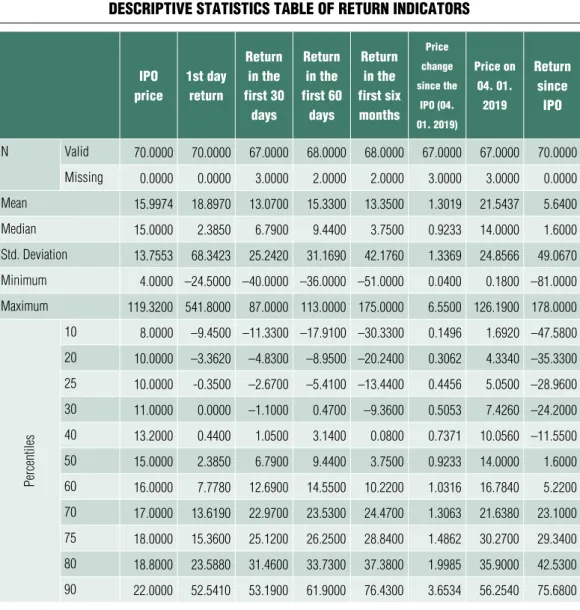
As presented in Table 2, in the case of returns on the first day, in the first 30 days, in the first Figure 1 Daily closing price of facebook shares from the issue
until 30 april 2019
Source: edited by the author based on data by NASDAQ
60 days, in the first six months, and returns since the IPo, the stock market launch was successful in 70 percent of the sample, as it can be seen from the first day returns, and returns in the first 30 days and in the first six months.
This can also be detected in the table where negative returns turn into positive. There is a 75 percent success rate in the case of the return in the first 60 days, which means 75 percent of the companies produced positive returns.
It is interesting to examine the minimum value, which is increasing even over this short period for the return indicators examined. The price of the best-performing stock is extremely high, it is 178 percent since the IPo.
If someone invested in this imaginary port- folio, buying the shares in the sample, they re- alised a mean return of 5.64 percent since the IPo. It is clear, however, that returns since the IPo are lower than returns in the first six
months, only half of the sample produced a positive value. In the nearly two years since the expiry of the lock-up period, the mean re- turn declined from 13.36 percent in the first 6 months to almost half this value (as of 4 Jan- uary 2019). This is not a theoretical opportu- nity, through exchange traded funds (ETFs), this return is available to the average investor as well.8 This means that the market launch of half the companies examined was not success- ful as they could not generate a return for their investors in the long term.
This shows that the market launch of a company greatly depends on its performance and there is no single recipe for success. sev- eral stocks produced a negative return on the first day, which raises doubts about how well- founded the stock market launch was.
correlation analysis was performed to sub- stantiate the second hypothesis, where the key
Figure 2 Daily closing price of snapchat (snap inc.) shares from the issue
until 30 april 2019
Source: edited by the author based on data by NASDAQ
question is what correlation can be detected between IPo prices and returns.
Table 3 shows that the IPo had an above-medium effect only on the price on 04.01.2019, based on a two-tailed probe at a significance level of 1 percent. The conclu- sion here is that the correlation is highly sig- nificant, but the IPo price has no substantial effect on return levels.
The table revealed several interesting rela-
tionships. There is a correlation between the return since the IPo and return indicators.
The strongest correlation is with the return in the first six months, in this case, the correla- tion coefficient indicates a strong positive rela- tionship, which stayed the same with the price on 04.01 and with the net price change. There is also a very strong correlation between the 30-day and 60-day return levels; the value of the correlation coefficient exceeds 0.7.
Table 1 the sample, by inDustry
code
frequency percent Valid percent cumulative percent
valid Automotive industry 1 1.4 1.4 1.4
Mining 1 1.4 1.4 2.9
biotechnology 13 18.6 18.6 21.4
health care 3 4.3 4.3 25.7
energy 9 12.9 12.9 38.6
construction 3 4.3 4.3 42.9
Pharmaceutical industry 2 2.9 2.9 45.7
Waste management 1 1.4 1.4 47.1
IT 10 14.3 14.3 61.4
real estate 3 4.3 4.3 65.7
vehicle industry 1 1.4 1.4 67.1
cosmetic products 1 1.4 1.4 68.6
Public utility services 1 1.4 1.4 70.0
research instruments 2 2.9 2.9 72.9
Pension provision 1 1.4 1.4 74.3
education 1 1.4 1.4 75.7
Finances 12 17.1 17.1 92.9
Advertising 1 1.4 1.4 94.3
Sports and leisure 3 4.3 4.3 98.6
Transport 1 1.4 1.4 100.0
Total 70 100.0 100.0
Source: edited by the author based on NASDAQ data
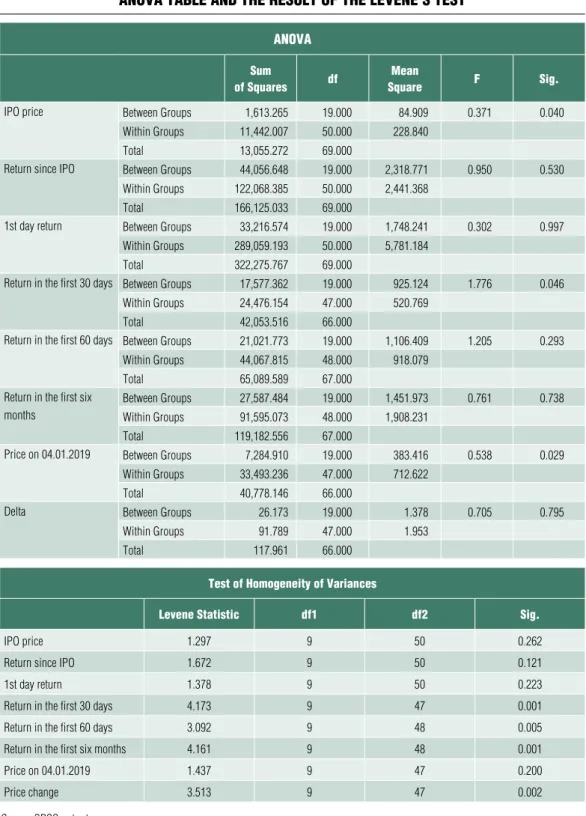
Table 4 examines the variance analysis and its prerequisite. Table 4 examines IPos ac- cording to the 20 industries defined in Table 1. Three industries are significant: There are 13 firms from biotechnology, 12 from finance and 10 from IT, which is exactly 50 percent of all the data examined (see Table 1). The bot- tom table of Table 4 shows whether the data- sets are suitable for running a variance analysis, the condition of which is that the significance
levels must be above 5% for the IPo price, the return since IPo, the first-day return and the price on 04. 01. 2019.
The top table shows significant difference when the significance level of the F-test is be- low 5 percent. The IPo price, the 30-day re- turn and the price on 04. 01. 2019 meet this condition. In this case it can be shown that as a result of industry characteristics, there are sig- nificant differences between prices and returns.
Table 2 DescriptiVe statistics table of return inDicators
ipo price
1st day return
return in the first 30
days
return in the first 60
days
return in the first six months
price change since the
ipo (04.
01. 2019)
price on 04. 01.
2019
return since
ipo
N valid 70.0000 70.0000 67.0000 68.0000 68.0000 67.0000 67.0000 70.0000 Missing 0.0000 0.0000 3.0000 2.0000 2.0000 3.0000 3.0000 0.0000
Mean 15.9974 18.8970 13.0700 15.3300 13.3500 1.3019 21.5437 5.6400
Median 15.0000 2.3850 6.7900 9.4400 3.7500 0.9233 14.0000 1.6000
Std. Deviation 13.7553 68.3423 25.2420 31.1690 42.1760 1.3369 24.8566 49.0670 Minimum 4.0000 –24.5000 –40.0000 –36.0000 –51.0000 0.0400 0.1800 –81.0000 Maximum 119.3200 541.8000 87.0000 113.0000 175.0000 6.5500 126.1900 178.0000
Percentiles
10 8.0000 –9.4500 –11.3300 –17.9100 –30.3300 0.1496 1.6920 –47.5800 20 10.0000 –3.3620 –4.8300 –8.9500 –20.2400 0.3062 4.3340 –35.3300 25 10.0000 -0.3500 –2.6700 –5.4100 –13.4400 0.4456 5.0500 –28.9600 30 11.0000 0.0000 –1.1000 0.4700 –9.3600 0.5053 7.4260 –24.2000 40 13.2000 0.4400 1.0500 3.1400 0.0800 0.7371 10.0560 –11.5500
50 15.0000 2.3850 6.7900 9.4400 3.7500 0.9233 14.0000 1.6000
60 16.0000 7.7780 12.6900 14.5500 10.2200 1.0316 16.7840 5.2200 70 17.0000 13.6190 22.9700 23.5300 24.4700 1.3063 21.6380 23.1000 75 18.0000 15.3600 25.1200 26.2500 28.8400 1.4862 30.2700 29.3400 80 18.8000 23.5880 31.4600 33.7300 37.3800 1.9985 35.9000 42.5300 90 22.0000 52.5410 53.1900 61.9000 76.4300 3.6534 56.2540 75.6800 Source: SPSS output
Table 3 correlations
correlations
ipo price return since ipo
1st day return
return in the first 30 days
return in the first 60 days
return in the first six months
price on 04. 01.
2019
change
IPO price
Pearson
correlation 1,000 0,098 -0,103 0,021 0,034 0,063 0,592** 0,020
Sig.
(2-tailed) 0,420 0,398 0,866 0,784 0,610 0,000 0,873
N 70,000 70,000 70,000 67,000 68,000 68,000 67,000 67,000
return since IPO
Pearson
correlation 0,098 1,000 -0,004 0,465** 0,474** 0,824** 0,626** 0,703**
Sig.
(2-tailed) 0,420 0,977 0,000 0,000 0,000 0,000 0,000
N 70,000 70,000 70,000 67,000 68,000 68,000 67,000 67,000
1st day return
Pearson
correlation -0,103 -0,004 1,000 0,233 0,181 0,040 0,021 0,040
Sig.
(2-tailed) 0,398 0,977 0,058 0,140 0,747 0,867 0,751
N 70,000 70,000 70,000 67,000 68,000 68,000 67,000 67,000
return in the first 30 days
Pearson
correlation 0,021 0,465** 0,233 1,000 0,887** 0,549** 0,350** 0,408**
Sig.
(2-tailed) 0,866 0,000 0,058 0,000 0,000 0,004 0,001
N 67,000 67,000 67,000 67,000 65,000 66,000 65,000 65,000
return in the first 60 days
Pearson
correlation 0,034 0,474** 0,181 0,887** 1,000 0,600** 0,319** 0,369**
Sig.
(2-tailed) 0,784 0,000 0,140 0,000 0,000 0,009 0,002
N 68,000 68,000 68,000 65,000 68,000 66,000 66,000 66,000
return in the first six months
Pearson
correlation 0,063 0,824** 0,040 0,549** 0,600** 1,000 0,460** 0,536**
Sig.
(2-tailed) 0,610 0,000 0,747 0,000 0,000 0,000 0,000
N 68,000 68,000 68,000 66,000 66,000 68,000 65,000 65,000
Price on 04.01.2019
Pearson
correlation 0,592** 0,626** 0,021 0,350** 0,319** 0,460** 1,000 0,796**
Sig.
(2-tailed) 0,000 0,000 0,867 0,004 0,009 0,000 0,000
N 67,000 67,000 67,000 65,000 66,000 65,000 67,000 67,000
Price change since the IPO (04.01.2019)
Pearson
correlation 0,020 0,703** 0,040 0,408** 0,369** 0,536** 0,796** 1,000
Sig.
(2-tailed) 0,873 0,000 0,751 0,001 0,002 0,000 0,000
N 67,000 67,000 67,000 65,000 66,000 65,000 67,000 67,000
Note: ** correlation is significant at the 0.01 level (2-tailed) Source: SPSS output
Table 4 anoVa table anD the result of the leVene’s test
anoVa sum
of squares df mean
square f sig.
IPO price between Groups 1,613.265 19.000 84.909 0.371 0.040
Within Groups 11,442.007 50.000 228.840
Total 13,055.272 69.000
return since IPO between Groups 44,056.648 19.000 2,318.771 0.950 0.530
Within Groups 122,068.385 50.000 2,441.368
Total 166,125.033 69.000
1st day return between Groups 33,216.574 19.000 1,748.241 0.302 0.997
Within Groups 289,059.193 50.000 5,781.184
Total 322,275.767 69.000
return in the first 30 days between Groups 17,577.362 19.000 925.124 1.776 0.046
Within Groups 24,476.154 47.000 520.769
Total 42,053.516 66.000
return in the first 60 days between Groups 21,021.773 19.000 1,106.409 1.205 0.293
Within Groups 44,067.815 48.000 918.079
Total 65,089.589 67.000
return in the first six months
between Groups 27,587.484 19.000 1,451.973 0.761 0.738
Within Groups 91,595.073 48.000 1,908.231
Total 119,182.556 67.000
Price on 04.01.2019 between Groups 7,284.910 19.000 383.416 0.538 0.029
Within Groups 33,493.236 47.000 712.622
Total 40,778.146 66.000
Delta between Groups 26.173 19.000 1.378 0.705 0.795
Within Groups 91.789 47.000 1.953
Total 117.961 66.000
test of homogeneity of Variances
levene statistic df1 df2 sig.
IPO price 1.297 9 50 0.262
return since IPO 1.672 9 50 0.121
1st day return 1.378 9 50 0.223
return in the first 30 days 4.173 9 47 0.001
return in the first 60 days 3.092 9 48 0.005
return in the first six months 4.161 9 48 0.001
Price on 04.01.2019 1.437 9 47 0.200
Price change 3.513 9 47 0.002
Source: SPSS output
Post-hoc tests have proven that in the case of the IPo price, the stock price of the com- pany providing pension insurance services is significantly different from companies in oth- er industries. In the case of the return in the first thirty days, the cosmetics company and the sports and leisure companies have signif- icantly different values from the other firms.
In the case of the current price, only the ad- vertising firm has a significantly different value from companies in other industries.
Conclusions
Descriptive statistics have clearly shown that for a significant part of the companies the stock market launch was not successful, as shares generated a negative return for investors and owners, and according to the stock prices, the assets of owners decreased by 60 percent from their initial investment.
At the first hypothesis, a partial correlation was established, but the IPo price has no ef- fect on later returns mostly. It has been con- firmed, however, that performances move in the same direction, which means return lev- els are correlated, and if a company’s perfor- mance is good in the first thirty days, it is like- ly to be successful in the future as well in terms of returns.
The second hypothesis has been partly con- firmed, differences among sectors, stock prices and returns have only been found in a few cas- es. (See Table 5)
cONcluSION
The study examined the IPos in the previous six months before 31 January 2017 on NAs- DAQ, the largest stock exchange in the world representing the tech sector. The question to explore was whether the price movements in the first six months provide a solid prediction for the success of the IPo.
In the course of the analysis, it was found that in the sample of 70 IPos over the course of almost a year, there was no significant cor- relation between the long-term success of IPos and the price movements in the first six months. However, it can be established regard- ing the various industries, that the general de- cline in the raw material and energy sectors in the past year clearly had an impact on the price movements after the analysed issues. The per- formance of the IT sector, which is dominat- ed by the FAANG stocks, had the opposite ef- fect: It clearly had a positive effect on the price movements of the new firms in this industry after their IPo. statistical analysis confirmed this in the analysis of three hypotheses.
However, many activities may take place with the aim to ensure the long term equilibri- um of supply and demand that are independ- ent from the performance of the company yet affect the price. Due to the increased expec- tations, special attention from investors and major media coverage, this six-month period is important for former, current and especial-
Table 5 results of the hypothesis testing
research question accepted
hypothesis h1 Partially accepted
hypothesis h2 Partially accepted
Source: own research
ly future owners of the company. This means that the activities of the demand side on the first day is mostly rooted in irrationality, not rational consideration, as stakeholders experi- ence a euphoria because of the once in a life- time opportunity. The syndicate handling the IPo on the capital market can maintain the price to help mitigate price volatility. The lock- up period is equally important as it prevents the
flooding of the market and the negative conse- quences that would entail. These are legal and regulated methods to influence supply and de- mand. These can influence price movements in the short term, but the long term trust of in- vestors and the steady growth of the stock price are based on the long-term success of the com- pany’s business plan, i.e. whether the planned market share and profit volume are achieved.
Notes
1 NAsDAQ (National Association of securities Dealers Automated Quotations), the first elec- tronic stock market, began trading in 1971. To- day, it is the second largest stock exchange in the us in terms of trade volume.
2 John Muth (1930–2005), an American mathema- tician and economist, was affiliated with carnegie Mellon university in his research. He published his study, Rational Expectations and Theory of Price Movements in 1961, in which he described the theory of rational expectations. According to this theory, informed expectations of profession- als in a certain field are essentially the same as the predictions of the relevant economic theory. Even though this theory was created in the context of microeconomics, it had a significant impact on macroeconomics as well.
3 smart money: Money controlled by a small num- ber of investors who are always open to make quick profits (see arbitrage) and who do make use of such opportunities.
4 spread – the difference between the current best bid and ask prices. The spread depends on the method of market making, the number of market makers and the volume of market transactions.
The most visible example of spread is how curren- cy and foreign exchange rates work. At any given
moment, there may be a several percent difference between the exchange rates of exchange bureaux, commercial banks and the treasury rates of com- mercial banks.
5 When there is a capital market bubble, the price of a given capital market instrument is persistently different from its intrinsic or fundamental value.
The reasons for this lie in the structure of the mar- kets, and especially in the behaviour of market op- erators. A new branch of economics, behavioural economics, studies this latter issue. Instead of accepting the concept of a homo economicus who takes rational decisions, behavioural economics studies how economic decisions made by market operators are determined by emotions and some- times non-rational behavioural models.
6 NAsDAQ (National Association of securities Dealers Automated Quotations) was established in 1971 as a result of the digital revolution. This can be interpreted as the dawning of the whole age of electronic trading. on the terminals of the computer system, the best orders of the market makers and security traders are displayed. Accu- mulated data is updated in real time and is accessi- ble on three different levels through the terminals.
In 2007, the stock exchange merged with oMX AB (Aktiebolaget optionsmäklarna/Helsinki stock Exchange), a Finnish–swedish financial ser-
References vice provider that operates eight stock exchanges in Northern Europe (copenhagen, stockholm, Helsinki and Iceland), in the Baltic states (Tallinn, Riga and Vilnius) and an alternative stock ex- change for companies with smaller capitalisation.
In 2013 it purchased Thomson Reuters, a finan- cial information company, and in 2015 Dorsey Wright & Associates LLc, an index provider and data analysis firm.
7 FAANG stocks are the stocks of the leading global tech firms. It is an acronym from the ticker sym- bols (that identifies the stock on the stock ex-
change) of Facebook, Amazon, Apple, Netflix and Google. These companies, as opposed to the pre- vious tech bubble, became the key actors on their markets as they had significant profit-generating ability, disruptive technologies that can be used widely and that completely trumped previous so- lutions, and a business model that used this tech- nology effectively.
8 For more details on ETFs see Bujtár, Zsolt (2016).
Eladó az egész világ? Avagy – ETF-k szabályozási kérdései (Is the whole world for sale? Regulatory issues of ETFs). JURA Vol. 22 Issue 1 pp. 171–181
Bács, Z., Lukács, J., Túróczi, I., Zéman, Z.
(2016). A pénzügyi kimutatásokból számítható mutatószámok korlátai (The limits of indicators calculated from financial statements) Controller Info, 4: 2, pp. 13–16
Barry, c. B., Mihov V. T. (2015). Debt financ- ing, venture capital, and the performance of initial public offerings. Journal of Banking and Finance, Vol.
58, pp. 144–165
Basti, E., Kuzey, c., Delen, D. (2015). Analyz- ing initial public offerings’ short-term performance using decision trees and sVMs Decision support systems Vol. 73, pp.15–27
Bélyácz, I. (2013). Várakozások, bizonytalanság, valószínűség. Értekezés a kockázat számszerűsítésének korlátairól. (Expectations, uncertainty and probabi- lity. An assessment of the limits to the quantification of risk.) Közgazdasági Szemle/Economic Review, Vol.
60, July–August pp. 749–780
Bernstein, s. (2015). Does Going Public Affect Innovation? Journal of Finance Vol. 70, No. 4, pp.
13651–1403
Borzán, A., Lentner, cs., szigeti, c. (2011).
A pénzügyi vállalkozások felelősségvállalásának új dimenziói. (The New Dimensions of the Responsibility of Financial companies.) Economica, Vol. 4 Issue 11 pp. 22–30
Bujtár, Zs. (2018). A kriptovaluták európai és mál- tai szabályozásának összehasonlítása. A máltai sólyom szárnyalása. (A comparison of the regulation of cryp- tocurrencies in Europe and in Malta. The soar of the Maltese falcon.) Európai Jog, Vol. 18 Issue 5 pp. 6–15
Bujtár, Zs. (2016). Eladó az egész világ? Avagy – ETF-k szabályozási kérdései (Is the whole world for sale? Regulatory issues of ETFs). JURA, Vol. 22 Issue 1 pp. 171–181
Dambra, M., Field, L. c., Gustafson M.
T., Pisciotta, K. (2015). The JoBs Act and IPo volume: Evidence that disclosure costs affect the IPo decision. Journal of Financial Economics, Vol. 116, No 1, pp. 121–143
Draho, J. (2005). The IPO Decision – Why and How Companies Go Public. Edward Elgar Publishing, Northampton, pp. 254
Dembosky, A. (2011). Wall street ‘mispriced’
LinkedIn’s IPo. Financial Times, 2011. 05. 30.
online: https://www.ft.com/content/48e72d56- 8ae4-11e0-b2f1-00144feab49a
Goergen, M., Renneboog, L., Kurshed, A.
(2004). Shareholder Lockup Agreements in the Euro- pean New Markets (centER Discussion Paper, Vol.
2004–121). Tilburg, November 2004
Geddes, R. (2008). IPos and Equity offerings.
Butterworth-Heinemann, 205
Hurt, c. (2006). What Google can’t Tell us About Internet Auctions (And What It can). Uni- versity of Toledo Law Review, Vol. 37., No. 2., pp.
403–438
Kecskés, A., Halász, V. (2011). Társaságok a tőzsdén (companies on the stock Exchange), HVG- ORAC, Budapest, p. 518
Lentner, cs. (2002). A nemzetközi tőkepiacok és pénzügyi intézmények – közép- és kelet- európai szemmel. (International capital markets and financial institutions – From a central-Eastern European aspect.) Pénzügyi Szemle/Public Finance Quarterly, Vol. 47 Issue 5 pp. 471–479
Lien, T., Paresh, D., Agrawal, N. (2017).
snapchat firm makes history in stock market debut.
Los Angeles Times, 2 March 2017
online: http://www.latimes.com/business/technology/
la-fi-tn-snapchat-ipo-day-20170302-story.html Lowry, M., officer s. M., schwert G. W.
(2006). The Variability of IPo Initial Returns. Na- tional Bureau of Economic Research Working Paper, series 12295
Mantell, E. H. (2016). Agency conflict in Pric- ing Initial Public Equity offerings in the unit- ed states. International Research Journal of Applied Finance, Vol. 7. No. 11. pp. 316–333
Mishkin, F. s., serletis A. (2011). The Economics of Money, Banking and Financial Markets. 4th.
canadian Edition, Pearson canada Inc. pp. 193 Muth, J. F. (1961). Rational Expectations and the Theory of Price Movements. Econometrica, Vol.
29., No. 3, pp. 315–335
Rueda, A. (2001). The Hot IPo Phenomenon and the Great Internet Bust. Fordham Journal of Corporate & Financial Law, Vol. 7., No. 1., pp.
21–100