CITIZENS-REPRESENTATIVES CONGRUENCE CONCERNING THE EUROPEAN UNION:
EVOLUTION DURING THE EUROZONE CRISIS
JOSÉ REAL-DATO1
ABSTRACT In this paper I analyze to what extent the Eurozone crisis has affected the representativeness of parties’ positions with respect to the issue of European integration.
Public opinion data and many analyses have provided evidence that, since 2010, public support for the European Union (EU) has dramatically declined. In contrast, existing data on party positions indicates considerable stability in this area, particularly among mainstream parties. However, we still lack a comparative analysis of the evolution of citizens-representatives congruence since the start of the Eurozone crisis, and the factors that may affect variations in congruence levels. With this paper we fill this gap through using a unique dataset of parties and voter positions based on political elite and mass surveys carried out in nine EU countries in 2007, 2009 and 2014.
KEYWORDS: elites, Eurozone crisis, party-voter congruence, EU
INTRODUCTION
There is a considerable amount of work that, during the last years, has involved the study of the political consequences of the Great Recession and the Eurozone crisis in European countries, both in terms of electoral (Magalhães 2014; Hernández and Kriesi 2016) and party behavior (Mair 2011), as well as in perceptions of the working of institutions by citizens. In particular, this strand of literature has found a relationship between the crisis and reduced levels of institutional support for national and EU institutions (Serricchio, Tsakatika and Quaglia 2013; Roth et al. 2013, Armingeon and Ceka 2013) and satisfaction with democracy (Cordero and Simón 2015).
1 José Real-Dato is associate professor at the University of Almería; e-mail: jreal@ual.es
CORVINUS JOURNAL OF SOCIOLOGY AND SOCIAL POLICY VOL. 8 (2017)3S
In this context, congruence between citizens and their representatives constitutes an interesting research topic. Since congruence is admitted to be a basic normative ingredient of democratic representation (though criticism of this stance exists – see below), one may wonder to what extent the crisis has affected congruence, both at the system and party level. Moreover, given the mediating effect of congruence on political attitudes, such as satisfaction with democracy (Reher 2015; Stecker and Tausendpfund 2016) and political behavior – i.e. voter turnout (Lefkofridi et al.
2014; Reher 2014) –, we can also ask to what extent the variation in congruence during the crisis may have affected such attitudes in European countries.
Some research has already analyzed the relationship between congruence and the crisis. Most of these studies focus on Southern European countries (Belchior et al. 2016; Freire et al. 2016). Their findings confirm that, in general terms, the positions of political representatives and citizens have diverged during the crisis.2 From a comparative perspective, Giger et al. (2016) show a decline in the congruence between parties and citizens with regard to the salience of specific issues in several countries during the crisis.
This chapter also focuses on how the crisis has affected congruence, but it does so specifically regarding the issue of European integration. Though there are some case studies that deal with this topic (reviewed later in this chapter), a comparative perspective is still lacking. In the next pages I answer the following questions: How has congruence as regards the EU evolved during the crisis, and how is this evolution related to the specific economic situation in each country?
These questions will be answered through a focus on different aspects of the concept. In order to provide a more complete view of the effects of the crisis on the relationship between the preferences of citizens and their representatives, I will focus on both system – (citizens-representatives) and party-level (voters- party representatives) congruence, and also take into account some different conceptualizations of congruence. In contrast with most congruence studies (which adopt a more limited conceptual scope), the focus on different views of congruence guarantees a more robust answer to the above-mentioned questions, allowing me at the same time to ascertain whether the different concepts of congruence actually refer to the same phenomenon.
Another innovative aspect of this study has to do with the data used in the analyses. Though information about representatives’ positions have been
2 However, congruence has increased in some cases. Belchior et al. (2016) find greater levels of congruence between deputies and representatives on issues concerning representation – with deputies and citizens both moving towards a more participatory-mandatory view of representation (p. 13). In Spain, Real-Dato (2017) finds that political representatives and citizens have become closer with respect to their degree of identification with the EU.
usually obtained through alternative means (Comparative Manifestos Project data, experts surveys and citizens’ placements of parties) (Powell 2009), this chapter follows the lead of recent studies that have used surveys of political representatives to compute their positions (Freire et al., 2014; Dolný and Baboš, 2015; but also see Marsh and Wessels, 1997).
The paper is structured as follows: In the next section I deal with the concept of congruence, offering some clarifications concerning its meaning and theoretical significance within the framework of democratic government. This includes an explanation of the theoretical and empirical difficulties it generates. In the third section I introduce the hypotheses that are tested concerning the evolution of congruence about the EU during the crisis. These hypotheses are based on previous studies on this topic which have underlined the growing importance of congruence between citizens and representatives concerning the understanding of contemporary democratic governance in the EU. The fourth section presents the data and methods used in the analysis, paying particular attention to the description of the different conceptualizations of congruence and their respective operationalizations. The fifth section presents the results of the analysis, and in the last section I summarize and discuss the main findings of the paper.
ON THE CONCEPT OF CONGRUENCE
A basic understanding of political “congruence” refers to the correspondence between the preferences of citizens (or groups thereof) and the positions (and, ultimately, actions) of their political representatives (Powell 2004; 2014).
From a normative point of view, the degree of congruence between these actors has been considered a basic indicator of the quality of democracy. A correspondence between the preferences of citizens and the positions and actions of their representatives constitutes a basic feature (but not the only one) of the mechanism of representation and delegation of political decision-making that democracy implies (Miller and Stokes 1963; Pitkin 1963; Strøm 2000; Powell 2004; 2014). Proponents of the responsible party government model state that the adequate functioning of representative democracy requires that voters vote for those parties whose policy platforms are closer to voter preferences (Dalton 1985; Schmitt and Thomassen 1999; Adams 2001)
Such a view of representation requires that the preferences and positions of the represented and their representatives can be reduced to a single dimension – otherwise they could not be compared nor matched. This dimension has been usually ideology (Thomassen 1994; Powell 2004).
CORVINUS JOURNAL OF SOCIOLOGY AND SOCIAL POLICY VOL. 8 (2017)3S
The study of congruence, however, is not exempt from problems. Firstly, the concept must confront theoretical criticisms related to its actual relevance for understanding and evaluating the democratic representation process. The theoretical importance of congruence is basically related to a populist view of democracy (Luttbeg 1974; Dahl 1982), where there is an identity between the will of the people and the actions of government. In this view, the role of representatives would be basically that of translating citizens’ views into decisions. However, this is not the only way to conceive neither democracy nor the representative link (Eulau et al. 1959; Riker 1982; Thomassen 1994; Bartels and Achen 2016). Congruence plays no role, for instance, in Schumpeter’s view of democracy (Schumpeter 1976), where democracy is contemplated as a competition of political elites to be elected to policy-making positions; nor in the view of representation based on retrospective voting (Key 1966; Fiorina 1981), where citizens evaluate not the proximity of candidates to their positions, but the performance of representatives’ decisions.
Therefore, the theoretical relevance of congruence is dependent on the assumption that the functioning of democracy adjusts to the model of populist democracy – more specifically that of responsible party government. Though there is much debate if this is empirically the case (Achen and Bartels 2016), the populist view of democracy still constitutes a widely spread normative model of substantive democratic representation, as the extensive literature on this topic demonstrates (Powell 2014).
Apart from the above-mentioned criticisms, the study of congruence usually confronts two basic types of operational difficulties – conceptual, and of measurement (Golder and Stramski 2010; Powell 2014). Conceptually, there are five basic issues: 1) Who the representatives and the represented are:
governments, parliaments or parties, or individuals from the former group; all citizens, the electorate, voters or party supporters from the latter; 2) the level at which representation is being evaluated: system-level, subsystem-level or party-level; 3) how the ‘congruence’ relationship itself is being understood: as a relationship between a specific group of represented people (including the whole community) and their representatives, no matter how we define them (a many-to- one relationship, using Golder and Stramski’s term [2010]); or as a relationship between the group of represented individuals and the whole representative body (a many-to-many relationship); 4) what attributes characterize such relationships: attitudes, preferences or issue emphasis of the represented vis à vis representatives’ positions, issue emphasis, specific pledges, decisions (i.e.
budgetary decisions) or actions; and, last but not least, 5) Which dimensions of representation are relevant (ideology or other general dimensions, or specific policy issues). Clearly, the different combination of responses to these five
issues depends on the theoretical perspective adopted by the researcher and the questions she is interested in answering. For instance, asking to what extent some parties or countries are more or less congruent, or to what extent a parliament is congruent with the preferences of the whole population (or electorate), are very different questions that imply different understandings of congruence (one-to-many and many-to-many, respectively) (Golder and Stramski 2010).
Such variation in research questions thus also allows for very varied research designs and conceptualizations of congruence, which lessen the comparability of results.
These difficulties are increased when considering measurement issues (Powell 2009). Different conceptual choices involve different measurement options in terms of: 1) Who is going to be measured (depending on the subjects who form the representation dyad); 2) what is going to be measured (for instance, the distance between the median-represented individual and the representative’s position; between each represented individual and representatives’ position; or the distribution of preferences of both represented and representatives3; some authors even claim that the focus should be on the preferences of the median individual within the majority [Powell 2014:11]); 3) how measurements are computed mathematically4; or 4) from where the information for elaborating measurements is obtained (i.e. from measuring representatives’ preferences through surveys, documents, or the views of those who they represent).
Moreover, 5) there are also measurement problems linked to the issues of the commensurability between represented individuals and representatives (even if they are represented using the same scale), the comparability of positions in different contexts and time periods, and the validity of the sources utilized to measure congruence (Powell 2009).
Given these difficulties, the only solution that facilitates the interpretation of results is for the research design to clearly state which conceptual and measurement choices have been made; i.e., for the researcher to be explicit about how the results could have been differently extrapolated if other choices had been made. The decisions I have made in the research for this paper regarding the conceptualization and measurement of congruence are explained in the two next sections, respectively.
3 These three options are referred to by Golder and Stramski (2010) respectively as 1) average citizen congruence, 2) absolute and relative citizen congruence (the difference is that the second one takes into account the dispersion of citizens’ preferences), and 3) congruence (many-to-many).
4 Golder and Stramski’s (2010) formula for computing many-to-many congruence differs from that provided by Andeweg (2011). The same applies to Golder and Stramski’s method of calculating relative citizen congruence compared to that elaborated by Achen (1978).
CORVINUS JOURNAL OF SOCIOLOGY AND SOCIAL POLICY VOL. 8 (2017)3S
CONGRUENCE IN TERMS OF THE EU AND THE CRISIS
In the context of the European Union, the congruence of positions between citizens and their representatives regarding the process of European integration has become of paramount importance during the last two decades. In this period, a ‘permissive consensus’ (Lindberg and Scheingold, 1970) has been substituted by a ‘constraining dissensus’ around EU issues (Hooghe and Marks 2009), with the EU being elevated as a dimension of political confrontation in many European countries, with substantial independence from (though sometimes interrelated with) the classic dimension of political conflict – ideology (Hix and Lord 1997; Hix 1999; Hooghe et al. 2002; Bakker et al. 2012; Costello et al.
2012; Dalton 2015).
As citizens and their representatives have increasingly paid attention to EU issues in public discussion and political arenas, it makes sense to incorporate congruence as a criterion for the overall quality of political representation.
Understanding the congruence between citizens’ and political representatives’
preferences and positions with respect to the EU helps to illuminate how this issue fits into the democratic representation relationship and is intimately related to one of the most important problems with the functioning of the EU – namely, the democratic deficit and its negative consequences for political legitimacy (Katz 2001; Rose 2013). Greater levels of incongruence could signal these problems and, probably, are also one of their causes. Conversely, congruence between citizens and representatives (particularly at the government and European Parliament levels) could constitute an important remedy for those problems (Mair and Thomassen 2010).
However, accommodating the EU dimension into the democratic representation relationship is not easy. Mattila and Raunio (2012) have stressed that mainstream parties have been reluctant to plan the ‘EU card’ in political competition, it being considered a secondary issue. This situation has been associated both with the longstanding support among those parties for the European integration process in the context of the above-mentioned ‘permissive consensus’, but also because of the uncertainty of the consequences that incorporating a new dimension of political conflict could entail in terms of electoral support. This is why the politicization of EU integration has been led by smaller, non-governing parties who emphasize their Eurosceptic positions (Szczerbiak and Taggart 2008), and why during the 2000s there was an increase in the distance between parties and voters on this issue.
This involves a change from the situation in the 1990s. Despite this secondary importance awarded the dimension of EU integration and the dominance of ideology in the configuration of the European political space, studies that
focused on EU congruence during that decade found a considerable degree of convergence between citizens and their representatives, at least with respect to general support for European integration (Eijk and Franklin 1991, 2004;
Marsh and Wessels 1997; Thomassen and Schmitt 1997; 1999; Schmitt and Thomassen 2000). This scenario started to change in the late 1990s and 2000s.
Eijk and Franklin (2004) found that, in 1999, the range of policy choices parties offered regarding EU issues was less varied compared to the preferences of citizens, entailing the potential for the subsequent politicization of the European dimension by political entrepreneurs. Mattila and Raunio (2006), using data gathered in 2004, showed that parties were closer to their voters on the left- right dimension than they were in respect of EU integration. Five years later, the picture had hardly changed, with parties further drifting apart from voters, and smaller and extreme-left wing parties having become more congruent with their voters in terms of EU issues (Mattila and Raunio 2012). Using the same European Election Survey data, Costello et al. (2012) and Otero (2014) showed that there were more differences between parties and their voters as regards the EU than with respect to ideology. With data also gathered in 2009, but from a different source (the INTUNE project) and with a different conceptualization of congruence, Dolný and Baboš (2015) found that, surprisingly, system-level congruence between representatives and citizens was higher with respect to EU support than with respect to ideological positions.
Regarding the congruence of positions concerning EU integration, some of the above-mentioned works also deal with this topic. Country studies such as that of Freire et al. (2014) show that congruence in this dimension has also declined in three of the countries more severely hit by the crisis (Spain, Greece and Portugal), mostly because of the increasing Euroscepticism among citizens.5
This paper offers a more complete view of the evolution of congruence as applied to European integration during the years of the crisis by providing a comparative analysis of the positions of citizens and MPs of several EU countries in the period 2007-2014. In this respect, we elaborate on three basic hypotheses.
Since the existing evidence has shown that the stances of MPs towards the EU have hardly changed during these years (Vogel and Rodríguez-Teruel 2016), and several pieces of research have found increasing Euroscepticism among the public (Serricchio et al. 2013; Armingeon and Ceka 2013; Braun and Tausendpfund 2014; Clements and Nanou 2014), it is expected thatcongruence
5 According to the articles in a special issue edited by Vogel and Rodríguez-Teruel (2016), political representatives and parties in several European countries (including those studied by Real-Dato [2017]) and Freire et al. (2014) hardly modified their positions about this issue during the crisis.
CORVINUS JOURNAL OF SOCIOLOGY AND SOCIAL POLICY VOL. 8 (2017)3S
on EU issues has decreased since the crisis. I thus elaborate the following hypothesis:
Hypothesis 1 (H1): Congruence between citizens and national MPs has significantly decreased since 2009.
As stated in the Introduction, this article also aims at probing the connection between the specific national economic situation and the evolution of congruence in each country. In this respect, the crisis has not hit all EU countries in the same fashion. Due to the economic downturn that started in 2008 due to the Great Recession, the significant financial problems for the public sectors and banking systems of several EU countries led to a sovereign debt crisis. This led most governments to adopt, under the strong recommendation of EU institutions, austerity policies and, in some cases, to ask for external financial assistance.
Those countries that participated in financial assistance programs (Cyprus Greece, Ireland, Portugal, Spain, Hungary, Latvia and Romania) were subject to conditionality measures by the institutions that managed the programs (the European Commission, the European Central Bank, and the IMF) that involved greater cuts in public spending (particularly in social policies). In some of these countries (Spain and Greece) EU support decreased dramatically as government parties had to ‘sell’ the unpalatable measures to their citizens. Therefore, we expect that in countries subject to financial assistance programs the decrease in congruence will be even more pronounced.
Hypothesis 2 (H2): Congruence between citizens and national MPs has decreased more acutely in countries subject to financial assistance programs.
The third hypothesis relates to the evolution of congruence in new and old EU member states (respectively, those countries that accessed the EU in the 2003 enlargement or later, and those which accessed before). Apart from the influence of institutional variables on congruence about EU issues (not tested here), previous studies have identified significant differences between these groups of countries in the degree of agreement between citizens and representatives on this issue. For example, Mattila and Raunio (2006) found (in contrast to their initial hypothesis) that in 2004 congruence concerning EU integration was higher (almost perfect) between voters and parties in new member states than in old ones. This result was not confirmed using data from 2009: the authors found that levels of congruence in new member states for EU issues had by then slightly decreased below those of old member states (Mattila and Raunio 2012). Therefore, I also test if during the crisis there was any change in this state of affairs:
Hypothesis 3(H3): Levels of congruence in old and new member states remained similar during the crisis (congruence was still lower in new member states).
In the next section I present the data and the measurements used in the analysis.
DATA AND METHODS
The positions of representatives are obtained using data from the two waves of the INTUNE elite survey in 2007 and 2009 (Best, Lengyel and Verzichelli 2012) and its continuation in the ENEC project in 2014 (http://enec-2014.wixsite.com/
enec-2014). The use of surveys to capture the positions of representatives offer a number of advantages compared with other existing alternatives – namely, party manifestos, expert surveys, and citizens’ placements of parties believed position (Powell 2009). On the one hand, party manifestos usually reflect strategic projections that mostly focus on their reception of party policy positions by the electorate. This means that these strategic positions may eventually diverge from actual ones due to the incorporation of elements of opportunism and propaganda. Besides this fact, parties probably avoid dealing with some issues in their manifestos (for instance, those that might create division within the party).
On the other hand, expert surveys and citizens’ placements may be conditioned by the salience of particular debates in the public or political arena, as well as mediated by the media. Moreover, citizen’ placements and expert views may mutually influence each other. Thus, surveys of party elites probably capture a more accurate picture of the actual policy positions of their organizations.
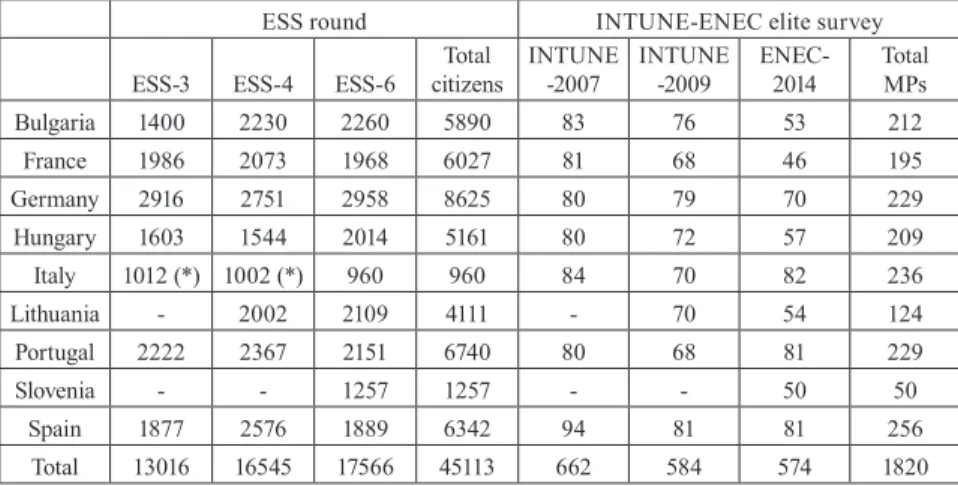
The surveys I use were implemented on representative samples of national MPs in several EU countries to collect information about their attitudes and positions towards the EU. The INTUNE elite surveys ran in parallel with two mass surveys that had many questions in common with the former. For 2007 and 2009 I was only able to use the surveys from the INTUNE project to ascertain the congruence between elites and citizens concerning EU integration (this is, for instance, also what Dolný and Baboš [2015] do in their article using the 2009 INTUNE surveys). However, the ENEC project in 2014 did not involve carrying out the corresponding mass survey in the participating countries. One alternative was to use data for 2014 from another prior or simultaneous mass survey containing similar questions (i.e. EES 2014 or the sixthor seventh round of the European Social Survey [ESS]). However, for sake of comparability I used the same source for citizens in 2007 and 2009. Since the EES 2004 was in
CORVINUS JOURNAL OF SOCIOLOGY AND SOCIAL POLICY VOL. 8 (2017)3S
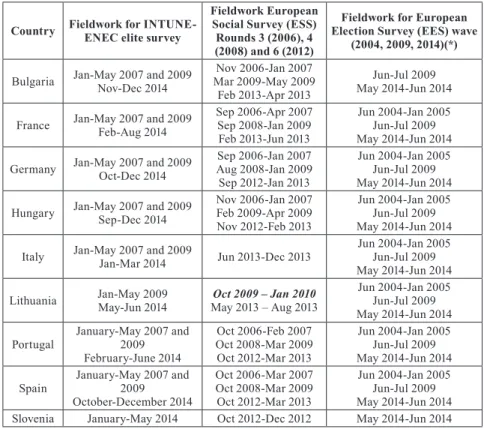
many ways different from the INTUNE elite survey, and the fieldwork for EES 2009 took place after the INTUNE elite survey, I finally decided to use the ESS data corresponding to the third, fourth and sixth rounds that formally took place in 2006, 2008 and 20126. The actual dates of fieldwork for the countries in the analysis in these rounds are much closer to the dates of the fieldwork of the elite surveys (see Table 1).7 Data and information about the samples are shown in Table A.1 in the Appendix.
Table 1. Fieldwork for INTUNE and ENEC elite surveys, and ESS surveys.
Country Fieldwork for INTUNE-ENEC elite survey
Fieldwork European Social Survey (ESS) Rounds 3 (2006), 4 (2008) and 6 (2012)
Fieldwork for European Election Survey (EES) wave
(2004, 2009, 2014)(*) Bulgaria Jan-May 2007 and 2009
Nov-Dec 2014
Nov 2006-Jan 2007 Mar 2009-May 2009
Feb 2013-Apr 2013
Jun-Jul 2009 May 2014-Jun 2014 France Jan-May 2007 and 2009
Feb-Aug 2014
Sep 2006-Apr 2007 Sep 2008-Jan 2009 Feb 2013-Jun 2013
Jun 2004-Jan 2005 Jun-Jul 2009 May 2014-Jun 2014 Germany Jan-May 2007 and 2009
Oct-Dec 2014
Sep 2006-Jan 2007 Aug 2008-Jan 2009 Sep 2012-Jan 2013
Jun 2004-Jan 2005 Jun-Jul 2009 May 2014-Jun 2014 Hungary Jan-May 2007 and 2009
Sep-Dec 2014
Nov 2006-Jan 2007 Feb 2009-Apr 2009 Nov 2012-Feb 2013
Jun 2004-Jan 2005 Jun-Jul 2009 May 2014-Jun 2014 Italy Jan-May 2007 and 2009
Jan-Mar 2014 Jun 2013-Dec 2013 Jun 2004-Jan 2005 Jun-Jul 2009 May 2014-Jun 2014 Lithuania Jan-May 2009
May-Jun 2014 Oct 2009 – Jan 2010 May 2013 – Aug 2013
Jun 2004-Jan 2005 Jun-Jul 2009 May 2014-Jun 2014 Portugal January-May 2007 and
February-June 20142009
Oct 2006-Feb 2007 Oct 2008-Mar 2009 Oct 2012-Mar 2013
Jun 2004-Jan 2005 Jun-Jul 2009 May 2014-Jun 2014 Spain January-May 2007 and
October-December 20142009
Oct 2006-Mar 2007 Oct 2008-Mar 2009 Oct 2012-Mar 2013
Jun 2004-Jan 2005 Jun-Jul 2009 May 2014-Jun 2014 Slovenia January-May 2014 Oct 2012-Dec 2012 May 2014-Jun 2014
Note: the EES 2014 did not include Bulgaria;
6 I used the INTUNE mass survey data in the case of Italy in 2007 and 2009, since the 3rd and 4th rounds of the ESS were not implemented in this country.
7 Most of the fieldwork for the 7th round of the ESS was implemented after the ENEC fieldwork.
The only country in which the 5th round of the ESS was carried out after the INTUNE elite survey was Lithuania.
The INTUNE elite and the ESS surveys contained the same question, which I have used to obtain MPs and citizens positions. This question asks respondents to indicate their opinion using a 0 -10 scale, where 0 means that ‘[European]
unification has gone too far’ and 10 that ‘[European] unification should go further’.8 It is evident that both representatives’ and citizens’ positions about the EU are more complex, and that the levels of congruence for the measure I have chosen may not correspond to ideas about other features of the European integration process and the architecture and functioning of the EU (see Best, Lengyel and Verzichelli 2012; Sanders, Bellucci, Tóka and Torcal 2012).
However, it is not possible here to consider these other aspects since alternative questions are not available for both groups of surveys. In any case, the question I focus on can be considered an accurate reflection of general attitudes towards the process of European integration.
Regarding congruence measures, I consider them in two levels: system (congruence between citizens [C] and the position representing all representatives [R]) and party level (congruence between party voters [V] and the parties they vote for [P]). At the system level I compute two types of congruence measures. The first one reflect an understanding of congruence as a many-to- one relationship (Golder and Stramski 2010) – that is, emphasizing how far/
close an ideal representative is to a represented group (in this case, citizens).
More specifically, I focus on the relative citizen congruence (RCC) (Golder and Stramski 2010, 96) (equation 1). This measure represents the average absolute distance between R (the average position of representatives) and Ci (the position of each individual citizen), relative to the dispersion of citizens’ positions with respect to their most preferred position – that is, the citizen median position (MC). In mathematical terms:
(1) This measure ranges from 0 to 1, where 0 implies absolute congruence – the ideological location of R minimizes the sum of absolute distances between the citizens.
8 The question wording in the INTUNE-ENEC and the ESS is slightly different. In the ESS it says:
“Now thinking about the European Union, some say European unification should go further. Others say it has already gone too far. Using this card, what number on the scale best describes your position?” In the INTUNE-ENEC elite surveys the wording is: “Some say European unification should be strengthened. Others say it already has gone too far. What is your opinion? Please indicate your views using a 10-point-scale. On this scale, ‘0’ means unification “has already gone too far” and ‘10’ means it “should be strengthened”. What number on this scale best describes your position?”
N
i N i
R Ci
MC RCC Ci
1 1
|
|
|
1 |
CORVINUS JOURNAL OF SOCIOLOGY AND SOCIAL POLICY VOL. 8 (2017)3S
As I have mentioned above, one of the operational problems with congruence has to do with the measure to be used. Compared to other alternatives to measure the many-to-one congruence, such as the absolute median citizen congruence (the one most frequently used in congruence studies) and the absolute citizen congruence9 , the RCC has the advantage of both taking into account the distribution of positions among citizens and allowing for comparisons between countries (Golder and Stramski 2010: 94).10
Along with how the positions of individual citizens match those of specific ideal representatives (one-to-many congruence), I am also interested in how well the different positions/preferences in a representative body match those of the represented population. Here, instead of the measure proposed by Golder and Stramski (2010, 96) I follow the one proposed by Andeweg (2011), which is:
9 The absolute median citizen congruence (AMCC), compares the absolute distance between R and the median citizen (MC). The formula is (Golder and Stramski 2010, 96):
where R is the average position of MPs by country at each moment (survey). Therefore, the lower the AMCC, the higher the congruence.
The absolute citizen congruence (ACC) compares the average absolute distance between R and each citizen Ci. As in the AMCC, lower scores indicate higher congruence. The formula is (Golder and Stramski 2010, 96):
10 The average median citizen congruence has been criticized, since it does not take into account the distribution of positions among citizens, while average citizen congruence does. However, both of these measures are absolute measures of congruence – that is, they only consider the absolute distance or the average absolute distance between R and MC or C, and do not take into account the dispersion of C in each country. In contrast, relative citizen congruence does take into account such dispersion. When doing this, what the RCC does is to compare the distances between R and C in each country on the same ideal scale. Therefore, in absolute terms it is possible (and this is the example that Golder and Stramski mention [2010: 94]) that, with the same positions of R, representatives in country A may be more congruent in absolute terms (ACC) compared to country B, but in relative terms (RCC) representatives in country B, with a higher dispersion, may be more congruent, since they produce better congruence “relative to what is possible”.
Andeweg’s many-to-many congruence =
x
) (x
FC if FC(x)FR(x) (4)
) (x
FR if FC(x)>FR(x)
This measure ranges from 0 to 1, where 0 implies absolute congruence – the ideological location of R minimizes the sum of absolute distances between the citizens.
As I have mentioned above, one of the operational problems with congruence has to do with the measure to be used. Compared to other alternatives to measure the many-to-one congruence, such as the absolute median citizen congruence (the one most frequently used in congruence studies) and the absolute citizen congruence9 , the RCC has the advantage of both taking into account the distribution of positions among citizens and allowing for comparisons between countries (Golder and Stramski 2010: 94).10
Along with how the positions of individual citizens match those of specific ideal representatives (the representatives (one-to-many congruence), I am also interested in how well the different positions/preferences in a representative body match those of the represented population. Here, instead of the measure proposed by Golder and Stramski (2010, 96) I follow the one proposed by Andeweg (2011), which is:
9 The absolute median citizen congruence (AMCC), compares the absolute distance between R and the
median citizen (MC). The formula is (Golder and Stramski 2010, 96):
|
|MC R
AMCC (2)
where R is the average position of MPs by country at each moment (survey). Therefore, the lower the AMCC, the higher the congruence.
The absolute citizen congruence (ACC) compares the average absolute distance between R and each citizen Ci. As in the AMCC, lower scores indicate higher congruence. The formula is (Golder and Stramski 2010, 96):
| 1 |
1
R N Ci
ACC N
i
(2)
10 The average median citizen congruence has been criticized, since it does not take into account the distribution of positions among citizens, while average citizen congruence does. However, both of these measures are absolute measures of congruence – that is, they only consider the absolute distance or the average absolute distance between R and MC or C, and do not take into account the dispersion of C in each country. In contrast, relative citizen congruence does take into account such dispersion. When doing this, what the RCC does is to compare the distances between R and C in each country on the same ideal scale. Therefore, in absolute terms it is possible (and this is the example that Golder and Stramski mention [2010: 94]) that, with the same positions of R, representatives in country A may be more congruent in absolute terms (ACC) compared to country B, but in relative terms (RCC) representatives in country B, with a higher dispersion, may be more congruent, since they produce better congruence
“relative to what is possible”.
Andeweg’s many-to-many congruence compares the distribution functions of citizens (Fc) and representatives (FR). The index would be the sum at each point of the 0-10 scale (or whatever the range in a non-continuous scale) of the lower percentage between Fc (x) (the proportion of citizens that place themselves at point x) and FR (x) (the proportion of representatives that place themselves at the same point). In the case that Fc (x) = FR (x), either of them (in the formula, Fc (x)) should be added to the sum. In other words, Andeweg’s many-to-many congruence index measures the common overlap between the two distribution functions. So, the higher the percentage of overlap between the two distributions, the higher the congruence.
For the party-level analysis, I only consider the many-to-one measure, in this case, the relative voter-party congruence (RVC). I do not include many- to-many congruence because this is a measure mostly designed to account for the representativeness of systemic political bodies. I also examine the responsiveness measure suggested by Achen (1978) and used in several studies (i.e. Dalton 1985; 2015; Mattila and Raunio 2006; 2012). This measure is computed as
Responsiveness (Achen): P = a + bV (5)
where the equation represents the regression of the average party position P on the mean voter position V. Perfect congruence occurs when the intercept a=0 and the coefficient b=1. An intercept a ≠ 0 implies an inbuilt positional bias in the parties with respect to the voters, while the coefficient b indicates the degree of convergence/divergence between parties and voters (b > 1 indicates that parties tend to be more polarized than voters, while b < 1 implies the opposite: that voters are more polarized than their representatives).
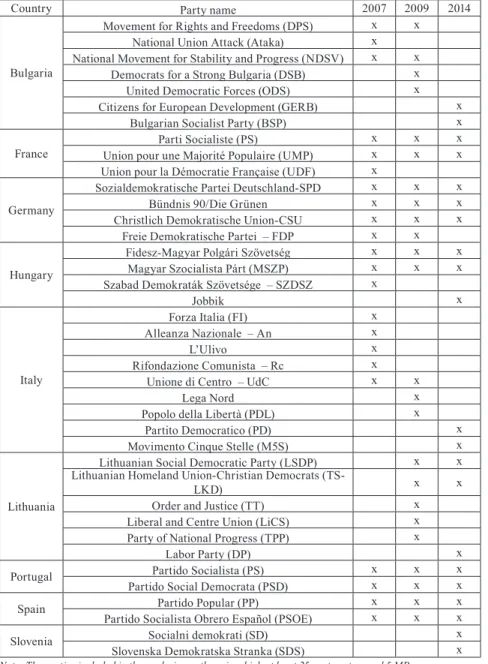
In order to compute parties’ and voters’ positions, the studies I have consulted use different criteria. For instance, despite the fact that all of them use EES data, Costello et al. (2012) employ quite conservative criterion as they include only those parties where at least 50 voters and 5 candidates were interviewed, while Dalton (2015) analyzes parties with 20 or more voters and 2 or more candidates, and Raunio and Mattila (2012) include in their analysis parties with 10 or more voters (they use voters’ placements of parties). The criterion I use in the analysis described in this article lies somewhere in-between those mentioned above. I analyze parties where at least 25 party voters and 5 MPs were interviewed. In fact, this means that I am considering mostly parties with a relevant share of the
CORVINUS JOURNAL OF SOCIOLOGY AND SOCIAL POLICY VOL. 8 (2017)3S
seats in their respective parliament, given the characteristics of the sample.11 The parties are included in Table A.2 in the Appendix.
RESULTS
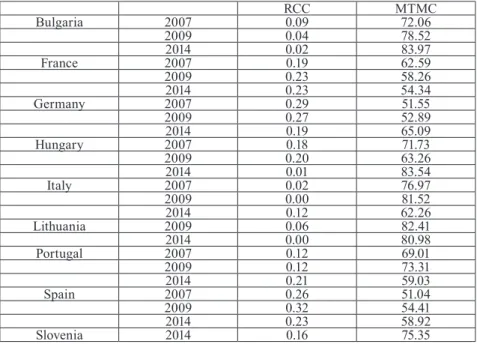
Table 2 shows the results of the analysis at a system level. The two measures of congruence are highly and significantly correlated (Spearman’s rho = -0.92, p=0.000). So, independently of the specific computational characteristics, these variables clearly measure the same phenomenon.
Table 2. Different measures of congruence between citizens and MPs regarding EU issues (by country and year)
RCC MTMC
Bulgaria 2007 0.09 72.06
2009 0.04 78.52
2014 0.02 83.97
France 2007 0.19 62.59
2009 0.23 58.26
2014 0.23 54.34
Germany 2007 0.29 51.55
2009 0.27 52.89
2014 0.19 65.09
Hungary 2007 0.18 71.73
2009 0.20 63.26
2014 0.01 83.54
Italy 2007 0.02 76.97
2009 0.00 81.52
2014 0.12 62.26
Lithuania 2009 0.06 82.41
2014 0.00 80.98
Portugal 2007 0.12 69.01
2009 0.12 73.31
2014 0.21 59.03
Spain 2007 0.26 51.04
2009 0.32 54.41
2014 0.23 58.92
Slovenia 2014 0.16 75.35
Note: RCC: Relative citizen congruence (many-to-one measure); MTMC: Andeweg’s many-to-many congruence.
11 The theoretical sample size in INTUNE was set at 80 MPs per parliament. In ENEC, this sample size was kept for larger parliamentary assemblies (above 300 seats) and 50 in the rest. So, for instance, in the case of ENEC, a sample of 5 MPs for a party was equivalent to a party parliamentary group of 39 members in the Bundestag (a 6% of the 631 members of the chamber); and to a group of 12 in Croatia (where final sample size was set at 60) where the Sabor has 151 members (8% of the chamber).
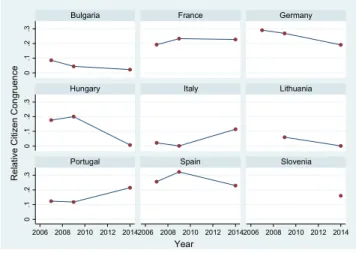
In fact, Table 1 and, more clearly, Figure 1 does not show any discernible general pattern of change in relative citizen congruence across countries.
While in some countries, like Hungary, Spain, Germany or Lithuania, there is a significant increase in congruence during the crisis, in others (Italy and Portugal) the opposite pattern is observed. In Bulgaria and France, there was hardly any change between 2009 and 2014.
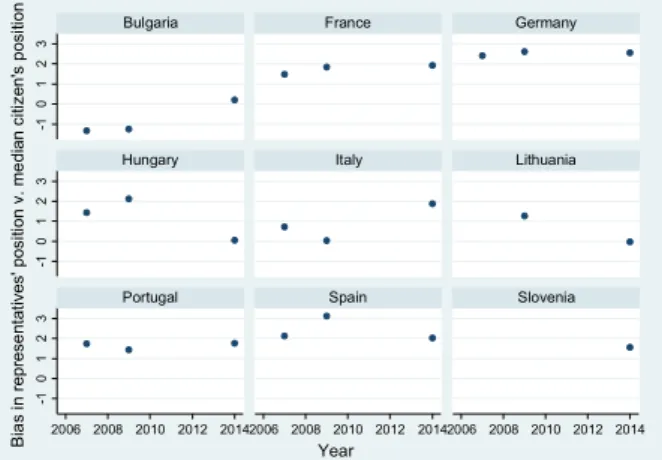
Figure 2 offers a glimpse to the directionality of the shifts in representatives’
and citizens’ positions during the considered period. Again, there is no general pattern. For every country we find a different situation. Therefore, the increase in congruence in Hungary in 2014 is the consequence of the approximation of the average representative’s position to the more Eurosceptic position of the median citizen, while in Spain it is a result of the shift of the median citizen to a more pro-EU position. In Germany and Portugal, we observe that the respective increase and decrease in congruence are not the consequence of a displacement of the average positions of representatives or the median citizen, but the result from changes in the relative distribution of the positions of the citizens with respect to the representative’s average position. In Italy, there is a simultaneous divergence in 2014 in the positions of citizens (less pro-EU than in 2009) and their representatives (more pro-EU). The opposite occurs in Lithuania, where the slight increase in congruence in 2014 seems to be the result of a convergence of both representatives and citizens to similar positions. Finally, in France, it is evident the stalemate in both representatives’ average and citizens’ median positions during the whole period.
With respect to a between-countries comparison, we observe that countries with higher average levels of congruence during the period (lower RCCs) are Lithuania, Bulgaria and Italy (despite the considerable decrease in congruence in 2014 in the latter), while those where the preferences of citizens differ the most from those of MPs are Spain, Germany and France.12
12 It is remarkable that, in 2014, MPs from Spain, Italy and Germany were the most enthusiastic about the strengthening of the EU integration process (means of 8, 7.9, and 7.6, on the 0-10 scale, respectively).
CORVINUS JOURNAL OF SOCIOLOGY AND SOCIAL POLICY VOL. 8 (2017)3S
Figure 1. Many-to-one congruence between citizens and MPs on the EU dimension, by country and year (relative citizen congruence)
Note: Lower figures imply higher congruence.
Figure 2. Average representatives’ position vs. median citizens’ position on the EU dimension, by country and year
With respect to the many-to-many measure, comparative results are in line with those of the RCC. Table 1 shows that the countries where, on average, parliaments are more representative of the distribution of citizens’ preferences
0.1.2.30.1.2.30.1.2.3
2006 2008 2010 2012 20142006 2008 2010 2012 20142006 2008 2010 2012 2014
Bulgaria France Germany
Hungary Italy Lithuania
Portugal Spain Slovenia
Relative Citizen Congruence
Year
20072009 2014
20072014 2009
20142007 2009
2007 2014
2009 2009
2014 2007
2009 2014
20072009 2014
2009 20142007
2014
567856785678
5 6 7 8 5 6 7 8 5 6 7 8
Bulgaria France Germany
Hungary Italy Lithuania
Portugal Spain Slovenia
Representatives' average position
Citizens' median position
on the issue of the EU are also Lithuania, Bulgaria and Italy, and those less representative are again Spain (though the Spanish parliament in 2014 was significantly more representative than in 2007), Germany and France. With respect to the other countries, the difference between the average RCC and the many-to-many congruence in Hungary is remarkable. Regarding changes during the crisis, we observe an acute decrease in the representativeness of the Italian Camera dei Deputati in 2014 with respect to 2009 (almost 19.2% less overlap between the distribution of citizens’ and MPs’ positions) and in Portugal.
In contrast, we observe a significant increase in many-to-many congruence in Hungary (20.3%) and Germany (12.2%).
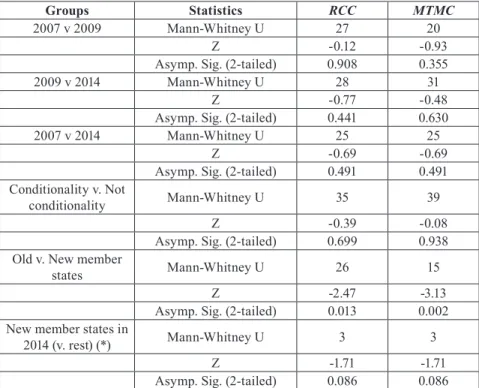
Table 3 shows the results of the statistical analyses testing of the three hypotheses at a system level. Given the low number of observations, I opted for a bivariate approach, using the Mann-Whitney U non-parametric test of differences between two groups. This test is applied to the two congruence measures presented above.
Table 3. Bivariate test of hypotheses (system level)
Groups Statistics RCC MTMC
2007 v 2009 Mann-Whitney U 27 20
Z -0.12 -0.93
Asymp. Sig. (2-tailed) 0.908 0.355
2009 v 2014 Mann-Whitney U 28 31
Z -0.77 -0.48
Asymp. Sig. (2-tailed) 0.441 0.630
2007 v 2014 Mann-Whitney U 25 25
Z -0.69 -0.69
Asymp. Sig. (2-tailed) 0.491 0.491 Conditionality v. Not
conditionality Mann-Whitney U 35 39
Z -0.39 -0.08
Asymp. Sig. (2-tailed) 0.699 0.938 Old v. New member
states Mann-Whitney U 26 15
Z -2.47 -3.13
Asymp. Sig. (2-tailed) 0.013 0.002 New member states in
2014 (v. rest) (*) Mann-Whitney U 3 3
Z -1.71 -1.71
Asymp. Sig. (2-tailed) 0.086 0.086
Note: N=24. RCC: Relative citizen congruence; MTMC: Many-to-many congruence. (*) Only includes observations for new member states (N=9).
CORVINUS JOURNAL OF SOCIOLOGY AND SOCIAL POLICY VOL. 8 (2017)3S
Neither of the three hypotheses presented above receive support in this system analysis. During the crisis there was no significant change in the levels of congruence with respect to the pre-crisis periods. Moreover, in those countries more severely hit by the negative economic and social consequences of the crisis that had to resort to a financial assistance program, the levels of congruence with respect to EU integration are not significantly different than those of countries that did not. In addition, the analysis in Table 3 does not confirm Hypothesis 3 (no change in congruence during the crisis between old and new member states). Thus, representatives in new member states are, in general, more congruent with their fellow citizens, and during the crisis parliaments of the new member states became significantly more representative of their respective societies with respect to EU issues (though Z scores are statistically significant only at p=0.09).
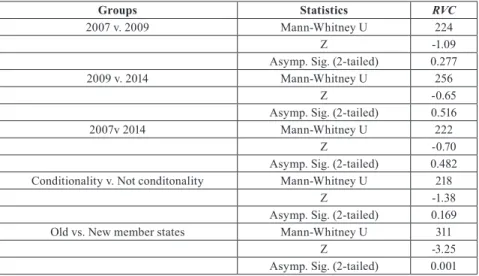
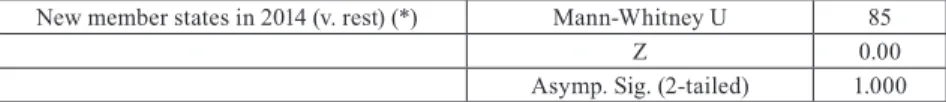
Concerning congruence at the party level, Table 4 also shows the bivariate analyses of the many-to-one congruence variable (relative voter congruence) between parties and their voters. Neither Hypothesis 1 nor Hypothesis 2 are confirmed: party congruence is not affected by the crisis nor we observe a different pattern in countries subject to conditionality. In the case of Hypothesis 3, parties in new member states are generally closer to their voters than in old member states though, in contrast with the system analysis, there is no difference in the degree of congruence in these countries before and after the crisis, so Hypothesis 3 is confirmed for the party level of analysis.
Table 4. Bivariate test of hypotheses (party level)
Groups Statistics RVC
2007 v. 2009 Mann-Whitney U 224
Z -1.09
Asymp. Sig. (2-tailed) 0.277
2009 v. 2014 Mann-Whitney U 256
Z -0.65
Asymp. Sig. (2-tailed) 0.516
2007v 2014 Mann-Whitney U 222
Z -0.70
Asymp. Sig. (2-tailed) 0.482 Conditionality v. Not conditonality Mann-Whitney U 218
Z -1.38
Asymp. Sig. (2-tailed) 0.169
Old vs. New member states Mann-Whitney U 311
Z -3.25
Asymp. Sig. (2-tailed) 0.001
New member states in 2014 (v. rest) (*) Mann-Whitney U 85
Z 0.00
Asymp. Sig. (2-tailed) 1.000 Note: N=70. AMCC: Absolute median citizen congruence; ACC: Absolute citizen congruence; RCC: Relative citizen congruence. (*) Only includes observations for new member states (N=27).
These results are confirmed by multivariate analysis. Table 5 shows the results for Achen’s (1978) responsiveness and additional models including the independent variables of interest. After excluding a very influential observation13, all models are statistically significant.
Table 4. Multivariate test of hypotheses (party level)
Models (1) † (2) (3) (4) (5) (6) (7)
Variables Average voter
position (EU) 0.35* 0.35* 0.36* 0.52*** 0.35* 0.36* 0.57***
(0.130) (0.124) (0.132) (0.060) (0.124) (0.131) (0.090)
Year 2014 0.04 0.04 0.00 -0.03
(0.141) (0.141) (0.157) (0.273)
Conditionality 0.14 0.14 0.36
(0.403) (0.438) (0.199)
New member
state -1.10*** -1.20*
(0.290) (0.422)
New member x
Year 2014 0.19
(0.591) Constant 5.04*** 5.01*** 4.94*** 4.44*** 5.01*** 4.94*** 4.13***
(0.802) (0.745) (0.852) (0.295) (0.745) (0.819) (0.476)
Observations 69 69 69 69 69 69 69
R-squared 0.085 0.086 0.087 0.330 0.086 0.087 0.344
Adj. R-squared 0.07 0.06 0.06 0.31 0.06 0.05 0.29
N clusters 10 10 10 10 10 10 10
Note: OLS regression. Robust standard errors clustered by country in parentheses. † Achen’s responsiveness;
*** p<0.005, ** p<0.01, *p<0.05, + p<0.1. Dependent variable: Average party EU position. The reference category for ‘Year 2014’ is ‘2007 or 2009’. The reference category for ‘Conditionality’ is ‘Country not subject to financial assistance programs’. The reference category for ‘New member state’ is ‘Old member states’ (EU members before 2003).
As indicated above, Achen’s responsiveness measure (Model 1) is the result of regressing the average positions of parties on the average positions of voters.
The constant of the model is 5.04, which indicates that parties are far more supportive of EU integration than their average voters (remember that perfect
13 This observation corresponded to the party Jobbik in 2014.
CORVINUS JOURNAL OF SOCIOLOGY AND SOCIAL POLICY VOL. 8 (2017)3S
congruence would require the constant to be 0). Moreover, the coefficient of the average party voter position is statistically significant and lower than 1 (0.35), which means that voters’ positions are more polarized on this issue than those of parties.
With respect to the models for testing the hypotheses, as in the bivariate analysis, only the New member states variable is statistically significant. The negative coefficient in the models that include this independent variable (4 and 7) indicates that the positions of voters and parties are in general,closer in those countries (that is, the level of congruence is higher). The interaction between New member states and 2014, which tests Hypothesis 3, is statistically not significant, confirming such hypothesis, that is, during the crisis there was no significant change in the congruence between parties and the average voter in new EU member states compared parties in the other states.
CONCLUDING DISCUSSION
This article’s main goal was checking whether the economic and political crisis that has affected EU countries since 2009 had any effect on the degree of congruence between citizens and their representatives concerning their support for European integration. In this respect, the analysis described in the previous pages did not detect a general pattern of evolution of congruence affecting all the countries in the sample. Therefore, congruence has evolved differently depending on the country. This applies both to the many-to-one (relative citizen congruence) and the many-to-many views of congruence.
In addition to the absence of such a general descriptive pattern of evolution during the crisis the analysis has also shown that the crisis has not affected congruence concerning European integration in the studied countries neither at the system (congruence between citizens and their representatives considered as a whole) nor at the party level (congruence between parties and their voters). This applies even to those countries most affected by the negative economic consequences of the crisis – those subject to financial assistance programmes.
These results suggest that, in general terms, the crisis did not activate a process of convergence between citizens and their representatives concerning European integration in the countries under analysis. As it occurred before 2009, during the crisis parliamentary elites remained, in general terms, significantly more pro-EU than the citizens or voters they represented (see Figures A1 and A2 in
the Appendix). This stability could be interpreted as a manifestation of the lack of attraction of the EU dimension as a field of political dispute, at least for most of those European parties with higher shares of seats of the parliament – which are those included in the analysis according to the selection criterion I have used (see above). Therefore, it seems that there is still room for politicization of the EU dimension in most of these countries.
The previous analysis has also detected a difference in the congruence patterns between old and new EU member states. Both at a system and a party level, representatives in new EU member states are closer to the positions of their fellow citizens and voters. Moreover, this general pattern has not changed during the crisis. This result is at odds with those obtained by Mattila and Raunio (2012), which detected in 2009 that levels of congruence in parties in new member states decreased below those in old members, reversing the situation the same authors found in the 2004 European Parliament election (Mattila and Raunio 2006). The only explanation I find for this discrepancy is the different data sources used by these authors (European Election Survey), the different sample size (they include all 27 member states) and the different operationalization of representatives’
positions (they use voters’ assessments of parties’ positions). So Mattila and Raunio’s (2012) results, in fact, confirm that perceptions of distances between voters and the parties they voted for concerning EU integration grew in new member states in 2009 compared to the same perceptions in 2004. In this study, what I have shown is that (though data are limited to a less numerous group of countries) actual positions of parliamentary representatives in new member states concerning EU integration are generally much closer to the positions of their fellow citizens/voters than in the case of representatives in old member states. And this pattern has not changed during the considered period.
In sum, the situation in terms of congruence between citizens/voters and their representatives concerning the EU is pretty much the same that it was before the crisis. Of course, this conclusion is must be taken with caution, given the reduced number of countries and the way positions concerning the EU positions are operationalized, focusing only on the general level of support for the advancement of European integration. Therefore, it is possible that in other relevant aspects concerning the EU and its performance during the crisis (for instance, the evaluation of the functioning of EU institutions or specific preferences on the Europeanization of policy making) another picture may emerge. At this moment, however, we do not have the data to provide an answer to this question.
In this respect, I would like to make a final remark regarding the data I have used. Using data from elite surveys to study congruence has a particular disadvantage: these are data very costly to produce. This may make other
CORVINUS JOURNAL OF SOCIOLOGY AND SOCIAL POLICY VOL. 8 (2017)3S
sources of information much more attractive to researchers in terms of cost- effectiveness. Nevertheless, I think the price is worth to pay if we consider that using different sources may produce different conclusions (as in the case of the results obtained above for the new member states); and that neither of the alternative data sources provide a more accurate picture of the positions of representatives (particularly, if we compare data from elite surveys to citizens’
placements of parties).
REFERENCES
Achen, Christopher H. 1978. “Measuring Representation.” American Journal of Political Science 22(3): 475–510.
Achen, Christopher H., and Larry M. Bartels. 2016. Democracy for Realists:
Why Elections Do Not Produce Responsive Government. Princeton: Princeton University Press.
Adams, James. 2001. Party Competition and Responsible Party Government.
Ann Arbor: University of Michigan Press.
Andeweg, Rudy B. 2011. “Approaching Perfect Policy Congruence:
Measurement, Development, and Relevance for Political Representation.”
In How Democracy Works: Political Representation and Policy Congruence in Modern Societies, eds. Martin Rosema, Bas Denters, and Kees Aarts.
Amsterdam: Pallas Publications/Amsterdam University Press, 39–52.
Armingeon, Klaus, and Besir Ceka. 2013. “The Loss of Trust in the European Union during the Great Recession since 2007: The Role of Heuristics from the National Political System.” European Union Politics 15(1): 82–107.
Bakker, R., S. Jolly, and J. Polk. 2012. “Complexity in the European Party Space: Exploring Dimensionality with Experts.” European Union Politics 13(2): 219–45.
Bartels, Larry M. 2013. “Political Effects of the Great Recession.” The ANNALS of the American Academy of Political and Social Science 650(1): 47–76.
Best, Heinrich, György Lengyel, and Luca Verzichelli, eds. 2012. The Europe of Elites: A Study into the Europeanness of Europe’s Political and Economic Elites. Oxford: Oxford University Press.
Braun, Daniela, and Markus Tausendpfund. 2014. “The Impact of the Euro Crisis on Citizens’ Support for the European Union.” Journal of European Integration 36(3): 231–45.
Clements, Ben, Kyriaki Nanou, and Susannah Verney. 2014. “‘We No Longer Love You, But We Don’t Want To Leave You’: The Eurozone Crisis and