R E S E A R C H A R T I C L E Open Access
Retinal and choroidal thickness measurements using spectral domain optical coherence
tomography in anterior and intermediate uveitis
Zsuzsanna Géhl*, Kinga Kulcsár, Huba JM Kiss, János Németh, Otto A Maneschg and Miklós D Resch
Abstract
Background:Macular edema is a common cause of visual loss at uveitic patients. The aim of our study was to investigate retinal and choroidal thickness at the macula in anterior (AU) and intermediate (IMU) uveitis and in healthy individuals using spectral domain optical coherence tomography (SD-OCT).
Methods:Case-control study of 21 patients with AU and 23 patients with IMU and 34 age-matched healthy controls was performed with Spectralis SD-OCT (Heidelberg Engineering, Germany). High resolution SD-OCT scans and macular mapping were applied for automated measurement of retinal thickness. Standardized, masked manual measurement of the choroidal thickness was performed in the center of the ETDRS fields on enhanced depth imaging (EDI) scans.
Evaluation of central retinal subfield thickness, 3 mm and 6 mm perifoveal rings was performed in the corresponding ETDRS zones in patient groups.
Results:The mean central retinal subfield thickness was significantly higher in IMU (368.65 ± 115.88μm, p = 0.0003), but not significantly different in AU (290.42 ± 26.37μm p = 0.6617) compared to that of in controls (278.55 ± 18.31μm).
In both uveitis groups retina was significantly thicker in the 3 and 6 mm perifoveal rings than that of in controls (359 ± 15.24μm in AU and 390.55 ± 70.90μm in IMU vs 345,41 ± 15.28μm in the control group, p = 0.0388 and p < 0.0001) in the 3 mm and (313.83 ± 16.63μm in AU and 343.33 ± 57.29μm in IMU vs 299 ± 13.82μm in the control group, p = 0.0171 and p < 0.0001) in the 6 mm ring. Central choroidal thickness was 311.94 ± 60.48μm in the control eyes, showed no significant difference in AU (312.61 ± 90.35μm) and IMU (303.17 ± 93.66μm) eyes, and was also similar at the perifoveal rings.
Conclusion:Significant topographical changes could be detected in the macula of AU and IMU patients. Retinal thickness in the perifoveal rings was increased both in AU and IMU, but in the center only in IMU. Choroidal thickness seems to be unaffected by uveitis, even in the presence of macular edema, at least in the early stage of the inflammatory disease process.
Keywords:Anterior uveitis, Enhanced depth imaging, Intermediate uveitis, Macular edema, Optical coherence tomography
Background
Anterior uveitis (AU) is the most common type of uveitis (49%) and the proportion of intermediate uveitis (IMU) is also estimated to be above the 10% threshold in referral centers [1,2]. According to the Standardization of Uveitis Nomenclature Working Group (SUN), in AU the primary site of inflammation is the anterior chamber and in IMU
it is the vitreous. In the background of both types of uve- itis numerous etiological causes are recognized [3].
Macular edema is the most common cause of perman- ent visual loss in IMU. Nevertheless, macular edema may occur in any type of ocular inflammation, among others in AU as well [2,4,5]. The presence of cystoid macular edema in AU is not uncommon, but especially in the early inflammatory process it evolves into only diffuse macular thickening [2,4]. Early recognition of macular edema is important in the visual outcome. If
* Correspondence:zsuzsannagehl@gmail.com
Department of Ophthalmology, Semmelweis University Budapest, Mária u. 39, Budapest H-1085, Hungary
© 2014 Géhl et al.; licensee BioMed Central Ltd. This is an Open Access article distributed under the terms of the Creative Commons Attribution License (http://creativecommons.org/licenses/by/4.0), which permits unrestricted use, distribution, and reproduction in any medium, provided the original work is properly credited. The Creative Commons Public Domain Dedication waiver (http://creativecommons.org/publicdomain/zero/1.0/) applies to the data made available in this article, unless otherwise stated.
persisting for several months, macular edema gives rise to irreversible photoreceptor damage leading to per- manent loss of central vision. With delayed treatment of macular edema only limited visual recovery can be achieved [6].
Subclinical macular edema may be easily misdiagnosed by performing biomicroscopy, but with the help of op- tical coherence tomography (OCT) macular edema can be detected already in an early phase [4,5]. Recently the introduction of the spectral-domain OCT (SD-OCT) im- proved not only retinal image resolution, but some in- strumental setups now allow a better visualization of the choroid as well. The Spectralis (Heidelberg Engineering, Heidelberg, Germany) incorporating software, with its enhanced depth imaging (EDI) technology allows for the good quality imaging of the choroid, permitting the qualitative and quantitative analysis of this layer [7].
EDI-ready devices gained great significance in the detec- tion of inflammatory processes involving the choroid.
The aim of the present study was to determine the ret- inal and choroidal thickness in the macula in AU and IMU patients. In AU and IMU macular edema can be a structural complication affecting the posterior segment [3]. Further aim of the study was to correlate retinal and choroidal changes in uveitic macular edema.
Methods
A retrospective analysis was performed on 44 eyes of 44 consecutive uveitic patients (21 AU and 23 IMU eyes) and 34 eyes of 34 healthy subjects, who underwent OCT examination using Heidelberg Spectralis SD-OCT be- tween January 2012 and January 2013 at the Department of Ophthalmology at Semmelweis University. The study was approved by the local Ethics Committee (ETT TUKEB) and was conducted in accordance with the Declaration of Helsinki. One eye per patient was selected as the study eye. If the inflammation was bilateral, the eye with better visualization of the choroid–scleral junc- tion on OCT images was chosen.
Normal subjects had 20/20 best corrected visual acuity with a refractive error level below +6.0 or -6.0 diopters, and they did not have any ocular pathology or any oph- thalmic surgery in the history.
Inclusion criteria of uveitic patients were: active biomi- croscopic signs of AU or IMU. OCT examination was performed on the first visit of the patient with newly di- agnosed uveitis at our uveitis center, or on the first visit of the patients with recurrence after a quiescent period.
The anatomic localization of the uveitis was established according to SUN criteria [3]. After detailed medical his- tory and slit lamp examination standard diagnostic work up (laboratory examination including complete blood counts, comprehensive metabolic panel, erythrocyte sedimentation rate, C-reactive protein, chest x-ray), and in selected cases
with the suspect of specific etiology: QuantiFERON-TB Gold, angiotensin-convertase enzyme, immune panel, sacroiliacal x-ray, brain MRI, chest CT, and specific serological assays were performed regarding herpes vi- ruses, lues, toxoplasmosis, bartonella and borrelia.
In this series we had three patents in AU group with rheumatological signs and HLA-B27 positivity. Either in AU or in IMU group patients with other proved specific and systemic etiology, and infectious origin were excluded.
Further exclusion criterion was vitreoretinal traction or epiretinal membrane causing significant retinal distor- tion. Uveitis was in the early period of the inflammatory process in all patients. The OCT imaging was made at the first visit of the first or the recurrent inflammatory period, within 1-3 weeks, as far as possible we could tell from the patients history. In these cases the vitreous haze was maximum 2+ severity.
OCT acquisition and analysis protocol
All patients after pupil dilatation underwent SD-OCT im- aging by the Spectralis (Heidelberg Engineering Germany, Version 1.6.4.0). Images were acquired using horizontal raster pattern scans, which were obtained via a 20 × 20- degree (5.4 × 5.4) scan field, consisting of 49 sections.
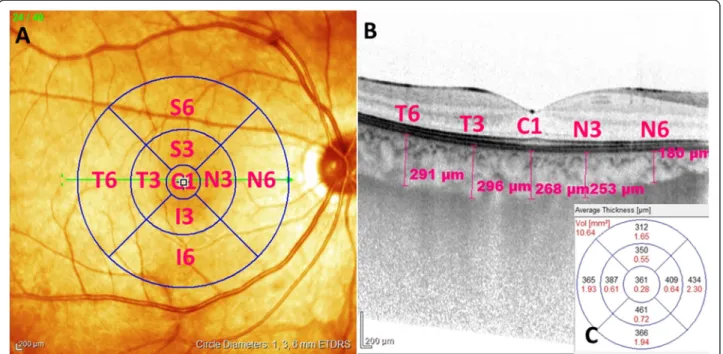
Retinal thickness in the 9 Early Treatment Diabetic Retinopathy Study (ETDRS) subfields was analyzed by the RT map analysis protocol. Choroidal thickness was measured with EDI scans, in the center of each ETDRS subfield (Figure 1A). The central subfield (CSF) was a region with a diameter of 1.0 mm around the fovea, and the inner and the outer rings had diameters of 3 and 6 mm. Choroidal thickness measurement was performed perpendicular to the RPE, going from the posterior RPE edge to the choroid–scleral junction in the center of all ETRDS subfields (Figure 1B). Evaluation of OCT scans and measurement of retinal and choroidal thickness was done by an independent and masked reader. Retinal and choroidal thickness in all ETDRS fields was recorded. The mean thickness of the 3 mm (average of S3, T3, N3 and I3 fields) and 6 mm (average of S6, T6, N6 and I6 fields) rings was calculated and used for further statistical analysis.
Statistical analysis
The statistical analysis was performed using the Statis- tica 11.0 software (Statsoft, Tulsa, OK, USA). Data distri- bution was checked by Shapiro-Wilk’s W test, which showed non-normally distributed data, hence nonpara- metric tests were conducted. Kruskal-Wallis one-way analysis of variance test was applied to compare mean retinal and choroidal thicknesses among the three pa- tient groups. Wilcoxon nonparametric test was the tool for comparative evaluation between CSF and perifoveal rings. Additionally we correlated retinal thickness to choroidal thickness at different measurement points
(Spearman rank correlation). Data were expressed as mean values ± standard deviation. Significance was ac- cepted for p < 0.05. Fisher exact test was used to deter- mine the rate of cystoid macular edema.
Receiver operating characteristic (ROC) curve was plotted by means of the Med Calc Version 12.5.0.0 soft- ware (Med Calc Software bvba, Ostend, Belgium), and the cut-off value was calculated from this curve.
Results
The study involved 78 participants. They were put into a control group (n = 34; mean age 37.4 ± 10.6 range: 23 to 67 years), an AU group (n = 21; mean age 41.2 ± 13.25 range: 21 to 73 years) and an IMU group (n = 23; mean age 39.7 ± 13.41 range: 22 to 80 years). The mean ages of the 3 groups were not significantly different (p = 0.5838, Kruskal-Wallis test), thus the control group was consid- ered age-matched.
Retinal thickness
Comparison of the mean retinal thickness at each retinal location of AU and IMU groups to the control group are shown in Figure 2. We also analyzed the retinal thick- ness in perifoveal concentric rings, the results and the p values for the differences between the groups are summa- rized in Table 1. CSF thickness was 278.55 ± 18.31μm for the control group, 290.42 ± 26.37 μm for the AU and 368.65 ± 115.88μm for the IMU group. There was no sig- nificant difference in the CSF thickness of the AU
patients and the control group, but the CSF thickness of the IMU patients was significantly higher than in healthy individuals (p = 0.0001). The retina was consid- erably thicker in both the 3 mm and the 6 mm zone, in the AU and IMU groups alike if compared to the con- trol group (Table 1).
Comparison of the CSF to the 3 and 6 mm perifoveal rings in each group showed that in the AU group the thickest region of the retina was the 3 mm ring, while it was the thinnest in the centrum, similar to the healthy ret- inas. In contrast to this in the IMU group the thickest part of the retina was the 3 mm ring but it was followed by the centrum and the thinnest region was the 6 mm ring.
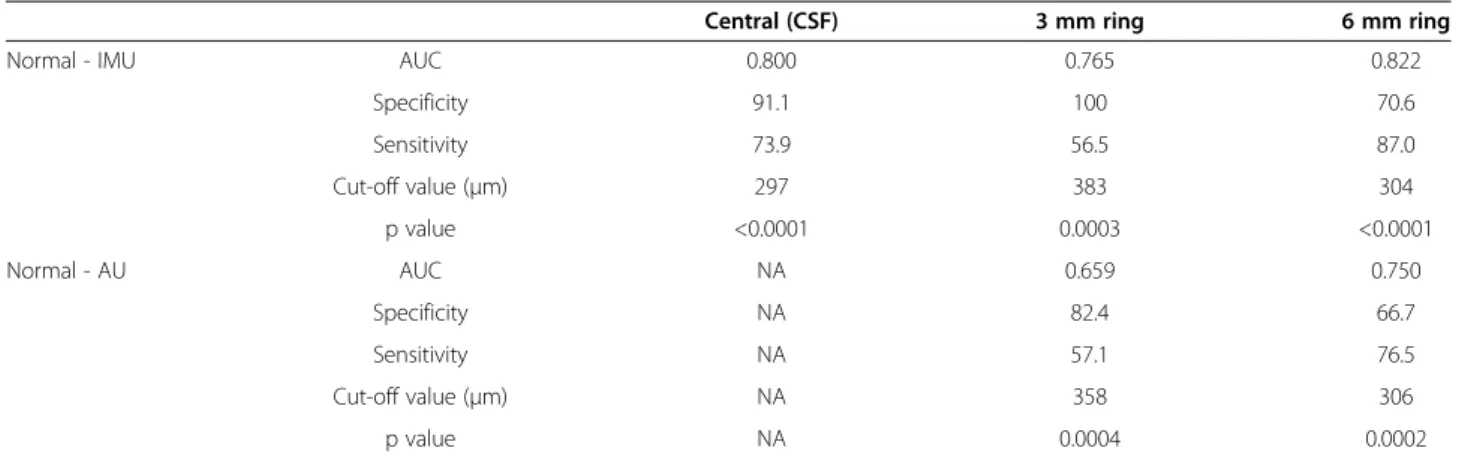
ROC analysis of retinal thickness results are summa- rized in Table 2. In the CSF analysis was not applicable in normal-AU relation due to the lack of significant dif- ference, while in the IMU group a substantial thickening of the retina in CSF was found.
Regarding the morphology of the macular thickening only one in 21 AU patients whereas 9 in 23 IMU pa- tients had cystoid macular edema (CME), (p = 0.007, Fisher exact test). We found central subretinal fluid (SRF) in four patients with cystoid and in two patients with diffuse type of macular edema - all 6 cases occurred among the IMU patients.
Choroidal thickness
Central choroidal thickness, measured at the fovea was 311.94 ± 60.48 μm in control eyes, 312.61 ± 90.35μm in
Figure 1Measurement of choroidal and retinal thickness in ETDRS fields. 1A. Demonstrates the 1, 3 and 6 mm diameter ETDRS circles superimposed on the pseudocolor infrared image. The horisontal line shows the cross section shown on1B,where choroidal thickness was measured manually with the inbuilt caliper in the center of each ETDRS field.1Cshows the automatically calculated average thickness and volume of the retina in the field.
the AU and 303.17 ± 93.66 μm in the IMU group. The difference was not significant between the groups in the centrum or in the perifoveal rings either (Kruskal-Wallis test, p = 0.6082) (Table 1).
Comparison of the CSF to the 3 and 6 mm perifoveal rings in each group showed that the choroidal thickness in the 3 and 6 mm ring was not different from the CSF in the AU and in the control groups. However, in IMU patients both 3 mm and 6 mm rings were different from the centrum (Wilcoxon test, p < 0.05) (Table 1).
Although in the IMU the choroidal thickness was significantly thinner in the nasal 6 mm quadrant than in the control group (p = 0.0364), none of the other
quadrants differed significantly from each other in terms of thickness in the three groups (Figure 3).
Correlation of retinal and choroidal structure
No significant correlation could be demonstrated be- tween retinal and choroidal thickness in the corre- sponding fields, neither in the AU nor in the IMU group (p > 0.05, Spearman rank correlation).
Discussion
Macular edema frequently accompanies AU and IMU [2]. Our study focused on the distribution of intraretinal and intrachoroidal fluid in AU and IMU according to
Figure 2Retinal thickness in the 9 fields (Mean ± SD).C1R = central subfiled, S3R = superior quadrant of 3 mm ring, S6R = superior quadrant of 6 mm ring, N3R = nasal quadrant of 3 mm ring, N6R = nasal quadrant of 6 mm ring, T3R = temporal quadrant of 3 mm ring, T6R = temporal quadrant of 6 mm ring, I3R = inferior quadrant of 3 mm ring, I6R = inferior quadrant of 6 mm ring. Significant differences are detailed in Table 1.
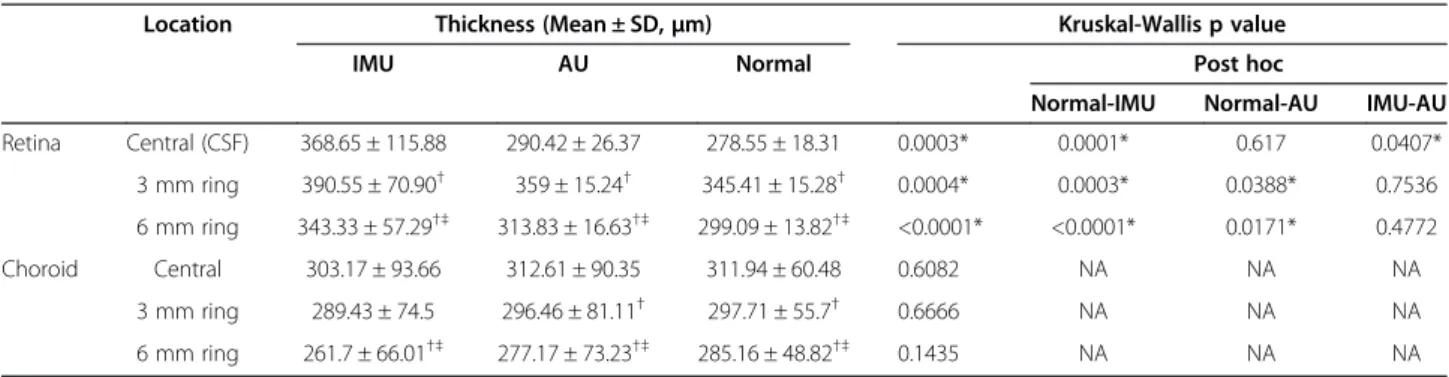
Table 1 Comparison of retinal thickness and choroidal thickness among groups with Kruskal-Wallis test
Location Thickness (Mean ± SD,μm) Kruskal-Wallis p value
IMU AU Normal Post hoc
Normal-IMU Normal-AU IMU-AU Retina Central (CSF) 368.65 ± 115.88 290.42 ± 26.37 278.55 ± 18.31 0.0003* 0.0001* 0.617 0.0407*
3 mm ring 390.55 ± 70.90† 359 ± 15.24† 345.41 ± 15.28† 0.0004* 0.0003* 0.0388* 0.7536 6 mm ring 343.33 ± 57.29†‡ 313.83 ± 16.63†‡ 299.09 ± 13.82†‡ <0.0001* <0.0001* 0.0171* 0.4772
Choroid Central 303.17 ± 93.66 312.61 ± 90.35 311.94 ± 60.48 0.6082 NA NA NA
3 mm ring 289.43 ± 74.5 296.46 ± 81.11† 297.71 ± 55.7† 0.6666 NA NA NA
6 mm ring 261.7 ± 66.01†‡ 277.17 ± 73.23†‡ 285.16 ± 48.82†‡ 0.1435 NA NA NA
IMU- Intermediate uveitis,AU- Anterior uveitis,CSF-Central subfield.
*- siginficant difference (Kruskal-Wallis test p < 0.05).
†Different from center (Wilcoxon test p < 0.05).
‡Different from 3 mm ring (Wilcoxon test p < 0.05).
NA= Not applicable.
ETDRS fields. To our best knowledge, ETDRS field based, detailed and combined evaluation of macular edema and choroidal thickness has not been described before in AU and IMU. The better understanding of the correlation between retinal and choroidal involvement in the above mentioned forms of occular inflammation could be achieved with our study.
Retinal thickness
Recent studies using OCT showed that in AU biomicros- copically often undetected macular edema becomes visu- alized even by means of normal retinal morphology [4,5].
Intermediate uveitis is frequently (in almost half of the cases) accompanied by macular edema [2].
Shulman et al described that some degree of macular edema can be found even in mild anterior uveitis [5].
Our results support this observation. In contrast to this, as regards the CSF thickness we did not find significant difference in the CSF thickness between individuals with AU and age-matched controls, but the retinal thickness was substantially higher in both the 3 mm and the 6 mm rings, retaining the retinal arrangement similar to normal maculae [8]. Our results are in accordance with Castellano et al., namely that in AU the retinal thicken- ing is present typically in perifoveal ring-like distribution Table 2 ROC analysis of retinal thickness values
Central (CSF) 3 mm ring 6 mm ring
Normal - IMU AUC 0.800 0.765 0.822
Specificity 91.1 100 70.6
Sensitivity 73.9 56.5 87.0
Cut-off value (μm) 297 383 304
p value <0.0001 0.0003 <0.0001
Normal - AU AUC NA 0.659 0.750
Specificity NA 82.4 66.7
Sensitivity NA 57.1 76.5
Cut-off value (μm) NA 358 306
p value NA 0.0004 0.0002
The high sensitivity and specificity of the cut-off value received as a result of the ROC-analysis in the central retinal thickness allows us to use the 297μm as a lower threshold for the macular edema in IMU.
AUC- Area under curve,CSF-Central subfield.
NA= Not applicable.
Figure 3Choroidal thickness in the 9 fields (Mean ± SD).C1C = central subfiled, S3C = superior quadrant of 3 mm ring, S6C = superior quadrant of 6 mm ring, N3C = nasal quadrant of 3 mm ring, N6C = nasal quadrant of 6 mm ring, T3C = temporal quadrant of 3 mm ring, T6C = temporal quadrant of 6 mm ring, I3C = inferior quadrant of 3 mm ring, I6C = inferior quadrant of 6 mm ring. Significant differences are detailed in Table 1.
[9]. This result suggests the importance of OCT examin- ation in all types of AU, and that the assessment should especially take into account the 3 mm inner ETDRS ring values, not only CSF thickness. Interestingly in the IMU group we also found a similar architecture, i.e. the 3 mm ring with the highest retinal thickness, followed by the CSF and the relative thinnest outer 6 mm ring. On the contrary, in the AU group all three zones were signifi- cantly thicker than in the control group. While among the 21 AU patients we found only one patient with CME, nine patients out of 23 in the IMU group had CME. In agree- ment with the findings of other workgroups, our data show that the diffuse type of macular edema is much more characteristic of AU than of CME [4].
Another OCT feature connected to IMU is SRF which we found in six eyes and all of them were in the IMU group. This means that SRF evolved in 13% of all uveitis cases, in contrast to the higher percentages reported earlier [8,9]. This result seems to be contrasting with the observations that SRF appears in the initial phase of the inflammatory process, but we have to emphasize that not all patients had macular edema in our cohort [10].
Choroidal thickness
Investigating the choroidal thickness in macular edema Regatieri et al described decreased choroidal thickness in patients with diabetic macular edema [11]. In contrast with this result, Xu et al concluded that diabetic macular edema did not influence the choroidal thickness, simi- larly to our study on uveitic macular edema [12].
Despite the choroidal involvement in uveitis, there are only few publications investigating choroidal thickness in any type of uveitis. Posterior uveitis accompanied mostly by thickening of choroidal layers, especially in acute phase [13-17].
Assumably in posterior uveitis, where the choroid is affected in inflammatory processes, choroidal thickness is influenced by many–sometimes adverse–effects. In- flammatory infiltration could potentially result in in- creased thickness, whereas the diminished choroidal circulation may result in reduced choroidal thickness.
This hypothesis is supported also by observations of Karampelas et al. They concluded that in 21 inactive panuveitic eyes the mean choroidal thickness was lower and hyporeflectivity in Haller’s large vessel layer was re- duced. They attributed these results to choroidal ische- mia and hypoperfusion [18].
It seems, that the choroidal changes of macular region in AU and IMU are less comparable to the results of measuremets of posterior uveitis, where the infiltration of the choroid is likely.
We have come to the conclusion in our control group that the mean subfoveal choroidal thickness was in the
higher normal range, which may reflect the lower mean age of the participants than it is in other studies.
To our best knowledge this is the first study investigat- ing choroidal thickness in AU and IMU. We found the choroidal thickness to be markedly thinner only in IMU in the nasal 6 mm quadrant, none of the other quad- rants were significantly lower in uveitis groups than the thickness observed in normal subjects. Interestingly this is the thinnest region of the macula in normal subjects and it is also the only quadrant where the choroid con- siderably attenuated. It may be either a coincident or it could reflect to the vulnerable choroidal circulation of the papillomacular region.
We have demonstrated significant retinal thickening in AU and IMU, but only limited involvement of the chor- oid could be demonstrated. Our study did not provide sufficient evidence about the casual relationship between the microstructural changes of the macula and the chor- oidal structure. Our results can be interpreted in several ways. One option is that the lack of correlation can be attributed to the early phase of the inflammatory process; the other explanation is that the effect of uveitic macular edema on choroidal circulation is questionable, similar to the effect of diabetic macular edema.
The limitations of this study are the small number of the patients and the lack of follow up measurements in the chronic inflammation phase. Further limitation is the lack of available inbuilt software for the automated measurement of choroidal thickness. Normative data- base is not uniform, the reported normal subfoveal chor- oidal thickness varied from 225 μm to 311μm [19-21], Ikuno et al have however found good interobserver re- producibility of choroidal thickness measurement [22].
Detection of the choroid-sclera border could be im- proved by the recently introduced swept-source optical coherence tomography, which compared with SD-OCT has greater sensitivity at scanning deep choroidal struc- tures and the superficial retinal layers in the same image, and with longer wavelength enabling better imaging of deeper structures [23].
Conclusion
In conclusion we can say that the retinal thickness in- creases in AU and IMU already in the early disease process, but choroidal thickness seems to be unaffected and not to be related to retinal thickness. In the evalu- ation of the macular structure in AU patients it is espe- cially recommended to analyze the OCT results of the perifoveal region, since it provides early detection of macular edema, even in case of normal CSFT. In IMU cases either the center or the perifoveal macular regions are affected by macular edema.
Our OCT findings demonstrated that in contrast with posterior uveitis, anterior and interediate uveitis promotes
fluid accumulation mainly in the retina and not in the choroid. Further development of OCT imaging technol- ogy and multimodal imaging could provide more detailed insight in the pathomechanism of macular strutural changes in different types of uveitis.
Competing interests
The authors declare that they have no competing interests.
Authors’contributions
ZG recruited the patients, wrote the manuscript, participated in study design.
KK carried out the measurements. HK helped in formatting, language, reviewed the literature. JN participated in study design. OM participated in measurements. MR performed the statistical analysis and helped to draft the manuscript. All authors read and approved the final manuscript.
Acknowledgements
Authors are thankful to László Örkényi for his participation in statistical analysis and data interpretation. Authors are grateful to László Czakó for critical reading and language check of the manuscript.
Received: 13 February 2014 Accepted: 12 August 2014 Published: 30 August 2014
References
1. Pivetti-Pezzi P, Accorinti M, La Cava M, Colabelli Gisoldi RA, Abdulaziz MA:
Endogenous uveitis: an analysis of 1,417 cases.Ophthalmologica1996, 210:234–238.
2. Rothova A, Suttorp-van Schulten MSA, Treffers WF, Kijlstra A:Causes and frequency of blindness in patients with intraocular inflammatory disease.
Br J Ophthalmol1996,80:332–336.
3. Jabs DA, Nussenblatt RB, Rosenbaum JT, Standardization of Uveitis Nomenclature (SUN) Working Group:Standardization of uveitis nomenclature for reporting clinical data. results of the First International Workshop.Am J Ophthalmol2005,140:509–516.
4. Traill A, Stawell R, Hall A, Zamir E:Macular thickening in acute anterior uveitis.Ophthalmology2007,114:402.
5. Shulman S, Goldenberg D, Habot-Wilner Z, Goldstein M, Neudorfer M:
Optical coherence tomography characteristics of eyes with acute anterior uveitis.Isr Med Assoc J2012,14:543–546.
6. Haller JA, Bandello F, Belfort R Jr, Blumenkranz MS, Gillies M, Heier J, Loewenstein A, Yoon YH, Jiao J, Li XY, Whitcup SM, Ozurdex GENEVA Study Group:Dexamethasone intravitreal implant in patients with macular edema related to branch or central retinal vein occlusion twelve-month study results.Ophthalmology2011,118:2453–2460.
7. Spaide RF, Koizumi H, Pozonni M:Enhanced depth imaging spectral- domain optical coherence tomography.Am J Ophthalmol2008, 146:496–500.
8. Iannetti L, Spinucci G, Abbouda A, De Geronimo D, Tortorella P, Accorinti M:
Spectral-domain optical coherence tomography in uveitic macular edema: morphological features and prognostic factors.Ophthalmologica 2012,228(1):13–18.
9. Castellano CG, Stinnett SS, Mettu PS, McCallum RM, Jaffe GJ:Retinal thickening in iridocyclitis.Am J Ophthalmol2009,148(3):341–349.
10. Ossewaarde-van Norel J, Berg EM, Sijssens KM, Rothova A:Subfoveal serous retinal detachment in patients with uveitic macular edema.Arch Ophthalmol2011,129(2):158–162.
11. Regatieri CV, Ranchini L, Carmody J, Fujimoto JG, Duker JS:Choroidal thickness in patients with diabetic retinopathy analyzed by spectral- domain optical coherence tomography.Retina2012,32:563–568.
12. Xu J, Xu L, Du KF, Shao L, Chen CX, Zhou JQ, Wang YX, You QS, Jonas JB, Wei WB:Subfoveal choroidal thickness in diabetes and diabetic retinopathy.Ophthalmology2013,120(10):2023–2028.
13. Fong AHC, Li KKW, Wong D:Choroidal evaluation using enhanced depth imaging spectraldomain optical coherence tomography in Vogt- Koyanagi-Harada disease.Retina2011,31:502–509.
14. Nakayama M, Keino H, Okada AA, Watanabe T, Taki W, Inoue M, Hirakata A:
Enhanced depth imaging optical coherence tomography of the choroid in Vogt-Koyanagi-Harada disease.Retina2012,32(10):2061–2069.
15. Maruko I, Iida T, Sugano Y, Oyamada H, Sekiryu T, Fujiwara T, Spaide RF:
Subfovealchoroidal thickness after treatment of Vogt-Koyanagi-Harada disease.Retina2011,31(3):510–517.
16. Aoyagi R, Hayashi T, Masai A, Mitooka K, Gekka T, Kozaki K, Tsuneoka H:
Subfoveal choroidal thickness in multiple evanescent white dot syndrome.Clin Exp Optom2012,95:212–217.
17. Kim M, Kim H, Kwon HJ, Kim SS, Koh HJ, Lee SC:Choroidal thickness in Behcet's uveitis: an enhanced depth imaging-optical coherence tomography and its association with angiographic changes.Invest Ophthalmol Vis Sci2013,54:6033–6039.
18. Karampelas M, Sim DA, Keane PA, Zarranz-Ventura J, Patel PJ, Tufail A, Westcott M, Lee R, Pavesio CE:Choroidal assessment in idiopathic panuveitis using optical coherence tomography.Graefes Arch Clin Exp Ophthalmol2013,251(8):2029–2036.
19. Margolis R, Spaide RF:A pilot study of enhanced depth imaging optical coherence tomography of the choroid in normal eyes.Am J Ophthalmol 2009,147:811–815.
20. Ikuno Y, Kawaguchi K, Nouchi T, Yasuno Y:Choroidal thickness in healthy Japanese subjects.Invest Ophthalmol Vis Sci2010,51:2173–2176.
21. Shin JW, Shin YU, Lee BR:Choroidal thickness and volume mapping by a six radial scan protocol on spectral-domain optical coherence tomography.Ophthalmology2012,119:1017–1023.
22. Ikuno Y, Maruko I, Yasuno Y, Miura M, Sekiryu T, Nishida K, Iida T:
Reproducibility of retinal and choroidal thickness measurements in enhanced depth imaging and high-penetration optical coherence tomography.Invest Ophthalmol Vis Sci2011,52:5536–5540.
23. Copete S, Flores-Moreno I, Montero JA, Duker JS, Ruiz-Moreno JM:Direct comparison of spectral-domain and swept-source OCT in the measurement of choroidal thickness in normal eyes.Br J Ophthalmol 2014,98:334–338.
doi:10.1186/1471-2415-14-103
Cite this article as:Géhlet al.:Retinal and choroidal thickness measurements using spectral domain optical coherence tomography in anterior and intermediate uveitis.BMC Ophthalmology201414:103.
Submit your next manuscript to BioMed Central and take full advantage of:
• Convenient online submission
• Thorough peer review
• No space constraints or color figure charges
• Immediate publication on acceptance
• Inclusion in PubMed, CAS, Scopus and Google Scholar
• Research which is freely available for redistribution
Submit your manuscript at www.biomedcentral.com/submit