Article
Systematic Kinase Inhibitor Profiling Identifies CDK9 as a Synthetic Lethal Target in NUT Midline
Carcinoma
Graphical Abstract
Highlights
d
Screening 1,505 compounds against 78 cancer cell lines reveals distinct vulnerabilities
d
NUT midline carcinoma cells are specifically sensitive to CDK9 inhibition (CDK9i)
d
CDK9i perturbs MYC signaling, represses MCL1, and induces apoptosis in NMC cells
d
CDK9 may represent a promising therapeutic target in NUT midline carcinoma
Authors
Johannes Bra¨gelmann,
Marcel A. Dammert, Felix Dietlein, ..., Bert M. Klebl, Roman K. Thomas, Martin L. Sos
Correspondence
roman.thomas@uni-koeln.de (R.K.T.), martin.sos@uni-koeln.de (M.L.S.)
In Brief
By screening 1,505 compounds against 78 cancer cell lines, Bra¨gelmann et al.
identify a specific sensitivity of
BRD4- NUT-rearranged NUT midline carcinoma (NMC) cells to CDK9 inhibition. CDK9 inhibition affects transcriptional
elongation, de-regulates MYC signaling, and induces apoptosis by suppressing anti-apoptotic MCL1. CDK9 may thus be a promising target in NMC.
Bra¨gelmann et al., 2017, Cell Reports20, 2833–2845 September 19, 2017ª2017 The Authors.
http://dx.doi.org/10.1016/j.celrep.2017.08.082
Cell Reports
Article
Systematic Kinase Inhibitor Profiling Identifies CDK9 as a Synthetic Lethal Target
in NUT Midline Carcinoma
Johannes Bra¨gelmann,1,2,13Marcel A. Dammert,1,2,13Felix Dietlein,3,13Johannes M. Heuckmann,4,13Axel Choidas,5,13 Stefanie Bo¨hm,1,2Andre´ Richters,6Debjit Basu,6Verena Tischler,2Carina Lorenz,1,2Peter Habenberger,5Zhizhou Fang,6 Sandra Ortiz-Cuaran,2Frauke Leenders,2Jan Eickhoff,5Uwe Koch,5Mattha¨us Getlik,6Martin Termathe,6
Muhammad Sallouh,6Zolta´n Greff,7Zolta´n Varga,7Hyatt Balke-Want,2,3Christopher A. French,8Martin Peifer,2 H. Christian Reinhardt,3,12La´szlo´ O¨ rfi,7,9Gyo¨rgy Ke´ri,7Sascha Anse´n,3Lukas C. Heukamp,2,10Reinhard B€uttner,10 Daniel Rauh,6Bert M. Klebl,5Roman K. Thomas,2,10,11,*and Martin L. Sos1,2,12,14,*
1Molecular Pathology, Institute of Pathology, University of Cologne, Kerpener Str. 62, 50937 Cologne, Germany
2Department of Translational Genomics, Medical Faculty, University of Cologne, Weyertal 115b, 50931 Cologne, Germany
3Department I of Internal Medicine and Center for Integrated Oncology, University Hospital of Cologne, Kerpener Str. 62, 50937 Cologne, Germany
4NEO New Oncology GmbH, Gottfried-Hagen-Str. 20, 51105 Cologne, Germany
5Lead Discovery Center (LDC) GmbH, Otto-Hahn-Str. 15, 44227 Dortmund, Germany
6Faculty of Chemistry and Chemical Biology, TU Dortmund University, Otto-Hahn-Str. 4a, 44221 Dortmund, Germany
7Vichem Chemie Research Ltd., Herman Otto´ u. 15, Budapest, Hungary
8Department of Pathology, Brigham and Women’s Hospital, Harvard Medical School, Boston, MA 02115, USA
9Department of Pharmaceutical Chemistry, Semmelweis University, H}ogyes E. U.9, Budapest, Hungary
10Institute of Pathology, Medical Faculty, University of Cologne, Kerpener Str. 62, 50937 Cologne, Germany
11German Cancer Research Center (DKFZ), German Cancer Consortium (DKTK), Heidelberg, Germany
12Center for Molecular Medicine Cologne, University of Cologne, 50931 Cologne, Germany
13These authors contributed equally
14Lead Contact
*Correspondence:roman.thomas@uni-koeln.de(R.K.T.),martin.sos@uni-koeln.de(M.L.S.) http://dx.doi.org/10.1016/j.celrep.2017.08.082
SUMMARY
Kinase inhibitors represent the backbone of targeted cancer therapy, yet only a limited number of onco- genic drivers are directly druggable. By interrogating the activity of 1,505 kinase inhibitors, we found that
BRD4-NUT-rearranged NUT midline carcinoma (NMC) cells are specifically killed by CDK9 inhibition (CDK9i) and depend on CDK9 and Cyclin-T1 expres- sion. We show that CDK9i leads to robust induction of apoptosis and of markers of DNA damage response in NMC cells. While both CDK9i and bro- modomain inhibition over time result in reduced Myc protein expression, only bromodomain inhibi- tion induces cell differentiation and a p21-induced cell-cycle arrest in these cells. Finally, RNA-seq and ChIP-based analyses reveal a
BRD4-NUT-specific CDK9i-induced perturbation of transcriptional elon- gation. Thus, our data provide a mechanistic basis for the genotype-dependent vulnerability of NMC cells to CDK9i that may be of relevance for the devel- opment of targeted therapies for NMC patients.
INTRODUCTION
Systematic genomic profiling of tumors, combined with the development of targeted therapeutics, paved the way for a num-
ber of breakthroughs in the treatment of cancer patients (Buett- ner et al., 2013; Clinical Lung Cancer Genome Project (CLCGP) Network Genomic Medicine (NGM), 2013; Hyman et al., 2015;
Kandoth et al., 2013). In genetically defined subgroups such as EGFR-mutant lung cancer the therapeutic exploitation of these alterations has already led to dramatic improvements in the clin- ical care of cancer patients (Flaherty et al., 2012; Rosell et al., 2012; Shaw et al., 2013; Van Cutsem et al., 2011). However, most oncogenic driver lesions are still considered to be undruggable.
Massively parallel interrogation of drug vulnerability across large panels of cancer cell lines has proved to be a valid tool for the identification and validation of genetically defined targets (Barretina et al., 2012; Garnett et al., 2012; Iorio et al., 2016; Mar- tins et al., 2015; Seashore-Ludlow et al., 2015; Sos et al., 2009a, 2009b). Such screens can identify compounds that directly target driver alterations and offer the opportunity to discover additional vulnerabilities in non-mutated genes that only become essential in tumor-specific genetic backgrounds (Chan et al., 2011; Fece de la Cruz et al., 2015). Exploitation of such syn- thetic lethality has already provided alternative therapeutic ap- proaches to selectively kill cancer cells while sparing normal tis- sue (McLornan et al., 2014). The cyclin-dependent kinases (CDKs) 1, 2, and 6 have been shown to gain relevance in several MYC-driven tumors and were thus proposed as context-specific synthetic lethal targets (Fece de la Cruz et al., 2015). Moreover, CDK9, which, together with Cyclin-T1, forms the positive tran- scription elongation factor b (P-TEFb) complex and induces tran- scriptional activation by hyperphosphorylating RNA polymerase
(legend on next page)
II (Pol II) (Lu et al., 2015; Morales and Giordano, 2016), was put forth as a potential therapeutic target in hepatocellular carci- noma (Huang et al., 2014), ovarian cancer (Lam et al., 2014), and hematological malignancies (Gregory et al., 2015; Walsby et al., 2014). As a consequence, several CDK inhibitors have entered clinical trials, but so far, a lack of specificity and resulting toxicity limits the clinical relevance of CDK inhibitors in cancer (Chen et al., 2014; Kumar et al., 2015; Morales and Giordano, 2016).
Here we evaluated the cellular activity of a library of 1,505 ki- nase inhibitors to systematically uncover genotype-specific vul- nerabilities. Our data reveal that CDK9 inhibition specifically modulates transcriptional elongation and effectively impairs viability through induction of apoptosis and DNA damage response of NUT midline carcinoma (NMC) cells.
RESULTS
High-Throughput Cell Line Screening
In total, 1,505 chemical compounds with a spectrum of common kinase inhibitor motifs were screened against 78 cancer cell lines (Figures 1A–1C) (Barretina et al., 2012; Garnett et al., 2012;
Sos et al., 2009b). Overall, 7.5% of all compound-cell line combinations were classified as candidate hits (Zscore <2, corresponding to a residual viability of <25.9% at 10mM) (Fig- ure S1A). The high number of compounds that elicited only low or no cytotoxic effects across the cell lines is likely attributed to most compounds not having undergone previous target- based chemical or lead optimization (Figure 1A;Figure S1A).
Based on the number of hits across cell lines (nhits), compounds showed a range of activity patterns ranging from lack of activity (65.2% of all compounds, termed inactive; nhits< 2) to broad and unselective toxicity (9.0%, termed toxic; nhits> 30% of cell lines) (Figure 1A).
To assess the impact of chemical complexity on compound activity, we calculated extended connectivity fingerprints (ECFP6) (Riniker and Landrum, 2013), whose lengths correspond to the number of distinct chemical features present in a given molecule. Neither biological selectivity nor compound potency depended on chemical complexity, as determined by the ECFP6-fingerprint length (Figure 1B). Inactive, selective, and toxic compounds were distributed at similar frequencies along the fingerprint lengths (Figure 1B, upper panel). However, ana- lyses of compounds grouped by basic chemical scaffold (Hu
and Bajorath, 2013) indicated that the number of active com- pounds varied by core structures (Figure 1C). Specifically, com- pounds with selective patterns of activity were typically based on common scaffolds of established kinase inhibitors (e.g., amino-pyrimidines, imidazoles, indoles, pyrazoles, pyridines, quinazolines, and thiazoles) (Figure 1C, boxplot). By contrast, compounds based on a pyrazolopyrimidinone scaffold or those with a highly complex core structure (mainly staurosporine and derivatives thereof) were enriched in the group of primarily toxic activity (Figure 1C). Thus, within our dataset core, scaffolds are a major determinant of compound selectivity.
To discover genotype-specific effects of the selective com- pounds, cell lines were grouped according to the presence or absence of a given genomic alteration, and differences in the viability in those cell lines bearing such alteration and in those lacking it were tested by an ANOVA approach (Barretina et al., 2012; Garnett et al., 2012; Iorio et al., 2016; Sos et al., 2009b).
Of all 6,664 possible compound-genotype combinations, 345 (hit rate = 5.2%) showed a significantly decreased viability in altered versus wild-type cell lines (false discovery rate [FDR]% 0.1) with a significant enrichment of EGFR inhibitors scoring in EGFR-mutant cell lines (Figure 1D).
We hypothesized that based on the structural diversity of in- hibitors with differential activity against EGFR, we might also be able to predict compound activity by chemical structure alone. To this end, we applied elastic net modeling for regression and classification of activity based on ECFP6 fingerprints using a training subset (90% of compounds), coupled with 10-fold cross-validation and subsequent testing on the remaining 10%
of the compounds (Figure 1E) (Zou and Hastie, 2005). We first predicted median residual viability of EGFR-mutant cells as a continuous measure based on the fingerprints of com- pounds containing thiazoles (n = 398) or quinazolines (n = 172).
Overall, a high degree of correlation between predicted and observed median viability was achieved for thiazoles (median Pearson r = 0.74; p = 2.831033) (Figure 1F;Figure S1B) and quinazoline-based compounds (median Pearson r = 0.76; p = 2.231047) (Figures S1C and S1D). Similarly, when performing binary predictions of compounds as having either high or low anti-EGFR activity in the complete compound set, irrespective of underlying scaffolds, compounds predicted to have high anti-EGFR activity exhibited significantly lower residual viabilities (p = 1.03108; area under the curve [AUC] 0.88) (Figure 1G). In an independent validation with data of the GlaxoSmithKline
Figure 1. High-Throughput Cell Line Screening
(A) Unsupervised hierarchical clustering of cell lines (columns, n = 78) and compounds (rows, n = 1505) based on residual viability (heatmap). Color bar (rows) represents classification of compounds based on the number of hits across cell lines. Bottom: annotation of known driver alterations and their frequency in the cell line panel.
(B) Top: density plot of inactive, selective, and toxic compounds along the ECFP6-fingerprint length (color code as in A). Bottom: association of compound activity defined by the number of hits across cell lines, with chemical complexity assessed by the compounds’ fingerprint lengths.
(C) Bar graph: distribution of the most frequent scaffolds in the compound library. Boxplot: number of hits of active compounds grouped by chemical scaffold.
(D) Volcano plot with viability reduction (x axis) and significance (y axis) of selective compounds (n = 392) in genotypes annotated in (A) (n = 17). (FDR, false discovery rate in the ANOVA model; *H1975 was not included asEGFRmutdue to its T790M resistance mutation.)
(E) Schematic of the model building for elastic net models predicting percentage of viability or classifying compounds as active or inactive.
(F) Correlation coefficients of predicted versus observed or randomly permutated residual viability inEGFRmutcell lines based on 100 elastic net models for thiazoles (two-sided Mann-Whitney test).
(G) Classification of validation set compounds independent of underlying scaffold. Discriminatory capacity is indicated by the receiver operator analysis (ROC, inset; p value, Mann-Whitney test between compounds predicted to have high versus low activity againstEGFRmutcell lines; CI, 95% confidence interval).
Protein Kinase Inhibitor Set (GSK PKIS) compounds, the elastic net model also reliably predicted high versus low activity against L858R-mutated EGFR (p = 1.931019; AUC 0.85; sensitivity 77.2%; specificity 81.9%) (Figure S1E).
Thus, our inhibitor screening data capture major genomic de- pendencies and our elastic net-based algorithm for the system- atic deconvolution of genotype-chemotype relationships may be useful for the analysis of similar large-scale screening datasets.
NMC Cells Are Sensitive to CDK9 Inhibition
The second most abundant genotype-chemotype interaction present in our dataset was identified for a BRD4-NUT-rear- ranged cell line (HCC2429) (Figure 1D) (Yan et al., 2011), which was among the cell lines with the highest degree of sensitivity toward several compounds (Figure S1F). BRD4-NUT fusions are a hallmark of NMC, a rare but highly aggressive tumor type associated with poor response to standard chemotherapy (French et al., 2003; Stathis et al., 2016). Among selective com- pounds with strong activity against HCC2429 cells, we identified LDC67, a known CDK9 inhibitor, as the most genotype-selective inhibitor (Figure 2A) (Albert et al., 2014). The 10 most active com- pounds shared structural features with LDC67 and known CDK inhibitors (Figure S2A) (Albert et al., 2014; Morales and Giordano, 2016; Rossi et al., 2005), suggesting that these chemotypes may be suited as a backbone for CDK inhibitors. To further validate our findings, we determined half-maximal growth inhibitory (GI50) values of LDC67 across 64 cell lines, including three NMC cell lines (HCC2429, 143100, and 690100), and found significantly (p = 13104) higher activity in allBRD4-NUT-rear- ranged cells compared to tumor cells lacking the rearrangement (Figure 2B;Figure S2B). We also observed a similar activity pro- file in the cases of the CDK inhibitor AT7519 (p = 53 104) (Squires et al., 2009) and the bromodomain inhibitor JQ1 (p = 1.43107), which was previously shown to be active in NMC cells (Figures S2C and S2D) (Filippakopoulos et al., 2010). In line with these observations, CDK9 inhibition led to significantly reduced cell growth ofBRD4-NUT-rearranged cells in clono- genic assays (p = 93 107) (Figure 2C) and an induction of apoptosis at 24 hr (p = 0.001) and 48 hr (p = 0.005). Similarly, LDC67 treatment led to a significant increase in the sub-G1 fraction (control, 8.0%; LDC67, 57%; p = 0.047) inBRD4-NUT- rearranged cells, but not in control cells (Figure S2E). We subse- quently sought to determine potential mechanistic links between CDK9i and apoptosis induction. Because CDK9i has been described as conferring an apoptosis-primed state by repres- sing anti-apoptotic Mcl-1 (Gregory et al., 2015; Huang et al., 2014; Lemke et al., 2014), we analyzed Mcl-1 expression levels under LDC67 treatment as a function of time. Mcl-1 protein expression was almost abrogated in HCC2429 cells, but not in A549 (KRASmut) cells (Figure 2E). In addition to interfering with global transcription and altering the balance of pro- and anti- apoptotic proteins, CDK9 was shown to be involved in the DNA damage response (Yu et al., 2010; Zhang et al., 2013).
We therefore investigated the levels of gH2AX and phospho- Chk2, surrogate markers of DNA damage (Yu et al., 2010), under LDC67 treatment. We observed strong upregulation ofgH2AX and phospho-Chk2 in HCC2429, while such induction was considerably lower in A549 cells (Figure 2E). In addition, we
were able to confirm a significant increase of gH2AX-positive HCC2429 cells (24 hr) by fluorescence-activated cell sorting (FACS) analysis after co-staining forgH2AX and cleaved cas- pase-3 (Figure 2F).
Overall, our data suggest thatBRD4-NUT-rearranged NMC cells may be particularly vulnerable to CDK9 inhibition.
BRD4-NUT-Driven Cells Display a Distinctive CDK9 Dependency
To test a specific dependency of NMC cells on CDK9 expression that may explain the observed phenotype in CDK9i-treated cells, we performed short hairpin RNA (shRNA)-mediated knockdown of both components of P-TEFb, CDK9, and Cyclin-T1 (Figures 3A and 3B). Similar to CDK9 inhibition, we observed a significant (p = 2 3 104) reduction in cellular viability of NMC cells (HCC2429), but not of control cells (A549) (Figures 3A and 3B).
We next tested the effects of LDC67 in NMC and control cells (A549 and HCC15) on phosphorylation of Pol II and observed a dose-dependent decrease of Ser2 phosphorylation, irrespective of the underlying genotype (Figure 3C). Previously, cellular efficacy of CDK9 inhibitors has been linked with changes in the complex formation of P-TEFb with its negative regulator HEXIM1 (Huang et al., 2014; Itzen et al., 2014; Lu et al., 2015; Morales and Gior- dano, 2016). To monitor such drug-induced effects, we performed immunoprecipitation assays of endogenous CDK9 in HCC2429 and A549 cells treated with LDC67. We observed a modest but reproducible reduction of HEXIM1-bound CDK9 in both cell lines (Figure 3D), with a more profound disruption of HEXIM1/CDK9 complexes in HCC2429 cells (72.6%) when compared to A549 cells (85.6%) after 4 hr LDC67 treatment (Figure 3D). We were able to validate this CDK9 inhibitor-induced effect when overex- pressing FLAG-CDK9 in HCC2429 cells with a HEXIM1/FLAG- CDK9 ratio of 14.6% after LDC67 (4 hr) treatment (Figure S3A).
These data further highlight the relevance of CDK9 expression in NMC and suggest that the effects achieved by LDC67 may be attributable to direct inhibition of CDK9.
CDK9-Specific Effects in NMC Cells
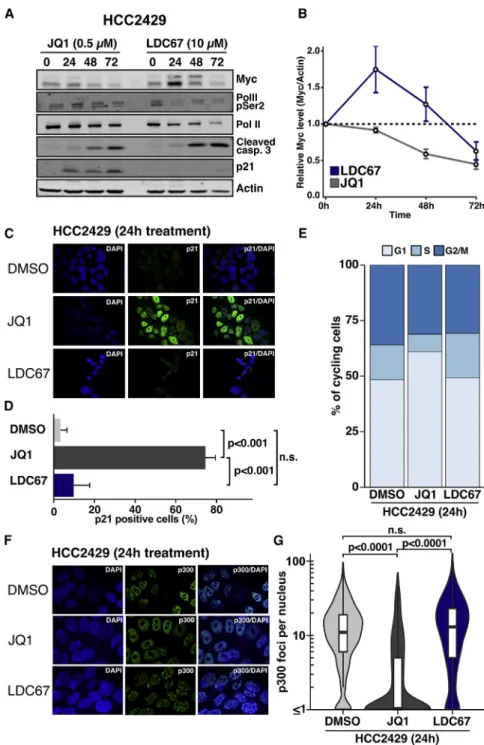
Previous reports have implicatedMYCexpression as a relevant downstream effector ofBRD4-NUT-driven cells in the context of BRD4 inhibitor treatment (Grayson et al., 2014; Sos et al., 2009b). To test the relevance of MYC expression in BRD4- NUT-rearranged cells, we performed shRNA-mediated MYC knockdown and observed a significant (p = 8.13105) reduction of viability in HCC2429 cells that did not strongly differ (p = 0.1) from that of A549 control cells (Figure S3B). When monitoring Myc protein levels during drug treatment, bromodomain inhibi- tion with JQ1 led to a constant decrease of Myc protein expres- sion as expected (Figures 4A and 4B;Figure S3C). To our sur- prise, we observed an initial moderate increase of Myc protein levels and a subsequent reduction after 48 to 72 hr of LDC67 treatment in HCC2429BRD4-NUT-rearranged cells, but not in A549 control cells (Figures 4A and 4B;Figure S3C) (Lu et al., 2015). We observed a similar reduction of Myc protein levels, together with an increase ingH2AX and depletion of Mcl-1 in the 143100 NMC cells but without the initial Myc increase, sug- gesting that the effect on Myc expression may be cell line spe- cific (Figure S3D). The overlapping effects on Myc expression
Figure 2. CDK9 Inhibition Exhibits Distinct Effects onBRD4-NUT-Rearranged NMC Cells
(A) Activity of selective compounds againstBRD4-NUT-rearranged HCC2429 cells. To obtain the most genotype-selective inhibitor, the percentage of cell lines that were not impacted below the hit threshold was calculated for the ten most potent compounds (inset).
(B) GI50values from LDC67 dose-response curves (72 hr) across 64 cell lines.
(C) Clonogenic survival assays of HCC2429 and A549 of LDC67 treatment or DMSO control (mean±SD; n = 3).
(D) Apoptosis measured by Annexin V flow cytometry inBRD4-NUT-rearranged and control cells following treatment with 10mM LDC67 (mean±SD; n = 3).
(E) Immunoblot of HCC2429 and A549 cells treated with LDC67 for the indicated periods.
(F) HCC2429 cells treated for 24 hr with 10mM LDC67, 0.5mM JQ1, or DMSO were co-stained for cleaved caspase-3 (CC3) andgH2AX and measured by flow cytometry (mean±SEM; n = 3; p values calculated by two-tailed t tests).
induced by JQ1 and LDC67 may partly explain the additive effects observed for the combination of both compounds and partial cross-resistance of JQ1-persistent HCC2429 clones (GI50= 11.62mM JQ1P versus GI50= 72 nM parental) (Figures S3E–S3H).
We also observed that treatment with both inhibitors led to in- duction of cleaved caspase-3 within 24–48 hr (Figure 4A). Using a more quantitative approach, we noticed a significantly higher fraction of apoptotic cells under LDC67 compared to JQ1 treat- ment in flow cytometric analyses (LDC67 61% versus JQ1 31%;
p = 0.02) (Figure S3I). By contrast, only bromodomain inhibition, not CDK9 inhibition, led to a dramatic induction of the p53 target gene p21 and a block of S phase entry (Figures 4A–4E;Fig- ure S3J). In parallel, in JQ1-treated, but not LDC67-treated, HCC2429 cells, we observed disassembly of hyperacetylated/
p300-positive foci that may lead to restoration of p53 activity, as described in previous reports (Figures 4F and 4G) (Huang et al., 2014; Reynoird et al., 2010).
Thus, our data indicate that in contrast to bromodomain inhi- bition, CDK9 inhibition does not lead to a cell-cycle arrest and
that over time, both perturbations induce a similar reduction of Myc expression.
CDK9 Inhibition Perturbs Defined Transcriptional Programs in NMC Cells
To further investigate the signaling patterns induced by CDK9 inhibition, we performed transcriptome profiling (RNA seq- uencing [RNA-seq]) in NMC cells. RNA-seq indicated that LDC67 treatment induces an initial increase (8 hr), followed by downregulation (48 hr) of transcripts involved in RNA binding and translation, of ribosomal subunits in gene set enrichment analyses (GSEAs) and included known surrogate markers of P-TEFb complex activity, such as FOS (Figures 5A–5C;Figure S4A;Tables S1andS2) (Lu et al., 2015; Stathis et al., 2016; Yan et al., 2011). We were also able to confirm that LDC67 and JQ1 treatment was associated with a pertur- bation of cellular processes linked with Myc activity (Figure 5C;
Tables S3andS4). The changes induced by LDC67 were most prevalent in genes regulated by promoters with high affinity for Myc (Figure S4B) (Lorenzin et al., 2016; P.J. O’Dwyer et al., Figure 3. Effects of CDK9 or Cyclin-T1 Perturbation in NMC Cells
(A and B) shRNA-based gene knockdown of CDK9 or Cyclin-T1 was performed in HCC2429 and A549 cells and effects on viability (A) and protein levels (B) were assessed compared to controls (mean±SEM; n = 3).
(C) LDC67 on-target activity assessed by reduction of RNA polymerase II (Pol II) phosphorylation at Ser2 after 24 hr.
(D) Immunoprecipitations (IPs) of endogenous CDK9 show reduced HEXIM1/CDK9 complex abundance after 4 hr LDC67 treatment (n = 3; two-tailed t test). IgG was used as unspecific negative IP control.
2016, Cancer Res., abstract). As expected, the timing of the transcriptional changes and the individual gene sets in HCC2429 cells treated with the bromodomain inhibitor JQ1 strongly differed from those treated with the CDK9 inhibitor LDC67 (Figure 5C; Figures S4A–S4D). We also observed a robust enrichment of genes involved in cytoskeletal regulation in JQ1-treated cells and a reduction of cell-cycle gene sets (Figure 5C;Figure S4A;Tables S1andS2), which may corre- spond to the morphological changes induced by JQ1 (Fig- ure S4E) (Alekseyenko et al., 2015; Filippakopoulos et al., 2010; Grayson et al., 2014; Stathis et al., 2016).
Figure 4. Differential Effects of CDK9 and BRD4 Inhibition on NMC Cells
(A and B) Effects of JQ1 and LDC67 treatment on protein levels in HCC2429 were assessed by immunoblotting (A) and Myc protein levels over time were quantified and normalized to actin (B) (mean±SEM; n = 5).
(C and D) Immunofluorescence of p21 protein expression in HCC2429 cells after 24 hr LDC67 (10mM) or JQ1 (500 nM) treatment (C). For quan- tification (D), in total, >100 cells were assessed per condition (bars represent the percentage of p21- positive cells±95% CI; p values were calculated by chi-square tests).
(E) Cell-cycle distribution of cycling cells assessed by flow cytometry of propidium iodine-stained HCC2429 cells after 24 hr treatment with 10mM LDC67 or 500 nM JQ1.
(F and G) Representative immunofluorescence (IF) images of HCC2429 cells stained for p300 foci after 24 hr DMSO, JQ1 (500 nM), or LDC67 (10mM) (F). Number of foci per nucleus was quantified in n = 3 experiments (G), with >250 cells per condition (two-tailed Wilcoxon tests).
To validate our RNA-seq results and to assess the impact of CDK9i on de novo transcription, we performed qRT-PCR of mature mRNA and of unspliced pre- mRNA for a set of upregulated genes (FOS,JUNB, andMYC) and downregu- lated genes (FOXO6 and KLHL23) after LDC67 treatment. We chose 18S rRNA for qPCR normalization that remained stable under inhibitor treatment while RNA-seq normalizes expression relative to the complete transcriptome. Overall, the RNA-seq results validated well for mature and pre-mRNA (Figures 5B and 5E). Increased pre-mRNA levels ofFOS andJUNBsuggest that these genes are actively transcribed despite CDK9i. How- ever, the strong decrease ofFOXO6and KLHL23 pre-mRNA indicates CDK9i- mediated elongation defects and abroga- tion of de novo transcription.MYCmRNA did not increase but instead stayed constant at 8 hr of LDC67 treatment, followed by a delayed reduction at 48 hr (Figure 5B). The apparent difference to the RNA-seq results is most likely due to the aforementioned differences in normalization. Furthermore, MYC pre-mRNA levels were decreased after 8 and 48 hr of LDC67 treatment (Figure 5B). As expected, bromodomain inhibi- tion with JQ1 led to a constant decrease of MYCpre-mRNA, mature mRNA, and protein expression (Figure 4A;Figures 5D and 5E). Depletion of CDK9 or Cyclin-T1 in these cells led to a similar reduction of premature and matureMYCmRNA corre- sponding to the respective knockdown efficacies (Figure 5F;
Figure S4F).
Thus, CDK9 inhibition may lead to defined genotype-specific transcriptional changes but may also interfere withMYCmRNA stability and increase MYC translation rather than de novo transcription.
CDK9 Inhibition Has a Major Effect on Transcriptional Elongation in NMC Cells
We next sought to directly evaluate the effect of CDK9 inhibi- tion on the process of transcriptional elongation. To this end, we performed chromatin immunoprecipitation (ChIP) ex- periments after short-term CDK9 inhibition and measured Pol II occupancy for genes in which expression was increased (MYC,FOS,JUNB, andSF3B4) or did not increase (FOXO6, KLHL23,BRG1, andNPM1) relative to the global transcriptome
in RNA-seq analyses after short-term CDK9 inhibition (Figures 6A–6C;Figure S5). When assessing Pol II distribution with an antibody raised against the unphosphorylated C-terminal domain (CTD), Pol II occupancy in the gene body (GB) remained constant or was even increased in upregulated genes, while the GB signal was decreased in the other genes (Figures 6A–6C;
Figure S5). The signal at the transcription start site (TSS) was more variable.
Overall, this translated into decreased pausing indices (PIs, or the ratio of TSS-bound Pol II to GB-bound Pol II) for the upregu- lated genes and constant or increased PI for the other genes (Figure 6D). These findings are compatible with higher transcrip- tion rates in the upregulated genes and correspond to signifi- cantly lower RNA expression of the genes with increased Figure 5. Transcriptional Dynamics after CDK9 Inhibition in NMC Cells
(A) Time course of RNA-seq log2 fold changes for all genes (gray lines) between LDC67-treated and control (cont.) HCC2429 cells. Two gene ontology (GO) gene sets (yellow and green) andMYCandFOS(red) are indicated. Error bars represent median and 10% or 90% quantiles of all log2 fold changes at respective time points.
(B) qRT-PCR (normalized to 18S rRNA) of selected genes following LDC67 (10mM) or DMSO control (cont.) for mature mRNA (left) and for unspliced pre-mRNA (right) (mean±SD; n = 3).
(C) GO terms enriched in gene set enrichment analysis (GSEA, C5) of RNA-seq data from HCC2429 treated (48 hr) with JQ1 (gray) or LDC67 (blue) compared to controls (x axis, normalized enrichment score; FDR-corrected q values < 0.1 are considered significant).
(D) Time course of RNA-seq log2 fold changes for all genes (gray lines) between JQ1-treated and control (cont.) HCC2429 cells. Color codes as in (A).
(E) qRT-PCR (normalized to 18S rRNA) of selected genes following JQ1 (500 nM) treatment for mature mRNA (left) and for unspliced pre-mRNA (right) (mean±SEM; n = 3).
(F) qRT-PCR time course of MYC mRNA normalized to 18S rRNA after CDK9 (black) or Cyclin-T1 (gray) knockdown compared to shGFP controls (mean±SEM;
n = 3).
pausing (p = 0.01 for PI > 1 versus PI < 1) (Figure 6E) (Huang et al., 2014; P.J. O’Dwyer et al., 2016, Cancer Res., abstract). By contrast, A549 cells showed reduced Pol II occupancy in all genes on the GB and at varying degrees at the TSS (Figures 6B and 6C;Figure S5).
To further investigate CDK9i-induced Pol II distribution, we performed ChIP analyses for Pol II p-Ser5 and Pol II p-Ser2, which indicate poised Pol II and elongating Pol II, respectively.
As expected, the signal for p-Ser5 Pol II corresponded well to the total CTD-Pol II across the TSS and GB (r = 0.98, Figure 6. Effects of CDK9 Inhibition on Pol II Occupancy
(A and B) ChIP qPCR with an antibody raised against the unphosphorylated CTD assessing Pol II occupancy (displayed as a percentage of input DNA) at the transcription start site (TSS) and the gene body (GB) ofFOSandFOXO6in HCC2429 (A) and A549 (B) after 4 hr LDC67 (10mM) treatment compared to DMSO controls (mean±SD, n = 3).
(C) Relative changes of unphosphorylated CTD Pol II signal at TSS and GB between LDC67 and control cells.
(D) Pausing index (Pol II at TSS to Pol II in GB) for the selected genes normalized to DMSO control (mean±SEM; n = 3).
(E) Log2 fold changes in RNA-seq of HCC2429 cells treated with LDC67 (8 hr and 10mM) for the genes used for ChIP experiments. The p value between genes with high versus low PI was calculated by a Welch t test.
(F) Proposed model of the differential effects of CDK9 and JQ1 inhibition in NMC cells.
p < 1010). This substantiates the findings that LDC67 prevents Pol II pause release and productive elongation atFOXO6and KLHL23, thereby causing transcriptional repression of these genes (Figure S5). Surprisingly, we noticed a more pronounced decrease of the p-Ser2 Pol II signal following CDK9i at the TSS ofFOSand JUNBthan in the GB and higher p-Ser2 levels at the TSS, rather than a predominance of p-Ser2 Pol II signals in the GB (Figure S5). Even though this was unexpected, similar ob- servations are known from other ChIP studies and may be due to the genes under study and the location of primers used in the qPCR (Nojima et al., 2015; Odawara et al., 2011; Stock et al., 2007; Zhang et al., 2016). However, the constant p-Ser2 levels in the gene bodies ofFOSandJUNBfollowing LDC67 treatment, as well as the increased pre-mRNA levels, indicate productive elongation and ongoing transcription during CDK9i. Although this might be due to incomplete block of P-TEFb activity or release of P-TEFb from its inhibitory complex after short-time in- hibitor treatment (Lu et al., 2015), it may be speculated that this effect is potentially due to involvement of other CDKs (e.g., CDK12 and/or CDK13) that were shown to be capable of phos- phorylating Ser2 of Pol II CTD (Bo¨sken et al., 2014; Greifenberg et al., 2016).
Overall, differential effects were observed not only between HCC2429 and A549 but also among the genes investigated in HCC2429. Altogether, these data underline the distinctive role of CDK9 for transcriptional control in NMC cells, which may be linked with their specific vulnerability to CDK9 inhibition.
DISCUSSION
Systematic screening of genetically annotated cancer cell lines has proved to be a suitable tool for the identification of genetic vulnerabilities and potential therapeutic targets (Barretina et al., 2012; Garnett et al., 2012; Iorio et al., 2016; Martins et al., 2015; Seashore-Ludlow et al., 2015; Sos et al., 2009b, 2009a).
Our screening approach involving 1,505 kinase inhibitors coupled with a systematic deconvolution and prediction of geno- type-chemotype relationships enabled a structure-based pre- diction of biological activity in silico and may thus be of value to focus future screening projects on the most promising candi- date compounds.
To our surprise, one of the most striking genotype-specific vulnerabilities in our screen was the exquisite activity of LDC67, a known CDK9 inhibitor in NMC cells (Albert et al., 2014). Our chemical genomics approach uncovered a role of CDK9 as a non-oncogenic driver for tumorigenesis inBRD4- NUT-dependent cells mediated by regulation of transcription and Myc protein levels in NMC. CDK9 has also been identified as a key regulator of transcriptional regulation inMYC-overex- pressing hepatocellular carcinoma (Huang et al., 2014). How- ever, the evident CDK9i-induced differences on the level of Pol II-mediated transcriptional elongation observed in NMC and hepatocellular carcinoma indicate that these processes may by distinct for individual lineages.
NMC is a rare but highly aggressive tumor with a median sur- vival of 6.7 months for which no approved therapies exist (Stathis et al., 2016). An initial report from a BET inhibitor phase I/II trial (GSK525762 and NCT01587703) described partial responses
in 2 of 10 NMC patients (P.J. O’Dwyer et al., 2016, Cancer Res., abstract), while another preliminary analysis reported a partial response in 3 of 4 NMC patients after BET inhibitor OTX015/MK-8628 with relapse within a few months (Stathis et al., 2016). Of 10 NMC cases treated with GSK525762, four pa- tients responded with stable disease (P.J. O’Dwyer et al., 2016, Cancer Res., abstract). This is in line with the previous observa- tions and our results, indicating that BRD4 inhibition leads to dissolution of hyperacetylated nuclear foci, release of p53 with induction of p21, cell-cycle arrest, and differentiation (Figures 4,5C, 5D, and6F;Figure S4E) (Alekseyenko et al., 2015; Grayson et al., 2014; Reynoird et al., 2010; Yan et al., 2011). By contrast, our data reveal that CDK9i may lead to robust Mcl-1 suppres- sion, induction of DNA damage response and apoptosis in these cells (Figure 6F). For several genes, includingFOS, transcription is increased following CDK9 inhibition. This has partly been attributed to CDK9i-induced release of P-TEFb from its inhibitory complex with HEXIM1 by a CDK9 inhibitor (Lu et al., 2015), an ef- fect we also observed in NMC cells (Figure 3D and 6F; Fig- ure S3A). We speculate that this phenomenon may be related to structural changes of P-TEFb induced by CDK9 inhibitor bind- ing (Baumli et al., 2008). Although CDK9i-induced perturbation of MYCexpression partially overlaps with the effects of bromodo- main inhibition, it remains to be seen how much these effects contribute to the overall cellular phenotype observed for these types of inhibitors. Overall, our findings uncover major molecular differences between the mode of action of bromodomain and that of CDK9 inhibitors in NMC and suggest that CDK9 may be an attractive drug target in NMC patients.
In the past, clinical studies investigating spectrum CDK inhib- itors such as dinaciclib or flavopiridol reported high rates of side effects and dose-limiting toxicities (Kumar et al., 2015; Morales and Giordano, 2016), but more selective compounds such as ri- bociclib (CDK4 and CDK6) demonstrated the feasibility of CDK inhibition even as first-line cancer treatment (Hortobagyi et al., 2016). For this reason, several CDK9 inhibitors with improved selectivity profiles were developed and hold promise for future development in clinical applications (Albert et al., 2014; Lam et al., 2014; Lu et al., 2015; Morales and Giordano, 2016). Our findings may therefore be of relevance for the future develop- ment of these drugs and the stratification of patients receiving these types of selective CDK9 inhibitors.
In conclusion, our study provides a framework for the decon- volution and prediction of genotype-chemotype relationships in a large-scale kinase inhibitor screen and identifies CDK9 as a druggable target in NMC. Our results also provide insight into CDK9 exerted control of transcriptional elongation and its geno- type-specific effects inBRD4-NUT-rearranged tumors.
EXPERIMENTAL PROCEDURES High-Throughput Screening
For high-throughput screening 78 genomically annotated patient-derived lung cancer cell lines were assayed against 1,505 small-molecular compounds pre- dominantly consisting of compounds before lead or target-based optimization across a range of chemical scaffolds and a number of established reference kinase inhibitors. For screening, cell lines were treated at a single-dose con- centration, which was determined during a preliminary screen. Residual viability was assessed after 72 hr by CellTiter-Glo (CTG, Promega). Chemical
information was captured by simplified molecular input line entry specification (SMILES) codes and by manual annotation of scaffolds (Figure S6). A number of compounds and cell lines were screened in duplicate to assess reproduc- ibility. Moreover, external validity was assessed in a subset of compounds and cell lines by testing compound activity in dilution series to assess GI50after 72 hr by CTG (Promega). Genotype-specific compound activity was assessed using an ANOVA approach similar to previous studies (Barretina et al., 2012;
Garnett et al., 2012; Seashore-Ludlow et al., 2015), incorporating genotype and histological subtype in a random effects model. Activity predictions were done with elastic net regression models using ECFP6 fingerprints of the compounds as the predictor and residual viability or compound activity as the response. Models were trained on a subset of compounds with 10-fold cross-validation and were evaluated on the compounds not involved in model building and on an external validation dataset (Elkins et al., 2016).
Apoptosis, Proliferation, and Survival Assays
Apoptosis was measured by flow cytometry following Annexin V and propi- dium iodide staining on a FACS Gallios Flow Cytometer and the corresponding Kaluza analysis software (Beckman Coulter, USA). Cell-cycle analyses were performed by flow cytometry on methanol-fixed cells after propidium iodide staining. For FACS analysis of cleaved caspase-3 (CC3) andgH2AX, cells were treated for indicated times, harvested by trypsinization, and fixed in 80% methanol. Fixed cells were permeabilized and blocked with PBS/1%
BSA before they were incubated with primary antibodies at 4C overnight.
The following day, cells were washed, incubated with Alexa Fluor secondary antibodies (Thermo Scientific), and measured on a Gallios Flow Cytometer (Beckman Coulter, USA).
For clonogenic survival assays, cells were seeded in 6-well plates, treated for indicated times, fixed with 4% formaldehyde, and stained with crystal violet solution. For quantification, a 1% SDS solution was added to the wells for 30 min and absorption was measured at 590 nm in the supernatant.
Immunoblot, Immunoprecipitation, and Immunofluorescence Assays
Cellular signaling following LDC67 or JQ1 treatment was assessed by protein gel electrophoresis. Equal amounts of protein lysates were separated on 4%–20% Novex Tris-glycine gels (Invitrogen), transferred to polyvinylidene fluoride (PVDF) membrane, and incubated with indicated primary antibodies.
Proteins were detected with the Odyssey CLx imaging system (LI-COR Biosci- ences). For immunoprecipitation, antibodies directed against endogenous CDK9 or transiently transfected FLAG-CDK9 were used for precipitation at 4C overnight, followed by immunoblotting. FLAG-CDK9 plasmids were a gift of Prof. Qiang Zhou (University of California, Berkeley, USA) (Lu et al., 2015) and were transiently transfected before immunoprecipitation.
For immunofluorescence, cells were grown on coverslips and treated for 24 hr before fixation with 4% formaldehyde, followed by staining with the indi- cated primary antibodies at 4C overnight. Samples were incubated with Alexa Fluor secondary antibodies (Thermo Scientific) for 2 hr and mounted with DAPI before imaging (Zeiss Meta 510 or Zeiss Meta 710).
shRNA Knockdowns
For knockdowns, respective shRNAs or shRNA against GFP (shGFP) were generated with pLKO.1-puro vectors. Replication-deficient lentiviruses were produced in HEK293T cells by co-transfection of pLKO.1-puro vectors and helper plasmids. Supernatant collected 48 hr after transfection of HEK293T cells was used to transfect HCC2429 and A549 cells. Knockdown efficiency and effects on cell viability were validated by immunoblotting and CTG (Prom- ega) 4–6 days after transfection, as described previously (Sos et al., 2009a).
ChIP
For ChIP experiments, cells were cross-linked with formaldehyde before chro- matin was extracted, sonicated, and incubated with primary antibodies (Pol II, pSer2-Pol II or pSer5-Pol II) or mouse immunoglobulin G (IgG) overnight. Anti- body complexes were then captured with protein G beads, and DNA was eluted, decrosslinked, and purified. ChIP signals were calculated by qPCR (Table S5) relative to input levels after (IgG) background subtraction.
RNA Analysis
For RNA-seq and qPCR (Table S5) analyses, total RNA was isolated following LDC67 or JQ1 treatment. 30RNA-seq libraries were prepared with the Quant- Seq FWD 30mRNA-Seq Kit (Lexogen, Austria), sequenced on an Illumina Hi- Seq 4000, and quantified after alignment to the human genome reference hg38. Data processing and statistical analyses were performed using Micro- soft Excel (Microsoft, USA), GraphPad (Prism, USA), and R (R Development Core Team, 2011). Half-maximal growth inhibitory (GI50) concentrations of cell viability were inferred by fitting sigmoidal dose-response curves. Data are represented as mean±SEM, and significance was calculated by unpaired Student’s t tests or Mann-Whitney tests unless indicated otherwise. The p values are always two-sided. For details, seeSupplemental Information.
ACCESSION NUMBERS
The accession number for the RNA-seq data sets reported in this paper is European Genome-Phenome Archive: EGAS00001002588.
SUPPLEMENTAL INFORMATION
Supplemental Information includes Supplemental Experimental Procedures, six figures, and five tables and can be found with this article online athttp://
dx.doi.org/10.1016/j.celrep.2017.08.082.
AUTHOR CONTRIBUTIONS
J.B., M.A.D., F.D., J.M.H., A.C., S.B., C.L., V.T., A.R., D.B., Z.F., S.O.-C., M.G., M.T., M.S., and H.B.-W. performed experiments. A.C., J.E., U.K., F.D., Z.F., P.H., M.G., M.T., and M.S. performed drug screening. J.B., F.L., and M.P.
analyzed RNA-seq data. C.A.F. provided NMC cell lines. Z.G., Z.V., L.O¨ ., G.K., and S.A. helped in experimental design and provided compounds and chemical structural information. J.B., M.A.D., S.B., A.C., Z.F., C.A.F., Z.V., L.O¨ ., G.K., H.C.R., S.A., L.C.H., R.B., D.R., B.M.K., R.K.T., and M.L.S.
conceived experiments and wrote the manuscript. R.K.T. and M.L.S.
conceived the study.
ACKNOWLEDGMENTS
We thank Prof. Oliver Gautschi (Cantonal Hospital Lucerne, Switzerland) for insightful discussions, Dr. Graziella Bosco (University of Cologne, Germany) for help with RNA-seq data processing, and Prof. Nicolaus Friedrich (Univer- sity of Cologne, Germany) for immunohistological staining. We thank Prof.
Qiang Zhou (University of California, Berkeley, USA) for providing FLAG- CDK9 constructs. B.M.K. dedicates this work to the memory of Dr. Gyo¨rgy Keri, CEO of Vichem and professor at the Semmelweis University, Budapest, Hungary. Gyo¨rgy recently lost his fight against cancer. He was a great scientist and a wonderful friend. We are also sad to announce that Z.G. passed away during the course of this project. With him we lost a productive researcher and much-valued colleague. This work was supported by the German federal state North Rhine Westphalia (NRW) as part of the FIT program (grant 314- 4000-1209 to B.M.K. and LDC), by the European Union (European Regional Development Fund: Investing In Your Future) as part of the PerMed.NRW initia- tive (grant 005-1111-0025 to R.K.T., D.R., R.B., and LDC) and the EFRE initia- tive (grant EFFRE-0800397 to B.M.K., H.C.R., D.R., R.B., R.K.T., M.L.S., and LDC), by the German Ministry of Science and Education (BMBF) as part of the e:Med program (grants 01ZX1303 and 01ZX1603 to R.K.T., H.C.R., R.B., M.P., and D.R. and grant 01ZX1406 to M.L.S. and M.P.), by the German Con- sortium for Translational Cancer Research (DKTK) Joint Funding program (to R.K.T.), and by the BMBF as part of the NGFNplus program (grant 01GS08100 to R.K.T.). F.D. was supported by the Mildred-Scheel-Doktoran- denprogramm of the Max-Planck Society (grant 110770 to F.D. and R.K.T.).
V.T. is the recipient of a joint ERS/EMBO Long-Term Research Fellowship (LTRF 2014-2951) and a Swiss Cancer League postdoctoral research fellow- ship (BIL KFS-3402-02-2014). R.K.T. is a consultant of NEO New Oncology GmbH and received honoraria from AstraZeneca, Bayer, NEO New Oncology GmbH, Boehringer Ingelheim, Clovis Oncology, Daiichi-Sankyo, Eli Lilly,
Johnson & Johnson (J&J), Merck KGaA, MSD, Puma, Roche, and Sanofi.
J.M.H. is a full-time employee and co-founder of NEO New Oncology GmbH. M.L.S. received a commercial research grant from Novartis. A.C., R.K.T., P.H., B.M.K., J.E., and J.M.H. hold the patent ‘‘CDK9 inhibitors in the treatment of midline carcinoma.’’ R.B. has received honoraria for invited lec- tures and participation in SABs from Roche, Pfizer, Novartis, Boehringer-Ingel- heim, Eli Lilly, Merck-Serono, and Qiagen. R.B. is a co-founder and serves as the chief scientific advisor of Targos Molecular Pathology Inc. (Kassel, Ger- many). D.R. reports consulting and lecture fees (Sanofi-Aventis, Astra-Zeneca, Novartis, Pfizer, Takeda, and Boehringer) and research support (MSD, Bayer Health Care, Merck-Serono, Bayer Crop Science, and J&J). H.C.R. received consulting and lecture fees (Merck, Celgene). A.C., P.H., J.E., U.K., and B.M.K. are employees of LDC, which has several commercial agreements in place with pharmaceutical companies.
Received: February 17, 2017 Revised: June 27, 2017 Accepted: August 24, 2017 Published: September 19, 2017
REFERENCES
Albert, T.K., Rigault, C., Eickhoff, J., Baumgart, K., Antrecht, C., Klebl, B., Mittler, G., and Meisterernst, M. (2014). Characterization of molecular and cellular functions of the cyclin-dependent kinase CDK9 using a novel specific inhibitor. Br. J. Pharmacol.171, 55–68.
Alekseyenko, A.A., Walsh, E.M., Wang, X., Grayson, A.R., Hsi, P.T., Kharch- enko, P.V., Kuroda, M.I., and French, C.A. (2015). The oncogenic BRD4- NUT chromatin regulator drives aberrant transcription within large topological domains. Genes Dev.29, 1507–1523.
Barretina, J., Caponigro, G., Stransky, N., Venkatesan, K., Margolin, A.A., Kim, S., Wilson, C.J., Leha´r, J., Kryukov, G.V., Sonkin, D., et al. (2012). The Cancer Cell Line Encyclopedia enables predictive modelling of anticancer drug sensi- tivity. Nature483, 603–607.
Baumli, S., Lolli, G., Lowe, E.D., Troiani, S., Rusconi, L., Bullock, A.N., Debrec- zeni, J.E., Knapp, S., and Johnson, L.N. (2008). The structure of P-TEFb (CDK9/cyclin T1), its complex with flavopiridol and regulation by phosphoryla- tion. EMBO J.27, 1907–1918.
Bo¨sken, C.A., Farnung, L., Hintermair, C., Merzel Schachter, M., Vogel-Bach- mayr, K., Blazek, D., Anand, K., Fisher, R.P., Eick, D., and Geyer, M. (2014).
The structure and substrate specificity of human Cdk12/Cyclin K. Nat.
Commun.5, 3505.
Buettner, R., Wolf, J., and Thomas, R.K. (2013). Lessons learned from lung cancer genomics: the emerging concept of individualized diagnostics and treatment. J. Clin. Oncol.31, 1858–1865.
Chan, D.A., Sutphin, P.D., Nguyen, P., Turcotte, S., Lai, E.W., Banh, A., Rey- nolds, G.E., Chi, J.-T., Wu, J., Solow-Cordero, D.E., et al. (2011). Targeting GLUT1 and the Warburg effect in renal cell carcinoma by chemical synthetic lethality. Sci. Transl. Med.3, 94ra70.
Chen, E.X., Hotte, S., Hirte, H., Siu, L.L., Lyons, J., Squires, M., Lovell, S., Turner, S., McIntosh, L., and Seymour, L. (2014). A phase I study of cyclin- dependent kinase inhibitor, AT7519, in patients with advanced cancer: NCIC Clinical Trials Group IND 177. Br. J. Cancer111, 2262–2267.
Clinical Lung Cancer Genome Project (CLCGP); Network Genomic Medicine (NGM) (2013). A genomics-based classification of human lung tumors. Sci.
Transl. Med.5, 209ra153.
Elkins, J.M., Fedele, V., Szklarz, M., Abdul Azeez, K.R., Salah, E., Mikolajczyk, J., Romanov, S., Sepetov, N., Huang, X.-P., Roth, B.L., et al. (2016). Compre- hensive characterization of the published kinase inhibitor set. Nat. Biotechnol.
34, 95–103.
Fece de la Cruz, F., Gapp, B.V., and Nijman, S.M.B. (2015). Synthetic lethal vulnerabilities of cancer. Annu. Rev. Pharmacol. Toxicol.55, 513–531.
Filippakopoulos, P., Qi, J., Picaud, S., Shen, Y., Smith, W.B., Fedorov, O., Morse, E.M., Keates, T., Hickman, T.T., Felletar, I., et al. (2010). Selective inhi- bition of BET bromodomains. Nature468, 1067–1073.
Flaherty, K.T., Infante, J.R., Daud, A., Gonzalez, R., Kefford, R.F., Sosman, J., Hamid, O., Schuchter, L., Cebon, J., Ibrahim, N., et al. (2012). Combined BRAF and MEK inhibition in melanoma with BRAF V600 mutations. N. Engl. J. Med.
367, 1694–1703.
French, C.A., Miyoshi, I., Kubonishi, I., Grier, H.E., Perez-Atayde, A.R., and Fletcher, J.A. (2003). BRD4-NUT fusion oncogene: a novel mechanism in aggressive carcinoma. Cancer Res.63, 304–307.
Garnett, M.J., Edelman, E.J., Heidorn, S.J., Greenman, C.D., Dastur, A., Lau, K.W., Greninger, P., Thompson, I.R., Luo, X., Soares, J., et al. (2012). System- atic identification of genomic markers of drug sensitivity in cancer cells. Nature 483, 570–575.
Grayson, A.R., Walsh, E.M., Cameron, M.J., Godec, J., Ashworth, T., Am- brose, J.M., Aserlind, A.B., Wang, H., Evan, G., Kluk, M.J., et al. (2014).
MYC, a downstream target of BRD-NUT, is necessary and sufficient for the blockade of differentiation in NUT midline carcinoma. Oncogene33, 1736–
1742.
Gregory, G.P., Hogg, S.J., Kats, L.M., Vidacs, E., Baker, A.J., Gilan, O., Lefe- bure, M., Martin, B.P., Dawson, M.A., Johnstone, R.W., and Shortt, J. (2015).
CDK9 inhibition by dinaciclib potently suppresses Mcl-1 to induce durable apoptotic responses in aggressive MYC-driven B-cell lymphoma in vivo. Leu- kemia29, 1437–1441.
Greifenberg, A.K., Ho¨nig, D., Pilarova, K., D€uster, R., Bartholomeeusen, K., Bo¨sken, C.A., Anand, K., Blazek, D., and Geyer, M. (2016). Structural and func- tional analysis of the Cdk13/cyclin K complex. Cell Rep.14, 320–331.
Hortobagyi, G.N., Stemmer, S.M., Burris, H.A., Yap, Y.-S., Sonke, G.S., Paluch-Shimon, S., Campone, M., Blackwell, K.L., Andre´, F., Winer, E.P., et al. (2016). Ribociclib as first-line therapy for HR-positive, advanced breast cancer. N. Engl. J. Med.375, 1738–1748.
Hu, Y., and Bajorath, J. (2013). Systematic identification of scaffolds repre- senting compounds active against individual targets and single or multiple target families. J. Chem. Inf. Model.53, 312–326.
Huang, C.-H., Lujambio, A., Zuber, J., Tschaharganeh, D.F., Doran, M.G., Evans, M.J., Kitzing, T., Zhu, N., de Stanchina, E., Sawyers, C.L., et al.
(2014). CDK9-mediated transcription elongation is required for MYC addiction in hepatocellular carcinoma. Genes Dev.28, 1800–1814.
Hyman, D.M., Puzanov, I., Subbiah, V., Faris, J.E., Chau, I., Blay, J.-Y., Wolf, J., Raje, N.S., Diamond, E.L., Hollebecque, A., et al. (2015). Vemurafenib in multiple nonmelanoma cancers with BRAF V600 mutations. N. Engl. J. Med.
373, 726–736.
Iorio, F., Knijnenburg, T.A., Vis, D.J., Bignell, G.R., Menden, M.P., Schubert, M., Aben, N., Gonc¸alves, E., Barthorpe, S., Lightfoot, H., et al. (2016). A land- scape of pharmacogenomic interactions in cancer. Cell166, 740–754.
Itzen, F., Greifenberg, A.K., Bo¨sken, C.A., and Geyer, M. (2014). Brd4 activates P-TEFb for RNA polymerase II CTD phosphorylation. Nucleic Acids Res.42, 7577–7590.
Kandoth, C., McLellan, M.D., Vandin, F., Ye, K., Niu, B., Lu, C., Xie, M., Zhang, Q., McMichael, J.F., Wyczalkowski, M.A., et al. (2013). Mutational landscape and significance across 12 major cancer types. Nature502, 333–339.
Kumar, S.K., LaPlant, B., Chng, W.J., Zonder, J., Callander, N., Fonseca, R., Fruth, B., Roy, V., Erlichman, C., and Stewart, A.K.; Mayo Phase 2 Consortium (2015). Dinaciclib, a novel CDK inhibitor, demonstrates encouraging single- agent activity in patients with relapsed multiple myeloma. Blood125, 443–448.
Lam, F., Abbas, A.Y., Shao, H., Teo, T., Adams, J., Li, P., Bradshaw, T.D., Fischer, P.M., Walsby, E., Pepper, C., et al. (2014). Targeting RNA transcription and translation in ovarian cancer cells with pharmacological inhibitor CDKI-73.
Oncotarget5, 7691–7704.
Lemke, J., von Karstedt, S., Abd El Hay, M., Conti, A., Arce, F., Montinaro, A., Papenfuss, K., El-Bahrawy, M.A., and Walczak, H. (2014). Selective CDK9 in- hibition overcomes TRAIL resistance by concomitant suppression of cFlip and Mcl-1. Cell Death Differ.21, 491–502.
Lorenzin, F., Benary, U., Baluapuri, A., Walz, S., Jung, L.A., von Eyss, B., Kisker, C., Wolf, J., Eilers, M., and Wolf, E. (2016). Different promoter affinities account for specificity in MYC-dependent gene regulation. eLife5, e15161.
Lu, H., Xue, Y., Yu, G.K., Arias, C., Lin, J., Fong, S., Faure, M., Weisburd, B., Ji, X., Mercier, A., et al. (2015). Compensatory induction of MYC expression by sustained CDK9 inhibition via a BRD4-dependent mechanism. eLife4, e06535.
Martins, M.M., Zhou, A.Y., Corella, A., Horiuchi, D., Yau, C., Rakshandehroo, T., Gordan, J.D., Levin, R.S., Johnson, J., Jascur, J., et al. (2015). Linking tumor mutations to drug responses via a quantitative chemical-genetic inter- action map. Cancer Discov.5, 154–167.
McLornan, D.P., List, A., and Mufti, G.J. (2014). Applying synthetic lethality for the selective targeting of cancer. N. Engl. J. Med.371, 1725–1735.
Morales, F., and Giordano, A. (2016). Overview of CDK9 as a target in cancer research. Cell Cycle15, 519–527.
Nojima, T., Gomes, T., Grosso, A.R.F., Kimura, H., Dye, M.J., Dhir, S., Carmo- Fonseca, M., and Proudfoot, N.J. (2015). Mammalian NET-seq reveals genome-wide nascent transcription coupled to RNA processing. Cell161, 526–540.
Odawara, J., Harada, A., Yoshimi, T., Maehara, K., Tachibana, T., Okada, S., Akashi, K., and Ohkawa, Y. (2011). The classification of mRNA expression levels by the phosphorylation state of RNAPII CTD based on a combined genome-wide approach. BMC Genomics12, 516.
R Development Core Team (2011). R: a language and environment for statis- tical computing (R Foundation for Statistical Computing).
Reynoird, N., Schwartz, B.E., Delvecchio, M., Sadoul, K., Meyers, D., Mukher- jee, C., Caron, C., Kimura, H., Rousseaux, S., Cole, P.A., et al. (2010). Onco- genesis by sequestration of CBP/p300 in transcriptionally inactive hyperacety- lated chromatin domains. EMBO J.29, 2943–2952.
Riniker, S., and Landrum, G.A. (2013). Open-source platform to benchmark fingerprints for ligand-based virtual screening. J. Cheminform.5, 26.
Rosell, R., Carcereny, E., Gervais, R., Vergnenegre, A., Massuti, B., Felip, E., Palmero, R., Garcia-Gomez, R., Pallares, C., Sanchez, J.M., et al.; Spanish Lung Cancer Group in collaboration with Groupe Franc¸ais de Pneumo-Can- ce´rologie and Associazione Italiana Oncologia Toracica (2012). Erlotinib versus standard chemotherapy as first-line treatment for European patients with advanced EGFR mutation-positive non-small-cell lung cancer (EURTAC):
a multicentre, open-label, randomised phase 3 trial. Lancet Oncol. 13, 239–246.
Rossi, K.A., Markwalder, J.A., Seitz, S.P., Chang, C.-H., Cox, S., Boisclair, M.D., Brizuela, L., Brenner, S.L., and Stouten, P.F.W. (2005). Understanding and modulating cyclin-dependent kinase inhibitor specificity: molecular modeling and biochemical evaluation of pyrazolopyrimidinones as CDK2/cy- clin A and CDK4/cyclin D1 inhibitors. J. Comput. Aided Mol. Des.19, 111–122.
Seashore-Ludlow, B., Rees, M.G., Cheah, J.H., Cokol, M., Price, E.V., Coletti, M.E., Jones, V., Bodycombe, N.E., Soule, C.K., Gould, J., et al. (2015).
Harnessing connectivity in a large-scale small-molecule sensitivity dataset.
Cancer Discov.5, 1210–1223.
Shaw, A.T., Kim, D.-W., Nakagawa, K., Seto, T., Crino´, L., Ahn, M.-J., De Pas, T., Besse, B., Solomon, B.J., Blackhall, F., et al. (2013). Crizotinib versus
chemotherapy in advanced ALK-positive lung cancer. N. Engl. J. Med.368, 2385–2394.
Sos, M.L., Fischer, S., Ullrich, R., Peifer, M., Heuckmann, J.M., Koker, M., Heynck, S., St€uckrath, I., Weiss, J., Fischer, F., et al. (2009a). Identifying geno- type-dependent efficacy of single and combined PI3K- and MAPK-pathway inhibition in cancer. Proc. Natl. Acad. Sci. USA106, 18351–18356.
Sos, M.L., Michel, K., Zander, T., Weiss, J., Frommolt, P., Peifer, M., Li, D., Ull- rich, R., Koker, M., Fischer, F., et al. (2009b). Predicting drug susceptibility of non-small cell lung cancers based on genetic lesions. J. Clin. Invest.119, 1727–1740.
Squires, M.S., Feltell, R.E., Wallis, N.G., Lewis, E.J., Smith, D.M., Cross, D.M., Lyons, J.F., and Thompson, N.T. (2009). Biological characterization of AT7519, a small-molecule inhibitor of cyclin-dependent kinases, in human tumor cell lines. Mol. Cancer Ther.8, 324–332.
Stathis, A., Zucca, E., Bekradda, M., Gomez-Roca, C., Delord, J.P., de La Motte Rouge, T., Uro-Coste, E., de Braud, F., Pelosi, G., and French, C.A.
(2016). Clinical response of carcinomas harboring the BRD4-NUT oncoprotein to the targeted bromodomain inhibitor OTX015/MK-8628. Cancer Discov.6, 492–500.
Stock, J.K., Giadrossi, S., Casanova, M., Brookes, E., Vidal, M., Koseki, H., Brockdorff, N., Fisher, A.G., and Pombo, A. (2007). Ring1-mediated ubiquitina- tion of H2A restrains poised RNA polymerase II at bivalent genes in mouse ES cells. Nat. Cell Biol.9, 1428–1435.
Van Cutsem, E., Ko¨hne, C.H., La´ng, I., Folprecht, G., Nowacki, M.P., Cascinu, S., Shchepotin, I., Maurel, J., Cunningham, D., Tejpar, S., et al. (2011). Cetux- imab plus irinotecan, fluorouracil, and leucovorin as first-line treatment for metastatic colorectal cancer: updated analysis of overall survival according to tumor KRAS and BRAF mutation status. J. Clin. Oncol.29, 2011–2019.
Walsby, E., Pratt, G., Shao, H., Abbas, A.Y., Fischer, P.M., Bradshaw, T.D., Brennan, P., Fegan, C., Wang, S., and Pepper, C. (2014). A novel Cdk9 inhibitor preferentially targets tumor cells and synergizes with fludarabine. Oncotarget 5, 375–385.
Yan, J., Diaz, J., Jiao, J., Wang, R., and You, J. (2011). Perturbation of BRD4 protein function by BRD4-NUT protein abrogates cellular differentiation in NUT midline carcinoma. J. Biol. Chem.286, 27663–27675.
Yu, D.S., Zhao, R., Hsu, E.L., Cayer, J., Ye, F., Guo, Y., Shyr, Y., and Cortez, D.
(2010). Cyclin-dependent kinase 9-cyclin K functions in the replication stress response. EMBO Rep.11, 876–882.
Zhang, H., Park, S.-H., Pantazides, B.G., Karpiuk, O., Warren, M.D., Hardy, C.W., Duong, D.M., Park, S.-J., Kim, H.S., Vassilopoulos, A., et al. (2013).
SIRT2 directs the replication stress response through CDK9 deacetylation.
Proc. Natl. Acad. Sci. USA110, 13546–13551.
Zhang, T., Kwiatkowski, N., Olson, C.M., Dixon-Clarke, S.E., Abraham, B.J., Greifenberg, A.K., Ficarro, S.B., Elkins, J.M., Liang, Y., Hannett, N.M., et al.
(2016). Covalent targeting of remote cysteine residues to develop CDK12 and CDK13 inhibitors. Nat. Chem. Biol.12, 876–884.
Zou, H., and Hastie, T. (2005). Regularization and variable selection via the elastic net. J.R. Stat. Soc.67, 301–320.