Article
Cytotoxic, Antimicrobial, Antioxidant Properties and E ff ects on Cell Migration of Phenolic Compounds of Selected Transylvanian Medicinal Plants
Rita Csepregi1,2, Viktória Temesf ˝oi1,2 , Sourav Das1,2 ,Ágnes Alberti3 , Csenge Anna Tóth3 , Róbert Herczeg2, Nóra Papp4and Tamás K ˝oszegi1,2,*
1 Department of Laboratory Medicine, University of Pécs, Medical School, Ifjúság u. 13, 7624 Pécs, Hungary;
ritacsepregi93@gmail.com (R.C.); vtemesfoi@gmail.com (V.T.); pharma.souravdas@gmail.com (S.D.)
2 János Szentágothai Research Center, University of Pécs, Ifjúság u. 20, 7624 Pécs, Hungary;
herczeg.robert@pte.hu
3 Department of Pharmacognosy, Semmelweis University, Üll˝oiút 26, 1085 Budapest, Hungary;
albertiagnes@gmail.com (Á.A.); csenge512@gmail.com (C.A.T.)
4 Department of Pharmacognosy, University of Pécs, Faculty of Pharmacy, Rókus u. 2, 7624 Pécs, Hungary;
nora4595@gamma.ttk.pte.hu
* Correspondence: tamas.koszegi@aok.pte.hu; Tel.:+36-30-491-7719; Fax:+36-72-536-121
Received: 24 January 2020; Accepted: 15 February 2020; Published: 18 February 2020 Abstract:Medicinal plants are widely used in folk medicine but quite often their composition and biological effects are hardly known. Our study aimed to analyze the composition, cytotoxicity, antimicrobial, antioxidant activity and cellular migration effects of Anthyllis vulneraria, Fuchsia magellanica,Fuchsia triphyllaandLysimachia nummulariaused in the Romanian ethnomedicine for wounds. Liquid chromatography with mass spectrometry (LC-MS/MS) was used to analyze 50%
(v/v) ethanolic and aqueous extracts of the plants’ leaves. Antimicrobial activities were estimated with a standard microdilution method. The antioxidant properties were evaluated by validated chemical cell-free and biological cell-based assays. Cytotoxic effects were performed on mouse fibroblasts and human keratinocytes with a plate reader-based method assessing intracellular adenosine triphosphate (ATP), nucleic acid and protein contents and also by a flow cytometer-based assay detecting apoptotic–necrotic cell populations. Cell migration to cover cell-free areas was visualized by time-lapse phase-contrast microscopy using standard culture inserts. Fuchsiaspecies showed the strongest cytotoxicity and the highest antioxidant and antimicrobial activity. However, their ethanolic extracts facilitated cell migration, most probably due to their various phenolic acid, flavonoid and anthocyanin derivatives. Our data might serve as a basis for further animal experiments to explore the complex action ofFuchsiaspecies in wound healing assays.
Keywords: Anthyllis vulneraria; Fuchsia magellanica; Fuchsia triphylla; Lysimachia nummularia;
antimicrobial activity; antioxidant capacity; fibroblasts; keratinocytes; cytotoxicity; cell migration
1. Introduction
Nowadays, the investigation of natural extracts from medicinal plants has been increased due to their rich content of bioactive compounds such as polyphenols, vitamins and proteins, which are found in different parts of plants [1]. Phenolic compounds (flavonoids, phenolic acids, anthocyanins, tannins) are secondary metabolites, which play a crucial role in the pharmaceutical sciences, thanks to their extensive biological effects (antimicrobial, antioxidant, anticancer properties). These bioactive substances have diverse basic structures but possess an aromatic ring bearing one or more hydroxyl groups, which can be related to different biological impacts [2,3].
Antioxidants2020,9, 166; doi:10.3390/antiox9020166 www.mdpi.com/journal/antioxidants
Medicinal plants are of primary importance in several regions of Transylvania, part of Romania.
In our work, four plants were selected according to the previously described ethnomedicinal and phytochemical data. These medicinal plants are widely used in Transylvania, part of Romania. Another reason to select these herbs was that there are only a few scientific records in databases on them. The selected species are applied on wounds in traditional remedies in the country.Anthyllis vulnerariaL.
(common kidney-vetch, Leguminosae) is an annual, biennial or perennial plant that occurs in fields and meadows throughout Europe [4]. In Transylvania, the aerial part is used as an antiemetic drug [5], for swelling [6], wounds [7], kidney problems and diabetes as a tea [8] and as fodder [9]. In Lueta (local name: szipókavirág), it is used for wounds and stomach disorders as a tea (Nóra Papp, unpublished data). Its aerial part contains several bioactive compounds such as flavonoids, saponins [10,11], carotenoids, tannins and phenolic acids [12].Lysimachia nummulariaL. (creeping Jenny, Primulaceae) is an evergreen plant which lives mostly in ditches and wet grasslands, and in some places as a cultivated species throughout Europe [4]. In the Transylvanian ethnomedicine (local name: fillérf ˝u, fillérlapi) the aerial part is used for toothache as a decoction [6], rheumatoid arthritis [13,14], wound and abscess as a fomentation [7,9,15,16], and pain of the legs as a fomentation and bath [17]. The leaves are rich in flavonoids [18] and triterpenoid saponins [19].Fuchsia magellanicaLam. andFuchsia triphyllaL. (hardy fuchsia and lady’s eardrops, Onagraceae) are perennial cultivated plants all over in Europe, in addition, F. magellanicais locally naturalized, e.g., in Azores, Ireland, and Britain [4]. Fresh leaves of several Fuchsiavarieties are ethnomedicinally applied on wounds [9], furuncles and skin inflammation as a fomentation [17,20]. Anthocyanins were detected in the flowers and berries ofFuchsiaspecies [21,22], while in their leaves several flavonoids were present [23].
In our experiments, to get a comprehensive picture regarding the phenolic content, reversed-phase liquid chromatography coupled with tandem mass spectrometry (RP-LC-DAD-MS/MS) was used to tentatively characterize flavonoid and phenolic acid compounds. The main effects of the active constituents of the leaf extracts of selected plants in favor of wound healing are protection against microbial infection from the external environment, scavenging of free radicals with antioxidant effects and enhancing of cell migration, proliferation, angiogenesis and collagen production in the wounded area [24–26]. Therefore, the aim of the study was to test the antioxidant activity of the leaf extracts, where conventional total antioxidant capacity (TAC) chemical tests and cell-based antioxidant methods were applied. Besides that, we evaluated the antimicrobial properties by determination of the inhibitory effect of the leaf extracts against several Gram-positive and Gram-negative bacterial strains. The wound healing process means the interplay between various cell types, including neutrophils, macrophages, keratinocytes, fibroblasts, and endothelial cells [26,27]. For this reason, we applied fibroblast- and keratinocyte-based cellular models. To determine the nontoxic concentrations of the tested leaf extracts, we combined our previously published plate reader-based cell viability assay [28] with more sensitive flow cytometer-based fluorescence apoptotic–necrotic cell detection. Additionally, cell-based methods were performed by a time-lapse live imaging technique in order to measure the effects of the leaf extracts on the closure rate of standardized cell-free areas in a migration assay. These techniques enabled us to evaluate the biochemical properties of our plant extracts and to show their diverse biological effects on human keratinocyte and mouse fibroblast cell lines.
2. Materials and Methods
2.1. Reagents and Chemicals
Luminol (3-aminophthalhydrazide), 4-iodophenol, Trolox (6-hydroxy-2,5,7,8-tetramethylchroman- 2-carboxylic acid), horseradish peroxidase (POD), Na2-fluorescein, AAPH (2,20-azo-bis(2- amidinopropane) dihydrochloride), 2,2-Diphenyl-1-picrylhydrazyl (DPPH), potassium persulfate (K2S2O8), 2,20-azino-bis(3-ethylbenzothiazoline-6-sulfonic acid) (ABTS), 20,70-dichlorofluorescein diacetate (DCFH-DA), dihydrorhodamine 123 (DHR123), quercetin, modified RPMI 1640 (supplemented with 165 mM MOPS, 100 mM glucose and 0.185 mM adenine), erythromycin, Dulbecco’s
Modified Eagle Medium (DMEM), trypsin-EDTA, penicillin–streptomycin for cell culture, acetic acid and methanol of HPLC supergradient grade for LC-MS analyses, propidium iodide (PI), fluorescamine (Fluram) and 7-aminoactinomycin D (7AAD) were purchased from Sigma-Aldrich/Merck (Darmstadt, Germany). 3-(N-morpholino) propanesulfonic acid (MOPS) was from Serva Electrophoresis GmbH (Heidelberg, Germany). Ethanol (96%v/v, spectroscopic grade), glucose, adenine, agar-agar, and hydrogen peroxide (H2O2) were from Reanal Labor (Budapest, Hungary), while bioluminescent ATP Assay Kit CLSII and peroxide-free Triton X 100 (TX-100) were from Roche (Mannheim, Germany). Fetal bovine serum (FBS; Pan-Biotech, Aidenbach, Germany), and bovine serum albumin (BSA; Biosera, Nuaille, France) were used. Recombinant human platelet-derived growth factor-BB (PDGF-BB), phosphate-buffered saline (PBS, pH 7.4), Hanks’ Balanced Salt Solution (5.5 mM glucose) and Annexin V were from Thermo Fischer Scientific (Waltham, Massachusetts, USA). Highly purified water (<1.0µS) was applied throughout the experiments. Plastic cell culture flasks and culture plates (96-well, 24-well and 6-well) were from TPP (Trasadingen, Switzerland), while standard 96-well plates were from Greiner Bio-One (Kremsmunster, Austria). For luminescence studies white 96-well optiplates were used (Perkin Elmer, Waltham, MA, USA).
2.2. Studied Plant Taxa and Plant Extraction
Voucher specimens of the selected four plants with unique codes were deposited at the Department of Pharmacognosy, University of Pécs, Pécs, Hungary. Fresh leaves ofAnthyllis vulneraria(A. vulneraria, Voucher code: TR_7) andLysimachia nummularia(L. nummularia, Voucher code: TR_15) were collected locally in Transylvania in July 2018, whileFuchsia magellanica(F. magellanica, Voucher code: TR_10) and Fuchsia triphyllaleaves (F. triphylla, Voucher code: TR_9) were collected in June 2018 from the Botanical Garden of the University of Pécs, Pécs, Hungary.
Plant samples were dried at room temperature and stored in the dark. The plant extraction was performed according to the method of Lee et al. with some modifications [29].The aqueous and ethanolic extracts were obtained by extracting 3 g of leaf powder in 30 mL of 50% (v/v) ethanol or distilled water on an orbital shaker (Dual-Action Shaker KL2, Edmund Bühler GmbH, Bodelshausen, Germany) at room temperature overnight (200 rpm). The extracts were filtered through a 0.45µm pore-size syringeless filter (Whatman Mini-UniPrep, Maidstone, United Kingdom), and further concentrated using a rotary vacuum evaporator (Rotavapor R-3, Buchi Labortechnik AG, Flawil, Switzerland).
Amounts between 70–80 mg were obtained, which were dissolved in 1 mL of 50% (v/v) ethanol or distilled water. All prepared aqueous and ethanolic extracts were stored at−20◦C until the experiments were performed.
2.3. Analyses of Phenolic Compounds by HPLC with Diode-array Detector and Electrospray Ionization with MS
2.3.1. HPLC Conditions
The chromatographic separation was performed on an Agilent 1100 HPLC system equipped with a G1379A degasser, G1312A binary gradient pump, G1329A autosampler, G1316A column thermostat and G1315C diode array detector (DAD) (Agilent Technologies, Waldbronn, Germany). Samples were separated on a Zorbax SB-C18 (Agilent Technologies, Santa Clara, CA, USA) (150 mm length, 3.0 mm i.d., 3.5µm particle diameter) column, maintained at 25◦C. The mobile phase was composed of 0.3%
acetic acid in water (v/v) (A) and methanol (B). The following gradient program was applied, at a flow rate of 0.3 mL/min with the composition of the mobile phase changing from 5% B to 100% B in 30 min, maintaining 100% B for 5 min and returning to 5% B in 1 min. All aqueous solvents were filtered through MF-Millipore (Millipore, Billerica, MA, USA) (0.45µm, mixed cellulose esters) membrane filters. Chromatograms were acquired at 280 nm. Injection volume was 5µL. Prior to injection, all samples were filtered through Sartorius (Goettingen, Germany) Minisart RC15 (0.2µm) syringe filters.
2.3.2. MS Conditions
Mass spectrometric analyses were performed with an Agilent 6410B triple quadrupole equipped with an electrospray ionization source (ESI) (Agilent Technologies, Palo Alto, CA, USA). ESI conditions were as follows: temperature: 350◦C, nebulizer pressure: 40 psi, N2drying gas flow rate: 9 L/min, fragmentor voltage: 120 V, capillary voltage: 4000 V, collision energy was changed between 10 eV and 45 eV, depending on the analyzed structure. High purity nitrogen was used as collision gas. Full mass scan spectra were recorded in negative and for anthocyanins in positive ionization mode over the range ofm/z50–1000 Da (scan/s). The MassHunter B.01.03 software was used for data acquisition and qualitative analysis.
2.4. Determination of Minimum Inhibitory Concentration (MIC80) with Microdilution Method
All the bacterial strains were collected from Szeged Microbiology Collection (SZMC), Department of Microbiology, University of Szeged, Hungary, and from Pécs Microbiology Collection (PMC), Department of General and Environmental Microbiology, Institute of Biology, University of Pécs, Hungary. Tested strains were the followings:Bacillus subtilis(B. subtilis, SZMC strain: 0209),Escherichia coli(E. coli, PMC strain: 201),Staphylococcus aureus(S. aureus, ATCC strain: 29213),Streptococcus pyogenes (S. pyogenes, SZMC strain: 0119) andPseudomonas aeruginosa(P. aeruginosa, PMC strain: 103).
The microdilution method was performed according to a previously published method with some modifications [30]. In brief, 100µL of bacterial suspensions (105CFU/mL) in modified RPMI 1640 and 100µL of diluted aqueous or 50% (v/v) ethanolic leaf extracts in modified RPMI 1640 media were pipetted into each well of sterile 96-well plates. The sterile medium was considered as negative control, the inoculated RPMI 1640 without any treatment was taken as the bacterial growth control, while erythromycin was used as positive control. The final concentration of the ethanolic solvent for the dilution was restricted up to 1.0% v/v in the wells. The absorbance was measured at 595 nm on Multiskan EX 355 (Thermo Electron Corporation, Waltham, Massachusetts, USA) spectrophotometer, after 24 h incubation time at 30◦C. Absorbance values lower than 20% of the bacterial growth controls were considered as MIC80. Treatments were carried out with three technical replicates in five independent experiments.
2.5. Total Antioxidant Capacity (TAC) Assays
2.5.1. Oxygen Radical Absorbance Capacity (ORAC) Assay
The ORAC test was executed according to the method of K˝oszegi et al. without modifications [31].
The method is based on fluorescence quenching of Na2-fluorescein oxidized by AAPH. The quenching is delayed by the antioxidants present in the standards/samples. Serial dilutions of Trolox were used as standard. Briefly, into each well of normal 96-well plates 150µL of working fluorescein solution (400 nM dissolved in 75 mM potassium phosphate buffer, pH 7.5) and 25µL of blank/standard/plant extract (aqueous/ethanolic) were pipetted and the plates were preincubated for 30 min at 37◦C in the dark. After automated injection of 25µL of AAPH solution (400 mM dissolved in 75 mM potassium phosphate buffer, pH 7.5) the fluorescence intensities were measured in kinetic mode for 80 min at 37◦C, with excitation and emission wavelengths of 490 and 520 nm, respectively. For the fluorescence measurements, the plate reader (BioTek Synergy HT, Winooski, Vermont, USA) was thermostated at 37◦C. Five independent experiments were done with three technical replicates for each treatment.
2.5.2. Enhanced Chemiluminescence (ECL) Assay
The enhanced chemiluminescence method was performed following our previously published study without modifications [31]. The technique is based on the development of enhanced chemiluminescence (ECL) of luminol in the presence of peroxidase (POD), H2O2and 4-iodophenol enhancer. The increase of the ECL signal is delayed, depending on the antioxidant capacity of the samples. Briefly, 70µL of ECL detection reagent (0.15 M boric acid/NaOH, pH 9.6, supplemented
with 0.45 mM luminol and 1.8 mM 4-iodophenol) and 200 µL POD enzyme solution (15µU/mL) were premixed and kept on ice. Trolox dilutions were used as standard. Into each well of white optical 96-well plates 20µL Trolox/blank/sample and 270µL of POD-ECL reagent were added. The reaction was initiated by automated injection of 20µL ice-cold H2O2(1.5 mM, in 0.1% citric acid).
The chemiluminescence signal was followed for 10 min, using a plate reader (Biotek Synergy HT) in kinetic analysis mode. Five independent experiments were done with three technical replicates for each treatment.
2.5.3. 2,2-Diphenyl-1-Picrylhydrazyl (DPPH) Radical Scavenging Assay
The method is based on the absorbance decrease of DPPH, which is a stable organic radical.
The measurement was conducted following the protocol described elsewhere [32,33], with some modifications. Briefly, 50µL of blank/standard/plant sample dilutions followed by 100µL of 200µM DPPH (dissolved in 96% ethanol) and 50µL of acetate buffer (100 mM, pH 5.5) were pipetted into 96-well general microplates. The absorbance changes were measured at 517 nm by a Perkin Elmer EnSpire Multimode plate reader (Perkin Elmer, Waltham, MA, USA) after 60 min incubation in the dark, at room temperature. The results were compared to serial dilutions of Trolox standard solution.
Five independent experiments were done with three technical replicates for each treatment.
2.5.4. Trolox Equivalent Antioxidant Capacity (TEAC) Assay
The technique is based on the generation of ABTS radical cation (ABTS•+) through the reaction between ABTS and potassium persulfate (K2S2O8). The method of Re et al. and Stratil et al. was adapted for the TEAC test with slight modification [34,35]. ABTS•+was produced by reaction of ABTS stock solution (7 mM of ABTS dissolved in distilled water) with 2.45 mM K2S2O8(final concentration) and diluted with PBS (pH 7.4) until the absorbance was 0.70±0.005 at 734 nm. Then 20µL aliquots of varying concentrations of the leaf extracts (50% ethanolic/aqueous) were allowed to react with 80µL of ABTS•+(7 mM) and the absorbance readings were recorded at 734 nm by the Perkin Elmer EnSpire Multimode plate reader after 20 min incubation in the dark, at room temperature. Trolox was used as standard. All measurements were carried out in five independent experiments with three technical replicates.
2.5.5. Calculation of Total Antioxidant Capacities (TAC)
For both the ORAC and ECL assays, the results were calculated as Trolox equivalents (TE). In the ORAC method the area under the fluorescence curve (AUC) of the blank was subtracted from that of the standard/sample (netAUC) and a calibration line was calculated for the netAUC of the Trolox standards. In the luminescence technique (ECL) the AUC of the emission curves vs. Trolox standards were used to calculate the calibration line. In both cases the samples’ TE values were obtained from the calibration curves which were then multiplied by the dilution factor and expressed asµM TE concentration. Finally, TAC was referred to 1 g of initial dry material for each plant sample.
For the DPPH and TEAC assays, the radical scavenging activity was expressed as IC50 (the concentration of the plant extract inµg/mL, required to scavenge 50% of DPPH or ABTS reactions), calculated by a linear regression curve made from the scavenging activities vs. amount of extracts of the samples. This means that the lower the IC50value of the sample is, the higher antioxidant activity it possesses.
Radical scavenging activity of the leaf extracts in % of the blank was obtained using the following formula:
Radical scavenging activity(% inhibition) = A0−A1 A0
!
×100 (1)
where A0is the absorbance of the blank and A1is the absorbance of the sample.
2.6. Cell Cultures
Mouse fibroblasts (3T3, ATCC: CRL-1658) were cultured in DMEM with high glucose (4500 mg/L), supplemented with 5% non-essential amino acids, 10% FBS, penicillin (100 U/mL) and streptomycin (100µg/mL), while the human epidermal immortalized keratinocyte cell line (HaCaT) was kindly provided by the laboratory of Prof. Tamás Bíró(Department of Immunology, Faculty of Medicine, University of Debrecen, Hungary). HaCaT cells were cultured in DMEM with high glucose (4500 mg/L), supplemented with 10% FBS, penicillin (100 U/mL) and streptomycin (100µg/mL) in 75 cm2cell culture flasks at 37◦C in a humidified atmosphere containing 5% CO2. In both cases, after reaching 80%
confluency, the cells were trypsinized and plated in 96-well/24-well/6-well sterile plastic plates.
2.7. Quantification of Intracellular ROS
Cellular oxidative stress due to the overproduction of reactive oxygen species (ROS) generated by AAPH was measured using the DCFH-DA and the DHR123 methods [36–38]. Trolox and quercetin were used as positive controls. The optimal conditions of DCFH-DA and DHR123 assays were as follows on 96-well culture plates: seeding density of 5×10⁴cells/mL, cell culture incubation time for overnight. After washing with PBS co-incubation in Hanks’ (5.5 mM glucose) with 50µM DCFH-DA or 10µM DHR123 and plant extract/quercetin/Trolox on 3T3/HaCaT cell cultures for 1 h was performed.
After removal of the treating medium and washing with PBS, 1 mM AAPH oxidant in Hanks’ glucose was added. The fluorescence intensity was recorded for 60 min on the Biotek microplate reader at 490/520 nm exc/em wavelengths at 37◦C. The radical scavenging activity was expressed as IC50 (the concentration of the plant sample (µg/mL), required to scavenge 50% of DCFH or DHR123 fluorescence), calculated by a linear regression analysis of the serial dilutions of the leaf extracts.
The radical scavenging activity was obtained using the following equation:
Radical scavenging activity(% inhibition) = AUC0−AUC1 AUC0
!
×100 (2)
where AUC0is the area under curve values of the blank and AUC1is the area under curve values of the sample. Five independent experiments were done with four technical replicates for each treatment.
2.8. Plate Reader Cytotoxicity Test
A multiparametric viability assay with one-step extraction was carried out following our previously published study without modifications to investigate the potential toxicity of 50% (v/v) ethanolic and aqueous leaf extracts [28]. A. vulnerariain 500–2500µg/mL concentrations (ethanolic extracts) and 4000–8000µg/mL concentrations (aqueous extracts) were tested. F. magellanicaandF. triphylla in 50–800µg/mL concentrations (ethanolic extracts) and 120–1000µg/mL concentrations (aqueous extracts) were examined. L. nummulariain 250–1500µg/mL concentrations (ethanolic extracts) and 3000–7000µg/mL concentrations (aqueous extracts) were investigated. The final concentration of the ethanolic solvent was restricted up to 1.5%v/vin the wells, which concentration does not affect the viability of the cells. Briefly, 3T3 and HaCaT cells were treated with various concentrations of the plant extracts for 24 h, after that ATP was measured from the cell lysates with the bioluminescence method.
Nucleic acid content was analyzed with PI staining, while intracellular proteins were quantified after fluorescent derivatization with fluorescamine. All results were expressed as mean±SD in percentage compared with data obtained for the controls (~100%). Five independent experiments were done with four technical replicates for each treatment and dose response curves were calculated from the measured data. The dose-response curves were obtained after DoseResp fitting by using the OriginLab Pro software (version 2016, OriginLab Corporation, Northampton, MA, USA).
2.9. Flow Cytometric Cytotoxicity Test
In the plate reader analysis, we could estimate the cytotoxicity in general, however, using flow cytometry it is possible to reveal the type of potential cell injury induced by the leaf extracts. For this sensitive method we used lower concentrations of the 50% (v/v) ethanolic extracts;A. vulnerariain 50, 100, 200µg/mL,F. magellanica andF. triphyllain 2.5, 5, 10µg/mL andL. nummulariain 10, 25, 50µg/mL concentrations, which were presumably sub-cytotoxic based on the plate reader viability assay. Experiments were carried out in three technical replicates on a BD Canto II cytometer (Becton, Dickinson and Company, Franklin Lakes, NJ, USA). Apoptotic, necrotic and late apoptotic cells were measured using Annexin V and 7-aminoactinomycin D (7AAD) staining. Annexin V was conjugated with fluorescein isothiocyanate (FITC) or Pacific Blue (PB), 7AAD was measured on the PerCP channel.
Annexin V single positivity marked the apoptotic cells, 7AAD labeled the necrotic cells, the double positive population meant the late apoptotic cells, while the double negative population was live. Since two labels were used in one sample, positivity was defined based on fluorescence minus one (FMO) controls—which were the single-stained ones. Compensation and analysis was carried out in FlowJo v.10 (FlowJo LLC., Ashland, OR, USA).
2.10. In Vitro “Wound Healing” Assay
The in vitro migration test was evaluated using culture inserts of 500µm width (Ibidi GmbH, Gräfelfing, Germany). Briefly, an insert with 2 wells was placed in 24-well sterile culture plates, and then keratinocytes and fibroblasts were seeded into the 2 wells of the culture insert. After cell attachment and production of a monolayer, the culture insert was removed, and cells were incubated for 24 h with different sub-cytotoxic doses of 50% (v/v) ethanolic extracts.A. vulnerariain 50, 100, 200µg/mL concentrations,F. magellanicaandF. triphyllain 2.5, 5, 10µg/mL concentrations andL. nummularia in 10, 25, 50µg/mL concentrations were investigated. PDGF-BB was used as positive control at 15 ng/mL concentration. Within the cell-free gap the cell migration was visualized at every 4 h for 24 h by time-lapse imaging in bright field, using phase-contrast microscopy (JuLi Stage Real-Time Cell History Recorder, NanoEnTek, Seoul, Korea). The gap was monitored at an objective magnification of 10×. The closure rate of the open cell-free area was determined by quantifying the micro photo density data obtained for every occasion from the very same loci with ImageJ 1.x processing software (https://imagej.nih.gov/ij/). The closure rate in % was calculated by the following formula:
Closure rate(%) = Open area0.h
−Open areax.h Open area0.h
!
×100 (3)
where “Open area0.h” is the cell-free area at the beginning of the experiment while “Open areax.h” is the still cell-free space at time points of imaging the samples. Finally, closure rate curves were constructed and the area under curve (AUC) for each treatment and cell line was calculated. The corresponding AUC data were averaged (±SD) and the summarized closure rates for the leaf extracts/PDGF were given in percentage (%) of the untreated controls. Three independent experiments were done with three technical replicates for each treatment.
2.11. Statistical Analyses
Where appropriate, data were expressed in % of the control samples, which were assumed to be ~100%. In the cytotoxicity plate reader assay correlation coefficients of each tested parameter were given for the dose-response curves. Statistical evaluation was carried out in the antioxidant assays using independent t-test, where the ethanolic and aqueous extracts were compared with each other, furthermore, in the migration assay using one-way ANOVA test, where the control and the sample data of one type of treatment were compared by SPSS software (IBM, SPSS Statistics, version 22, Armonk, NY, USA). In addition, principal component analysis (PCA) was also used to test the differences between the two types of extracts of four selected medicinal plants and four chemical
antioxidant assays. For PCA, prcomp function was used from the stats package within R (R Core Team 2019, version 3.6.1, Vienna, Austria). In all cases, the level of significance was set atp<0.05.
3. Results
3.1. Qualitative Analysis of Phenolic Compounds in Plant Extracts with LC-DAD-ESI-MS/MS
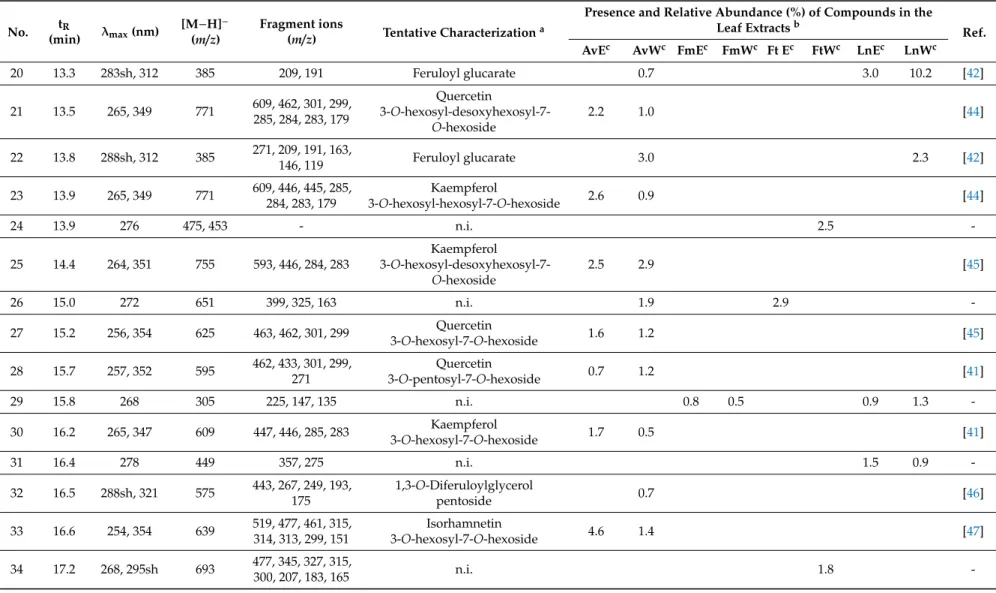
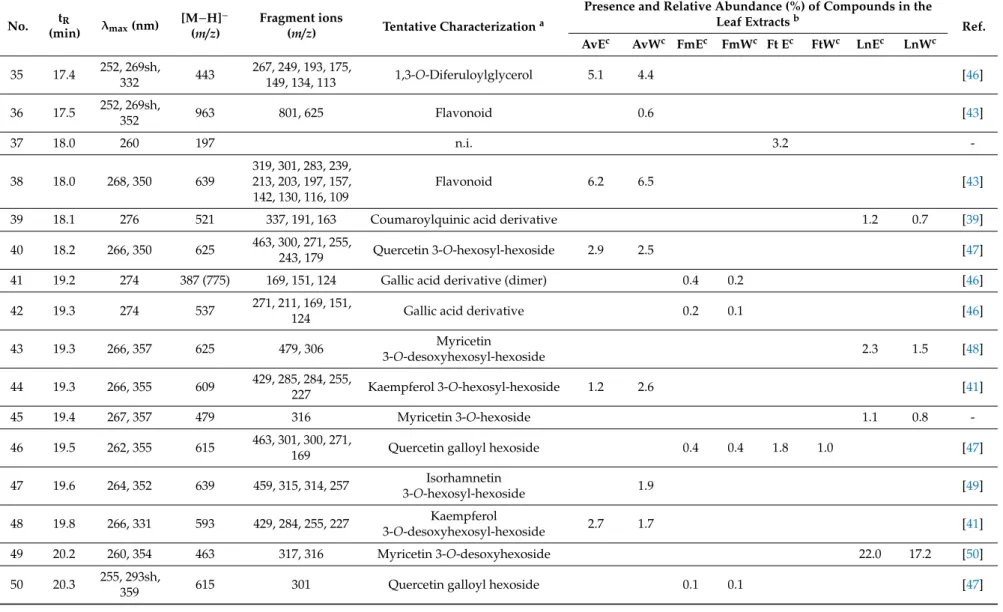
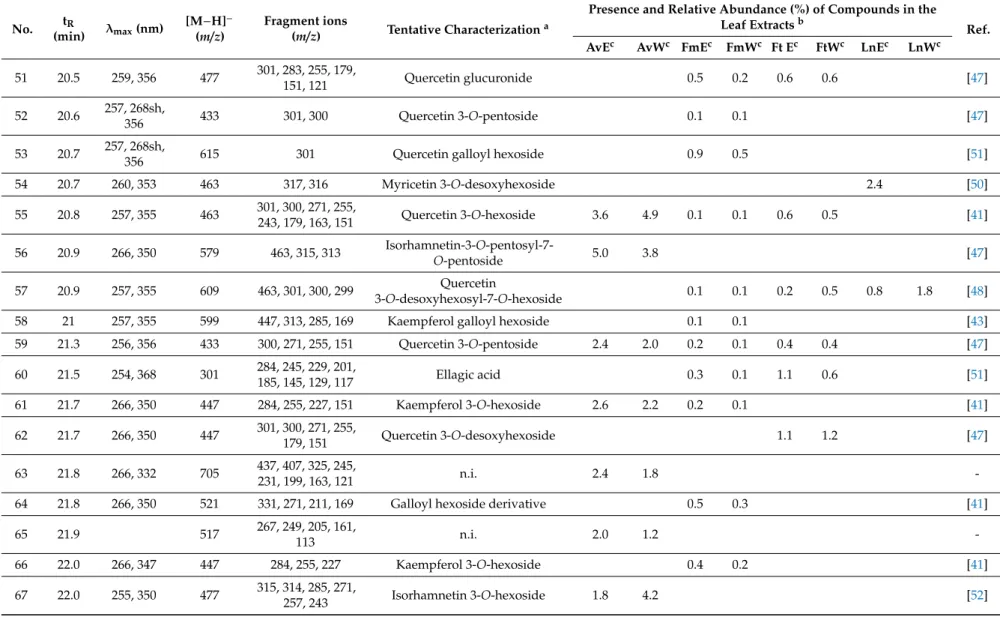
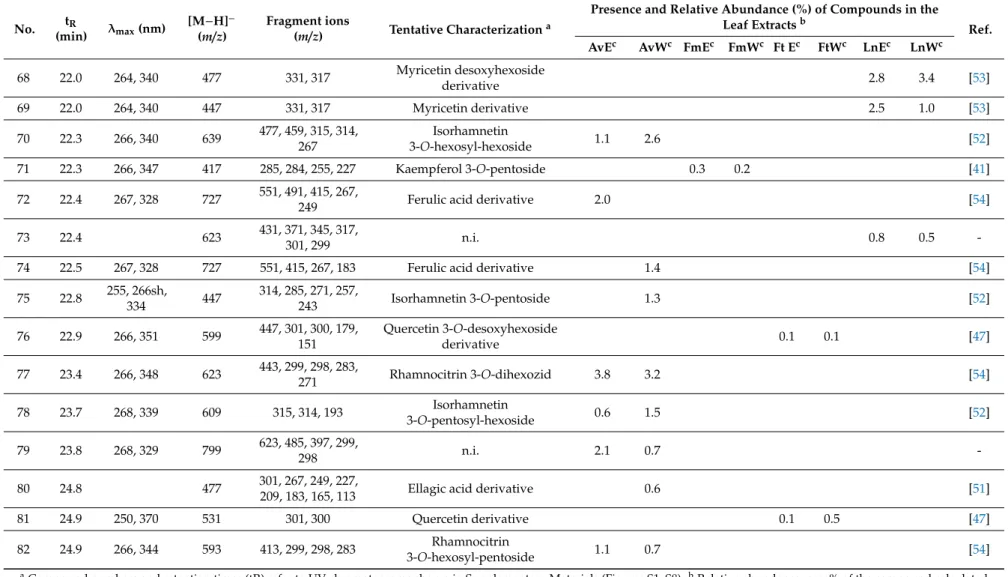
Aqueous and 50% (v/v) ethanolic extracts ofA. vulneraria,F. magellanica,F. triphyllaandL. nummularia were studied using LC-DAD-ESI-MS/MS methods, in order to characterize the constituents responsible for the biological actions. Eighty-two gallic acid derivatives, hydroxycinnamic acid derivatives and flavonoid glycosides were detected altogether in the samples; moreover, eight anthocyanins were described inFuchsiasamples. Compounds were tentatively characterized by comparing their chromatographic behaviors, UV spectra and mass spectrometric fragmentation patterns with data from the literature. In order to provide semi-quantitative results regarding the quantities of the constituents, their relative abundance (%) was calculated according to the summarized areas of all the compounds that were detected in the UV (280 nm) chromatogram of the sample. Results are presented in Tables1and2, UV chromatograms (280 nm) of the extracts are shown in Supplementary Material (Figures S1–S8).
Flavonol glycosides prevailed inA. vulnerariasamples with compounds bearing the aglycone moieties kaempferol (e.g., compounds23and25) and quercetin (e.g.,40), as well as methoxylated aglycone moieties isorhamnetin (e.g.,33) and rhamnocitrin (e.g.,77). In addition, the aqueous extract comprised diverse caffeoyl (e.g.,5,8), coumaroyl (e.g.,7,10) and feruloyl acid derivatives (e.g.,20,22).
L. nummularia also contained flavonol glycosides in high amounts, however, the samples were dominated by the presence of myricetin glycosides (e.g., 43, 45, 68, 69) with myricetin 3-O-desoxyhexoside (49) as the main compound detected in both the aqueous and 50% (v/v) ethanolic extracts, and other aglycones were hardly found. For the aqueous samples, occurrence of coumaroyl (7,14,15) and feruloyl glucarate (18,20,22) isomers was characteristic.
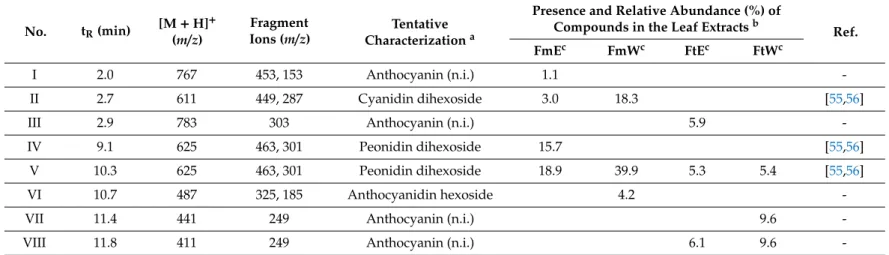
Unusual quercetin galloyl hexosides (46,50,53) and a kaempferol galloyl hexoside (58) were detected inFuchsiasamples and primarily inF. magellanica.Even if anthocyanins were predominant, a peonidin dihexoside isomer (V) was present in eachFuchsiasample, while cyanidin dihexoside (II) was described only inF. magellanicaextracts.
The compound analyses data are summarized in dendrograms for the ethanolic and aqueous leaf extracts separately in Figures S9 and S10 (Supplementary Material).
Table 1. LC-MS/MS data and tentative characterization of compounds fromAnthyllis vulneraria, Fuchsia magellanica, Fuchsia triphyllaandLysimachia nummularia leaf extracts.
No. tR
(min) λmax(nm) [M−H]− (m/z)
Fragment ions
(m/z) Tentative Characterizationa
Presence and Relative Abundance (%) of Compounds in the
Leaf Extractsb Ref.
AvEc AvWc FmEc FmWc Ft Ec FtWc LnEc LnWc
1 2.0 315 343 179, 135 Caffeic acid derivative 0.1 [39]
2 2.2 306 533, 375, 217, 173, 149 Cinnamoylquinic acid derivative 0.3 [39]
3 2.5 315 341 (683) 179, 149, 135 Caffeoyl-O-hexoside (dimer) 0.2 0.3 0.2 [40]
4 2.6 265, 312 337 267, 191, 163, 149,
135 5-p-Coumaroylquinic acid 0.2 0.1 0.1 [39]
5 3.2 288sh, 311 639, 353 191 Caffeoylquinic acid derivative 0.3 0.9 [39]
6 7.1 272 331 169, 125 Galloyl hexoside 0.2 0.2 [41]
7 9.5 311 355 191 Coumaroyl glucarate isomer 0.1 2.9 [42]
8 10.1 298sh, 320 371 209, 191, 179 Caffeoylquinic acid derivative 0.5 [39]
9 10.5 260 611 305 n.i. 2.0 1.8 -
10 10.5 298, 310 355 209, 191, 163 Coumaroyl glucarate isomer 0.5 1.3 [42]
11 10.6 298, 320 549 387, 369, 267, 249,
137 Cinnamic acid derivative 0.3 [43]
12 10.6 298 331 169, 125 Galloyl hexoside 2.6 [41]
13 10.9 300 301 168, 150, 125 Galloyl pentoside 0.2 [41]
14 11.9 282sh, 307 355 (711) 271, 209, 191 Coumaroyl glucarate isomer
(dimer) 3.4 [42]
15 12.6 283sh, 312 355 271, 209, 191 Coumaroyl glucarate isomer 1.9 5.0 6.9 [42]
16 13.0 290, 328sh 297, (595) 179, 161, 135 Caffeic acid derivative (dimer) 2.0 2.4 4.0 [39]
17 13.0 296 575 413, 351, 267, 249,
163, 113 Coumaric acid derivative 0.5 [39]
18 13.1 310 385 209, 191 Feruloyl glucarate 2.2 3.9 [42]
19 13.2 255, 350 787 625, 462, 301, 299 Quercetin
3-O-hexosyl-hexosyl-7-O-hexoside 1.0 [44]
Table 1.Cont.
No. tR
(min) λmax(nm) [M−H]−
(m/z) Fragment ions
(m/z) Tentative Characterizationa
Presence and Relative Abundance (%) of Compounds in the
Leaf Extractsb Ref.
AvEc AvWc FmEc FmWc Ft Ec FtWc LnEc LnWc
20 13.3 283sh, 312 385 209, 191 Feruloyl glucarate 0.7 3.0 10.2 [42]
21 13.5 265, 349 771 609, 462, 301, 299, 285, 284, 283, 179
Quercetin
3-O-hexosyl-desoxyhexosyl-7- O-hexoside
2.2 1.0 [44]
22 13.8 288sh, 312 385 271, 209, 191, 163,
146, 119 Feruloyl glucarate 3.0 2.3 [42]
23 13.9 265, 349 771 609, 446, 445, 285, 284, 283, 179
Kaempferol
3-O-hexosyl-hexosyl-7-O-hexoside 2.6 0.9 [44]
24 13.9 276 475, 453 - n.i. 2.5 -
25 14.4 264, 351 755 593, 446, 284, 283
Kaempferol
3-O-hexosyl-desoxyhexosyl-7- O-hexoside
2.5 2.9 [45]
26 15.0 272 651 399, 325, 163 n.i. 1.9 2.9 -
27 15.2 256, 354 625 463, 462, 301, 299 Quercetin
3-O-hexosyl-7-O-hexoside 1.6 1.2 [45]
28 15.7 257, 352 595 462, 433, 301, 299, 271
Quercetin
3-O-pentosyl-7-O-hexoside 0.7 1.2 [41]
29 15.8 268 305 225, 147, 135 n.i. 0.8 0.5 0.9 1.3 -
30 16.2 265, 347 609 447, 446, 285, 283 Kaempferol
3-O-hexosyl-7-O-hexoside 1.7 0.5 [41]
31 16.4 278 449 357, 275 n.i. 1.5 0.9 -
32 16.5 288sh, 321 575 443, 267, 249, 193, 175
1,3-O-Diferuloylglycerol
pentoside 0.7 [46]
33 16.6 254, 354 639 519, 477, 461, 315, 314, 313, 299, 151
Isorhamnetin
3-O-hexosyl-7-O-hexoside 4.6 1.4 [47]
34 17.2 268, 295sh 693 477, 345, 327, 315,
300, 207, 183, 165 n.i. 1.8 -
Table 1.Cont.
No. tR
(min) λmax(nm) [M−H]−
(m/z) Fragment ions
(m/z) Tentative Characterizationa
Presence and Relative Abundance (%) of Compounds in the
Leaf Extractsb Ref.
AvEc AvWc FmEc FmWc Ft Ec FtWc LnEc LnWc 35 17.4 252, 269sh,
332 443 267, 249, 193, 175,
149, 134, 113 1,3-O-Diferuloylglycerol 5.1 4.4 [46]
36 17.5 252, 269sh,
352 963 801, 625 Flavonoid 0.6 [43]
37 18.0 260 197 n.i. 3.2 -
38 18.0 268, 350 639
319, 301, 283, 239, 213, 203, 197, 157, 142, 130, 116, 109
Flavonoid 6.2 6.5 [43]
39 18.1 276 521 337, 191, 163 Coumaroylquinic acid derivative 1.2 0.7 [39]
40 18.2 266, 350 625 463, 300, 271, 255,
243, 179 Quercetin 3-O-hexosyl-hexoside 2.9 2.5 [47]
41 19.2 274 387 (775) 169, 151, 124 Gallic acid derivative (dimer) 0.4 0.2 [46]
42 19.3 274 537 271, 211, 169, 151,
124 Gallic acid derivative 0.2 0.1 [46]
43 19.3 266, 357 625 479, 306 Myricetin
3-O-desoxyhexosyl-hexoside 2.3 1.5 [48]
44 19.3 266, 355 609 429, 285, 284, 255,
227 Kaempferol 3-O-hexosyl-hexoside 1.2 2.6 [41]
45 19.4 267, 357 479 316 Myricetin 3-O-hexoside 1.1 0.8 -
46 19.5 262, 355 615 463, 301, 300, 271,
169 Quercetin galloyl hexoside 0.4 0.4 1.8 1.0 [47]
47 19.6 264, 352 639 459, 315, 314, 257 Isorhamnetin
3-O-hexosyl-hexoside 1.9 [49]
48 19.8 266, 331 593 429, 284, 255, 227 Kaempferol
3-O-desoxyhexosyl-hexoside 2.7 1.7 [41]
49 20.2 260, 354 463 317, 316 Myricetin 3-O-desoxyhexoside 22.0 17.2 [50]
50 20.3 255, 293sh,
359 615 301 Quercetin galloyl hexoside 0.1 0.1 [47]
Table 1.Cont.
No. tR
(min) λmax(nm) [M−H]−
(m/z) Fragment ions
(m/z) Tentative Characterizationa
Presence and Relative Abundance (%) of Compounds in the
Leaf Extractsb Ref.
AvEc AvWc FmEc FmWc Ft Ec FtWc LnEc LnWc 51 20.5 259, 356 477 301, 283, 255, 179,
151, 121 Quercetin glucuronide 0.5 0.2 0.6 0.6 [47]
52 20.6 257, 268sh,
356 433 301, 300 Quercetin 3-O-pentoside 0.1 0.1 [47]
53 20.7 257, 268sh,
356 615 301 Quercetin galloyl hexoside 0.9 0.5 [51]
54 20.7 260, 353 463 317, 316 Myricetin 3-O-desoxyhexoside 2.4 [50]
55 20.8 257, 355 463 301, 300, 271, 255,
243, 179, 163, 151 Quercetin 3-O-hexoside 3.6 4.9 0.1 0.1 0.6 0.5 [41]
56 20.9 266, 350 579 463, 315, 313 Isorhamnetin-3-O-pentosyl-7-
O-pentoside 5.0 3.8 [47]
57 20.9 257, 355 609 463, 301, 300, 299 Quercetin
3-O-desoxyhexosyl-7-O-hexoside 0.1 0.1 0.2 0.5 0.8 1.8 [48]
58 21 257, 355 599 447, 313, 285, 169 Kaempferol galloyl hexoside 0.1 0.1 [43]
59 21.3 256, 356 433 300, 271, 255, 151 Quercetin 3-O-pentoside 2.4 2.0 0.2 0.1 0.4 0.4 [47]
60 21.5 254, 368 301 284, 245, 229, 201,
185, 145, 129, 117 Ellagic acid 0.3 0.1 1.1 0.6 [51]
61 21.7 266, 350 447 284, 255, 227, 151 Kaempferol 3-O-hexoside 2.6 2.2 0.2 0.1 [41]
62 21.7 266, 350 447 301, 300, 271, 255,
179, 151 Quercetin 3-O-desoxyhexoside 1.1 1.2 [47]
63 21.8 266, 332 705 437, 407, 325, 245,
231, 199, 163, 121 n.i. 2.4 1.8 -
64 21.8 266, 350 521 331, 271, 211, 169 Galloyl hexoside derivative 0.5 0.3 [41]
65 21.9 517 267, 249, 205, 161,
113 n.i. 2.0 1.2 -
66 22.0 266, 347 447 284, 255, 227 Kaempferol 3-O-hexoside 0.4 0.2 [41]
67 22.0 255, 350 477 315, 314, 285, 271,
257, 243 Isorhamnetin 3-O-hexoside 1.8 4.2 [52]
Table 1.Cont.
No. tR
(min) λmax(nm) [M−H]−
(m/z) Fragment ions
(m/z) Tentative Characterizationa
Presence and Relative Abundance (%) of Compounds in the
Leaf Extractsb Ref.
AvEc AvWc FmEc FmWc Ft Ec FtWc LnEc LnWc
68 22.0 264, 340 477 331, 317 Myricetin desoxyhexoside
derivative 2.8 3.4 [53]
69 22.0 264, 340 447 331, 317 Myricetin derivative 2.5 1.0 [53]
70 22.3 266, 340 639 477, 459, 315, 314, 267
Isorhamnetin
3-O-hexosyl-hexoside 1.1 2.6 [52]
71 22.3 266, 347 417 285, 284, 255, 227 Kaempferol 3-O-pentoside 0.3 0.2 [41]
72 22.4 267, 328 727 551, 491, 415, 267,
249 Ferulic acid derivative 2.0 [54]
73 22.4 623 431, 371, 345, 317,
301, 299 n.i. 0.8 0.5 -
74 22.5 267, 328 727 551, 415, 267, 183 Ferulic acid derivative 1.4 [54]
75 22.8 255, 266sh,
334 447 314, 285, 271, 257,
243 Isorhamnetin 3-O-pentoside 1.3 [52]
76 22.9 266, 351 599 447, 301, 300, 179, 151
Quercetin 3-O-desoxyhexoside
derivative 0.1 0.1 [47]
77 23.4 266, 348 623 443, 299, 298, 283,
271 Rhamnocitrin 3-O-dihexozid 3.8 3.2 [54]
78 23.7 268, 339 609 315, 314, 193 Isorhamnetin
3-O-pentosyl-hexoside 0.6 1.5 [52]
79 23.8 268, 329 799 623, 485, 397, 299,
298 n.i. 2.1 0.7 -
80 24.8 477 301, 267, 249, 227,
209, 183, 165, 113 Ellagic acid derivative 0.6 [51]
81 24.9 250, 370 531 301, 300 Quercetin derivative 0.1 0.5 [47]
82 24.9 266, 344 593 413, 299, 298, 283 Rhamnocitrin
3-O-hexosyl-pentoside 1.1 0.7 [54]
aCompound numbers and retention times (tR) refer to UV chromatograms shown in Supplementary Materials (Figures S1–S8).bRelative abundance: area% of the compound calculated from the summarized areas of all compounds detected in the UV (280 nm) chromatogram.cAbbreviations: AvE:Anthyllis vulneraria50% (v/v) ethanolic extract, AvW:Anthyllis vulneraria aqueous extract, FmE:Fuchsia magellanica50% (v/v) ethanolic extract, FmW:Fuchsia magellanicaaqueous extract, FtE:Fuchsia triphyllaethanolic extract, FtW:Fuchsia triphyllaaqueous extract, LnE:Lysimachia nummularia50% (v/v) ethanolic extract, LnW:Lysimachia nummulariaaqueous extract, n.i.: not identified.
Table 2.LC-MS/MS data and tentative characterization of anthocyanins fromFuchsia magellanicaandFuchsia triphyllaleaf extracts.
No. tR(min) [M+H]+ (m/z)
Fragment
Ions (m/z) Tentative Characterizationa
Presence and Relative Abundance (%) of
Compounds in the Leaf Extractsb Ref.
FmEc FmWc FtEc FtWc
I 2.0 767 453, 153 Anthocyanin (n.i.) 1.1 -
II 2.7 611 449, 287 Cyanidin dihexoside 3.0 18.3 [55,56]
III 2.9 783 303 Anthocyanin (n.i.) 5.9 -
IV 9.1 625 463, 301 Peonidin dihexoside 15.7 [55,56]
V 10.3 625 463, 301 Peonidin dihexoside 18.9 39.9 5.3 5.4 [55,56]
VI 10.7 487 325, 185 Anthocyanidin hexoside 4.2 -
VII 11.4 441 249 Anthocyanin (n.i.) 9.6 -
VIII 11.8 411 249 Anthocyanin (n.i.) 6.1 9.6 -
aCompound numbers and retention times (tR) refer to UV chromatograms shown in Supplementary Materials (Figures S3–S6).bRelative abundance: area% of the compound calculated from the summarized areas of all compounds detected in the UV (280 nm) chromatogram.cAbbreviations: FmE:Fuchsia magellanica50% (v/v) ethanolic extract, FmW:Fuchsia magellanica aqueous extract, FtE:Fuchsia triphylla50% (v/v) ethanolic extract, FtW:Fuchsia triphyllaaqueous extract.
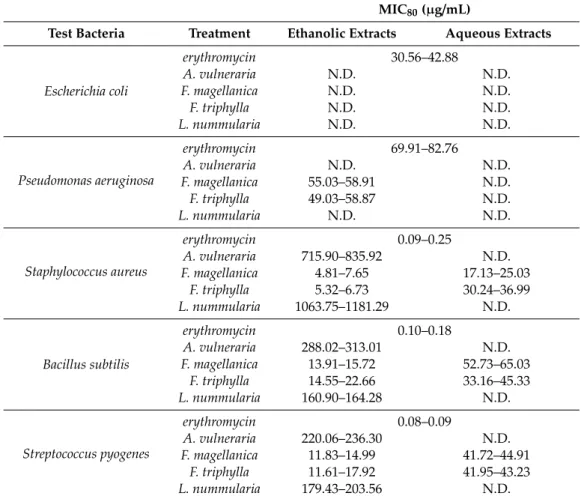
3.2. Determination of Minimum Inhibitory Concentration (MIC80)
The effects of leaf extracts on Gram-positive and Gram-negative bacteria were determined by CLSI M07-A9 (Vol. 32, No. 2) guidelines (Table3). For this study, Minimum Inhibitory Concentration (MIC80) values under 100µg/mL were considered to indicate good antimicrobial activity; from 500 to 100µg/mL to show moderate antimicrobial activity; from 1000 to 500 µg/mL to point to weak antimicrobial activity; and over 1000µg/mL to indicate inactivity.
The ethanolic extracts ofFuchsiaspecies were considered to have good antibacterial activities (MIC80values were between 5 and 60µg/mL concentrations) onS. aureus,B. subtilis, S. pyogenesand P. aeruginosa, compared with erythromycin, where the MIC80 values were between 0.1–42µg/mL concentrations. Ethanolic extracts ofA. vulnerariaandL. nummulariashowed moderate antimicrobial activity onB. subtilisandS. pyogenes, andA. vulneraiapointed to weak antimicrobial activity onS. aureus.
Interestingly, only the aqueous extracts ofFuchsiaspp. of the tested plants indicated a remarkably good influence onS. aureus, B. subtilisand S. pyogenes (MIC80 values between 17 and 65µg/mL concentrations). The plant extracts did not have an antibacterial effect onE. coli.
Table 3.Minimum inhibitory concentration (MIC80) of selected medicinal plant extracts onE. coli,P.
aeruginosa,S. aureus,B. subtilisandS. pyogenes.
MIC80(µg/mL)
Test Bacteria Treatment Ethanolic Extracts Aqueous Extracts
Escherichia coli
erythromycin 30.56–42.88
A. vulneraria N.D. N.D.
F. magellanica N.D. N.D.
F. triphylla N.D. N.D.
L. nummularia N.D. N.D.
Pseudomonas aeruginosa
erythromycin 69.91–82.76
A. vulneraria N.D. N.D.
F. magellanica 55.03–58.91 N.D.
F. triphylla 49.03–58.87 N.D.
L. nummularia N.D. N.D.
Staphylococcus aureus
erythromycin 0.09–0.25
A. vulneraria 715.90–835.92 N.D.
F. magellanica 4.81–7.65 17.13–25.03
F. triphylla 5.32–6.73 30.24–36.99
L. nummularia 1063.75–1181.29 N.D.
Bacillus subtilis
erythromycin 0.10–0.18
A. vulneraria 288.02–313.01 N.D.
F. magellanica 13.91–15.72 52.73–65.03
F. triphylla 14.55–22.66 33.16–45.33
L. nummularia 160.90–164.28 N.D.
Streptococcus pyogenes
erythromycin 0.08–0.09
A. vulneraria 220.06–236.30 N.D.
F. magellanica 11.83–14.99 41.72–44.91
F. triphylla 11.61–17.92 41.95–43.23
L. nummularia 179.43–203.56 N.D.
Five independent experiments, each in three replicates, compared with erythromycin as positive control. N.D.:
not detected.
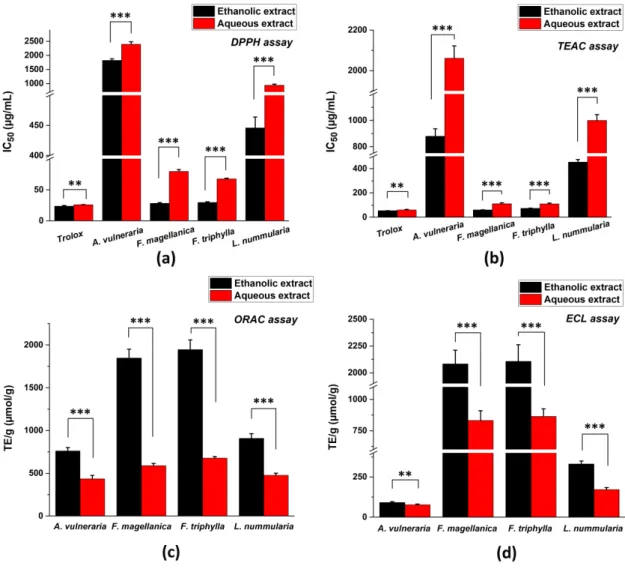
3.3. Total Antioxidant Capacity (TAC) Assays
The antioxidant properties of ethanolic and aqueous extracts of the investigated plants were evaluated by conventional chemical assays such as DPPH, TEAC, ORAC, and ECL methods (Figure1).
The lowest IC50values indicate the highest antioxidant effect with DPPH and TEAC scavenging activity tests, while the highest TE/g values mean the strongest antioxidant capacity in case of ORAC and
Antioxidants2020,9, 166 16 of 29
ECL assays. Generally, the ethanolic extracts showed higher antioxidant effect than aqueous extracts.
Altogether, the ethanolic and aqueous extracts ofFuchsiaspecies had the strongest antioxidant activity followed byLysimachia nummulariaandAnthyllis vulnerariain all methods.
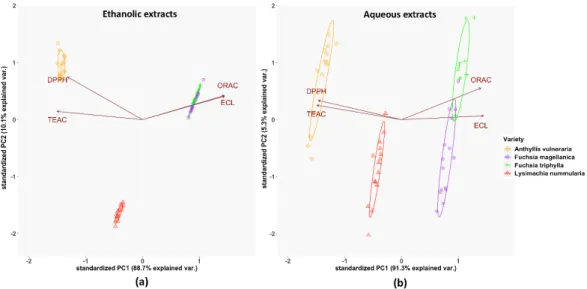
The results of Principal Component Analysis (PCA) are shown in Figure2. In the case of ethanolic extracts, a strong positive correlation was observed between the ORAC and ECL methods, while a moderate correlation existed between the data of TEAC and DPPH assays. These relationships were opposite to the results of aqueous extracts because of their stronger correlation between TEAC and DPPH methods than ECL and ORAC tests. The ethanolic extracts ofFuchsiaspecies were more similar to each other than in the case of their aqueous extracts.
3.3. Total Antioxidant Capacity (TAC) Assays
The antioxidant properties of ethanolic and aqueous extracts of the investigated plants were evaluated by conventional chemical assays such as DPPH, TEAC, ORAC, and ECL methods (Figure 1). The lowest IC50 values indicate the highest antioxidant effect with DPPH and TEAC scavenging activity tests, while the highest TE/g values mean the strongest antioxidant capacity in case of ORAC and ECL assays. Generally, the ethanolic extracts showed higher antioxidant effect than aqueous extracts. Altogether, the ethanolic and aqueous extracts of Fuchsia species had the strongest antioxidant activity followed by Lysimachia nummularia and Anthyllis vulneraria in all methods.
The results of Principal Component Analysis (PCA) are shown in Figure 2. In the case of ethanolic extracts, a strong positive correlation was observed between the ORAC and ECL methods, while a moderate correlation existed between the data of TEAC and DPPH assays. These relationships were opposite to the results of aqueous extracts because of their stronger correlation between TEAC and DPPH methods than ECL and ORAC tests. The ethanolic extracts of Fuchsia species were more similar to each other than in the case of their aqueous extracts.
Figure 1. Total antioxidant capacity (TAC) of four selected medicinal plants measured by different spectroscopic methods: (a) DPPH assay; (b) TEAC assay; (c) ORAC assay and (d) ECL assay. IC50 values (in µg/mL concentration at 50% inhibition) were calculated in case of DPPH and TEAC methods, while TE/g values (Trolox equivalent in µmol referred to 1 g of initial dry material) were determined in case of ORAC and ECL tests. Mean ± SD of 5 independent experiments, each in 3 replicates. The aqueous and ethanolic extracts were compared with t-probe (** p < 0.01, *** p < 0.001).
Figure 1. Total antioxidant capacity (TAC) of four selected medicinal plants measured by different spectroscopic methods: (a) DPPH assay; (b) TEAC assay; (c) ORAC assay and (d) ECL assay. IC50values (inµg/mL concentration at 50% inhibition) were calculated in case of DPPH and TEAC methods, while TE/g values (Trolox equivalent inµmol referred to 1 g of initial dry material) were determined in case of ORAC and ECL tests. Mean±SD of 5 independent experiments, each in 3 replicates. The aqueous and ethanolic extracts were compared with t-probe (**p<0.01, ***p<0.001).
Antioxidants 2020, 9, x FOR PEER REVIEW 17 of 29
Figure 2. PCA analysis of the investigated plant species’ total antioxidant capacity by four independent methods: (a) in the ethanolic extracts, (b) in the aqueous solutions, based on the antioxidant activities. % of total variance explained by each axis is provided within the figure. The symbols indicate 15 individual data for each plant extract.
3.4. Inhibition of Intracellular ROS Production
The oxidation of DCFH and DHR was generated by peroxyl radicals from AAPH in 3T3 and in HaCaT cells [57]. The leaf extracts decreased the fluorescence of DCF and the calculated 50%
inhibition values are shown in Figure 3. Ethanolic and aqueous extracts of Fuchsia species had the strongest inhibition in both cell lines, compared with other plant extracts. However, no antioxidant activity was detected for A. vulneraria in the case of 3T3 cells, and only ethanolic extracts of A.
vulneraria showed measurable antioxidant property on HaCaT cell culture.
The generation of fluorescence signal from the rhodamine derivative was also decreased by the plant extracts and the calculated 50% inhibition values are shown in Figure 4. Both solvent fractions of Fuchsia spp. exerted the highest inhibition of the fluorescence intensity of rhodamine. Although ethanolic and aqueous extracts of A. vulneraria could be quantified, the aqueous fraction had only weak effectivity (at around the detection limit).
Figure 3. Intracellular antioxidant capacities of studied plant extracts with DCFH-DA staining (a) in 3T3 fibroblast cells and (b) in HaCaT keratinocyte cells. IC50 inhibitory concentrations were calculated from the equations obtained for the inhibitory capacities of the serial dilutions of the extracts. In the case of A. vulneraria the DCFH-DA scavenging activity data (when not shown) were at around/below the detection limit. Mean ± SD of five independent experiments, n = 5 × 4 replicates for Figure 2.PCA analysis of the investigated plant species’ total antioxidant capacity by four independent methods: (a) in the ethanolic extracts, (b) in the aqueous solutions, based on the antioxidant activities. % of total variance explained by each axis is provided within the figure. The symbols indicate 15 individual data for each plant extract.
3.4. Inhibition of Intracellular ROS Production
The oxidation of DCFH and DHR was generated by peroxyl radicals from AAPH in 3T3 and in HaCaT cells [57]. The leaf extracts decreased the fluorescence of DCF and the calculated 50% inhibition values are shown in Figure3. Ethanolic and aqueous extracts ofFuchsiaspecies had the strongest inhibition in both cell lines, compared with other plant extracts. However, no antioxidant activity was detected forA. vulnerariain the case of 3T3 cells, and only ethanolic extracts ofA. vulnerariashowed measurable antioxidant property on HaCaT cell culture.
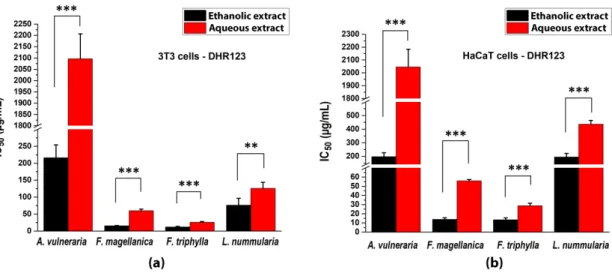
The generation of fluorescence signal from the rhodamine derivative was also decreased by the plant extracts and the calculated 50% inhibition values are shown in Figure4. Both solvent fractions ofFuchsiaspp. exerted the highest inhibition of the fluorescence intensity of rhodamine. Although ethanolic and aqueous extracts ofA. vulnerariacould be quantified, the aqueous fraction had only weak effectivity (at around the detection limit).
Antioxidants 2020, 9, x FOR PEER REVIEW 17 of 29
Figure 2. PCA analysis of the investigated plant species’ total antioxidant capacity by four independent methods: (a) in the ethanolic extracts, (b) in the aqueous solutions, based on the antioxidant activities. % of total variance explained by each axis is provided within the figure. The symbols indicate 15 individual data for each plant extract.
3.4. Inhibition of Intracellular ROS Production
The oxidation of DCFH and DHR was generated by peroxyl radicals from AAPH in 3T3 and in HaCaT cells [57]. The leaf extracts decreased the fluorescence of DCF and the calculated 50%
inhibition values are shown in Figure 3. Ethanolic and aqueous extracts of Fuchsia species had the strongest inhibition in both cell lines, compared with other plant extracts. However, no antioxidant activity was detected for A. vulneraria in the case of 3T3 cells, and only ethanolic extracts of A.
vulneraria showed measurable antioxidant property on HaCaT cell culture.
The generation of fluorescence signal from the rhodamine derivative was also decreased by the plant extracts and the calculated 50% inhibition values are shown in Figure 4. Both solvent fractions of Fuchsia spp. exerted the highest inhibition of the fluorescence intensity of rhodamine. Although ethanolic and aqueous extracts of A. vulneraria could be quantified, the aqueous fraction had only weak effectivity (at around the detection limit).
Figure 3. Intracellular antioxidant capacities of studied plant extracts with DCFH-DA staining (a) in 3T3 fibroblast cells and (b) in HaCaT keratinocyte cells. IC50 inhibitory concentrations were calculated from the equations obtained for the inhibitory capacities of the serial dilutions of the extracts. In the case of A. vulneraria the DCFH-DA scavenging activity data (when not shown) were at around/below the detection limit. Mean ± SD of five independent experiments, n = 5 × 4 replicates for Figure 3.Intracellular antioxidant capacities of studied plant extracts with DCFH-DA staining (a) in 3T3 fibroblast cells and (b) in HaCaT keratinocyte cells. IC50inhibitory concentrations were calculated from the equations obtained for the inhibitory capacities of the serial dilutions of the extracts. In the case ofA. vulnerariathe DCFH-DA scavenging activity data (when not shown) were at around/below the detection limit. Mean±SD of five independent experiments,n=5×4 replicates for each concentration.
The aqueous and ethanolic extracts were compared with t-probe (**p<0.01, ***p<0.001).