Criteria of Protein Nutrition
ANTHONY A. ALBANESE
Nutritional Research Laboratory, St. Luke's Convalescent Hospital, Greenwich, Connecticut
Page
I. Anthropometry 297 A. Standards 299 B. Body Composition 300
C. Summary 303 II. Blood Proteins 304
A. Biosynthesis and Dietary Protein Quality 305 B. Blood Protein Levels and Dietary Intake 309
C. Summary 311 III. Nitrogen Balance 312
A. Theory 312 B. Experimental Data 314
C. Depletion States 319 D. Summary 322 IV. Other Methods 323
A. Creatinine Excretion 323 B. Plasma Amino Nitrogen 326 C. Specific Plasma Amino Acids 330 D. Urinary Amino Acids 333 E. Enzyme Levels 334 F. Metabolic Rates 337 G. Appetite 341 H. Summary 342 References 343
I. ANTHROPOMETRY
The earliest surveys of nutritional status were the recordings of body weight correlated with height, age, and sex. Originally, these had an urgency of actuarial interest in the relationship between weight and the prognosis for morbidity from tuberculosis. In time, other chronic dis- orders came to be related to these same data. In our times, much has been made of the correlation of obesity in adults with the incidence of diabetes and cardiovascular diseases (Marks, 1956). Substandard growth and development in children has been found to be associated with diabetes (Jackson and Kelly, 1945), active allergies (Cohen and Abram, 1948), rheumatic fever (Higgons et al., 1951), and emotional stress (Fried and Mayer, 1948).
Anthropometry has provided many correlations with racial or geo- 297
graphical or economic background. It is generally agreed that nutrition and dietary habits or customs play an important role in these correlates.
Limited intake of good quality proteins has long been held responsible for the occurrence of substandard anthropometric patterns. This is par- ticularly true if we consider the view held by some that low intake of protein in countries like China and India (in contrast to Australia and the United States, where protein consumption is high) is responsible for existing differences in stature, longevity, and general health (Alba- nese, 1956a). For example, life expectancy in Australia and the United States was about twice that of the populations of China and India
(Table I). Recent improvements in sanitation and medical care have
TABLE I
RELATION OF NATIONAL DIETS TO STATURE AND LONGEVITY0
Total calories per day Livestock, % calories
Cereals and potatoes, % calories Total protein intake, gm. per Animal protein, per cent Average height, cm.
Average weight, kg.
Life expectancy, yr.
Total calories per gram of protein intake
day
Australia 3128 40-45 30-40 65 90 172 77.2
65 35
States 3249 35-40 30-40 88. 57 170 70.0
64 37
China 2201 70-80 1-5 68 7 158 54.3
30 32
India 2021 5-10 60-70 56 16 161 50.0
27 36
a From Albanese (1956a).
shown that these are important factors in longevity (U.N. Secretariat, 1958). However, it is well known and amply supported by statistical evidence that racial differences with regard to height and weight change readily with an improved nutritional environment. Many evidences of this phenomenon in native populations of Africa and Asia have been presented also by Flodin (1953).
The occurrence of nutritionally related changes in anthropometry is indicated by examination of some of our own vital statistics. It is generally conceded that, compared with those of other countries, diets in the United States are generous, and that the range in variety of food products is unusually large. Improvements in stature and body build among immigrants to the United States have been attributed statistically to the better diets obtainable here. To wit, the second generation of Japanese in California and of Central Europeans in the large American cities are of larger stature and better physique than their parents. At the same time, American women entering colleges are found to average
more than an inch taller than those in the same colleges thirty years ago.
The average stature of Harvard men has increased about two inches in the last sixty years.
A. STANDARDS
Figures on the relationship between body weight and other body measurements of North American adults go back scarcely a century.
According to Marks (1956), the first table prepared in 1897 was based upon 74,162 male applicants accepted for life insurance in the United States and Canada. The first extensive tables for women appeared in 1908 and were based upon measurements of about 60,000 cases insured in the previous decade. Such data collected at irregular intervals since those years indicate that average weights, specific for height and age, were fairly stable over long periods except as noted above at the younger ages. Mortality and morbidity statistics suggest that the standards of weight long in vogue in this country, and still widely used, are too generous. A new study of life insurance experience, now under way, will provide the basis of new standards.
Growth patterns are frequently employed in the evaluation of the quantitative and qualitative nutrient needs of children. To expedite and quantitate these evaluations, it is helpful for the investigator to have a graph or table showing the norms of growth for infants and children.
Several compilations are now in use in this country. Wetzel (1946), through his widely used grid based on heterogeneous data, has made a distinct contribution to the clinical interpretation of physical measure- ment of height and weight. Meredith (1949, 1955) has devised growth charts based on the distribution of height and weight measurements, made between 1950 and 1940, of Iowa City children. Rueda-Williamson (1958) has recently reviewed the available methods for assessment of growth and development of children, with special reference to a modified form of the Wetzel Grid. Naimark (1957) has collected the available data on American children into a convenient Growth Spectrum.1 This chart visually emphasizes, by colored weight and height zones, differ- ences in growth patterns.
1. Applications
Anthropometric standards of reference are particularly useful in the objective interpretation of nutritional survey data from economically underdeveloped areas. Thus, the problem of ascertaining the preferable adjunct to a predominantly cereal diet can often be determined in the human where its solution is of the greatest importance (Widdowson and
1 Copies of this chart may be obtained from the White Laboratories, Inc., Kenil- worth, New Jersey.
McCance, 1954). The advantages of a minimal amount of milk solids or a specific amino acid could be measured by this approach. Such information is of vital importance since a supply of generous amounts of high quality proteins and of naturally occurring vitamins is not yet within sight. In our studies on the management of malnutrition of con- valescence with protein-containing supplements (Higgons and Albanese, 1957), we have found it most useful to estimate the gross nutritional status of adult patients from the tables of the Metropolitan Life Insur- ance Company (1951). Deviations of the observed weight from the desirable weight indicated by these tables are recorded as per cent of standard weight (% S) in reference to the age-height-weight parameter.
Since these tables give no figures for subjects over 60 years of age, one is compelled to assign the values for the 59-60 year age group to all ages above 60. In using anthropometric standards as a measure of nutritional status, it is important also to realize that significant national and racial differences exist.
B. BODY COMPOSITION
Although measurements of body weight and height as related to sex and age are generally considered to offer the most objective and prob- ably the most sensitive direct measure of nutritional deterioration, the validity of these criteria rests on the tacit assumption that body composi- tion remains constant. However, examination of the literature reveals that appreciable shifts in the tissue compartments, water, fat, and pro- tein frequently accompany changes in the dietary, nutritional status, and age of the test animal (Cowgill, 1958).
1. Effect of Dietary
It is well known that water is indispensable for the efficient utiliza- tion and conservation of food within the body (Snively and Wessner, 1954). The most important connection of water with other food sub- stances is the fact that the water content of the body changes with the type of diet (White House Conference, 1932). The biochemical basis for this relationship arises from the fact that the water deficit created by protein metabolism is about seven times that for equivalent calories of carbohydrate or fat (Table II). Hence, it is not surprising to find in studies with experimental animals and young children that an increase in calories from carbohydrate causes hydration; whereas an increase in calories from proteins causes dehydration (Pratt and Snyderman, 1953).
The increased output of ketones and acids which accompanies a shift to high-fat diets is associated with increased water loss. This water loss can be offset by an increase in carbohydrate intake.
Considerable evidence is also on hand to show that protein quality
influences the degree of tissue hydration. Studies by Albanese and co-workers (1947a), on the comparative biological value of some milk protein preparations in normal male infants, disclosed that poor biolog- ical value and divergences of weight change and nitrogen retention could be related to the greater water loss induced by a tryptophan- reinforced casein hydrolyzate-containing diet. This effect can be ex- plained in part on the basis that the excessive renal load of free amino
TABLE II
GRAMS OF W A T E R NEEDED FOR COAIPLETE METABOLISM OF 100 CALORIES OF SOME FOOD SUBSTANCES
Food material Protein Starch Fat Beef, sirloin Fish, cod Eggs, hen Milk, whole Bread Apples
Preformed water
0 0 0 120 25 47 127 14 150
Gained by oxidation
10.3 13.9 11.9 11.3 10.4 11.1 12.5 13.2 13.9
Lost in dissipating
heat 60 60 60 60 60 60 60 60 60
Lost in excreting end products»
300 0 0 382 119 154 123 69 56
Deficit 350~
46 48 312 143 156 102 43 -AS
a One calorie of protein requires 3.0 ml. of water for the excretion of the urea and sulfate formed from it, 1 gm. of ash requires 65 ml. of water for its excretion.
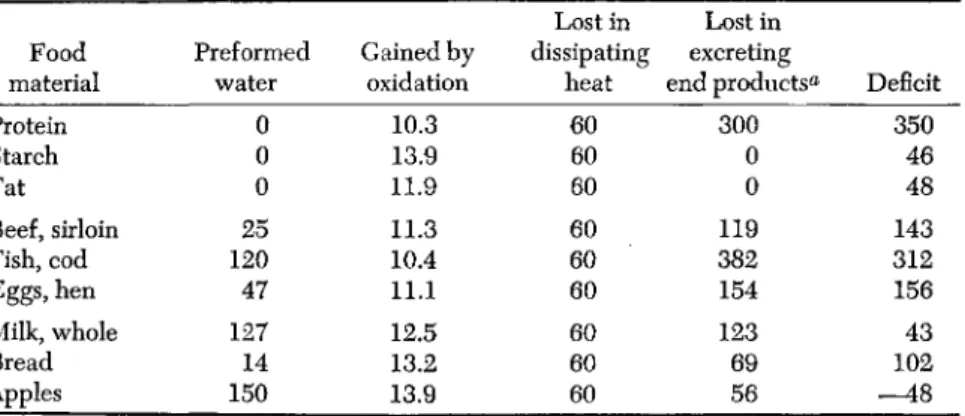
acids presented by such diets induces an electrolyte diuresis. Similar conditions can be expected to be created by diets containing mixtures of synthetic amino acids—especially those with D-forms. More recent studies by Albanese (1956b) disclosed that intracellular water, as deter- mined by thiocyanate space measurements, decreased markedly when infants were transferred from an evaporated milk formula to equal quantities of an isonitrogenous isocaloric wheat gluten formula (Fig. 1).
The thiocyanate space returned to the norms with fortification of the wheat gluten diet with L-lysine. This effect of the nutritionally imbal- anced wheat gluten may be related to the fact that amino acids are liberated from this protein which cannot be utilized for tissue synthesis for lack of adequate amounts of lysine. The excretion of these excess amino acids, as with the previously mentioned casein hydrolyzate diet, causes an increased water loss.
2. Depletion States
Disease or trauma causes dehydration or hydration, depending on the nature and severity of the insult. Acute injury, accidental or surgical,
often results in such severe dehydration that restorative fluid therapy must be applied. Massive infections also reduce the normal water con- tent of tissues. Cardiovascular diseases in advanced stages cause edema.
FIG. 1. Effect of a wheat gluten diet and lysine supplementation on nitrogen retention and thiocyanate space.
Malnutrition arising from a suboptimal overall intake of food, or starva- tion, at first induces a loss of body water; and, if prolonged, an accu- mulation of water in the tissues—generally referred to as nutritional edema. In some phases of convalescent malnutrition this edema may be subclinical in nature. Higgons and Albanese (1957) reported that measurements in 44 adult convalescents, receiving a high-protein supple- ment for 21 days, without overt signs of edema, showed an average decrease in thiocyanate space of 1,686 ml. (equivalent to 3.7 lb.). Dur- ing the same period of time, the scales indicated an average increase in gross body weight of only 2.0 lb.; whereas, in fact, these patients had experienced an average increase of at least 5.7 lb. in physiologic body mass.
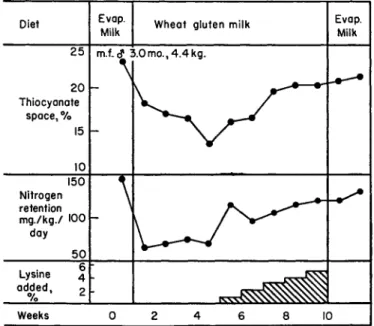
3. Age
Advancing years have been found to cause a progressive loss of body water which is associated with an almost proportionate increase in fat deposition. Although no accurate figures on the magnitude of this dehydration in man are available, some approximations have been made
from water-balance measurements (Brozek, 1952). The proclivity of increased fat deposition with age is well known and it seems to take place at the expense of losses in body water (Fig. 2).
0I I I I I I I I I
20 30 40 50 60 70 80 90 Age in years
FIG. 2. Relationship of body fat and antipyrine space to age of man. Adapted from the data of Brozek (1952) and Watkin (1958).
C. SUMMARY
The knowledge and consideration of the factors which influence body composition have long troubled this author in the interpretation of nutritional data derived from his own studies and those of other inves- tigators. This concern has led to many as yet unpublished efforts on the measurement of body tissue compartments during the test, pre-, and postcontrol periods of many dietary studies. Since most of these studies have been performed on human subjects, only nondestructive pro- cedures could be employed. This limitation permitted the consideration of only the specific gravity or dilution techniques. The specific gravity methods, so well investigated and reported by Behnke (1953), cannot be applied readily to young children, the aged, or convalescent adults.
Of the reported dilution methods, we have had extensive experience with the thiocyanate, Evans' blue, and antipyrine variants, but not heavy water. In our investigations serial measurements with these agents, which are necessary in metabolic studies, have proved too bother- some for our category of subjects, who are typical of any civilian hospital population. Furthermore, the interpretation of the data obtained by these methods in terms of inter- or intracellular body water changes
cannot be made readily in biochemically or physiologically abnormal subjects. It is obvious that newer techniques must be explored to facil- itate the determination of changes in body composition which are clearly so important a factor in the measurement of gross body weight. The lack of such modalities constitutes a serious obstacle in the further advance of nutritional knowledge.
II. BLOOD PROTEINS
The laboratory methods most widely used in appraising nutritional status are the determination of the plasma proteins and the hemoglobin content of the blood. The use of these criteria as a measure of protein intake and metabolism derived early support from the studies of Holman and his associates (1934), who postulated that blood proteins take part in the dynamic equilibrium existing between all the body proteins. Their findings have agreed in the main with the observations of Weech (1938, 1942) and of Melnick et al. (1936). The direct incorporation of ingested amino acids into plasma proteins has also been shown by Schoenheimer and his co-workers (1942) by the feeding of isotopic amino acids. By this technique, these workers demonstrated that the various plasma protein fractions participate in general metabolic reactions to about an equal extent. Hemoglobin anabolism is known to suffer under certain conditions when the protein intake is inadequate (Youmans, 1945). The Ortens (1943) found that chronic anemia could be produced in rats by feeding them a diet low in protein. Albanese and co-workers also demonstrated that dietary deficiencies of tryptophan (1943) and methi- onine (1946a) produced marked anemia and hypoproteinemia in young and mature rats. Subsequent studies by Shemin (1948) have demon- strated the participation of glycine and other two- or three-carbon com- pounds in the formation of hemoglobin. It is clear from this and other available evidences that the blood proteins participate dynamically in the metabolic pool and should therefore reflect by their amount a measure of the nutritional state of the organism.
Unfortunately, in an attempt at technical simplification, widespread use has been made of concentration measurements as an index of total circulating plasma proteins or hemoglobin. This usage is based on the false assumption that the circulating fluids of the body are constant in volume. Since, as noted in the previous section, the volume of circulating plasma is subject to considerable variation in relation to growth, age, health, and acute and chronic disease, it is evident that significant changes in total quantities of circulating blood proteins may be masked if protein concentration is measured without regard for expanding or contracting blood volume. Peters (1942) has aptly pointed out that
three-dimensional functions cannot be evaluated by two-dimensional measurements, and that, hence, alterations in total circulating protein and plasma volume cannot be estimated from percentage protein con- centrations. It is obvious from these considerations that the circum- stances under which plasma protein and hemoglobin levels may serve as criteria of protein intake or nutritional status will have to be re- evaluated in the light of newer knowledge.
A. BIOSYNTHESIS AND DIETARY PROTEIN QUALITY
1. Experimental Animals
The efficiency with which dietary proteins are used for the formation of blood proteins has been employed extensively by Madden and Whipple (1940) as a measure of their nutritive value. The technique, as developed by this group at the University of Rochester, is basically simple. Dogs are depleted of their blood proteins as rapidly as is con- sistent with their well-being. A zero-protein diet plus frequent blood removal achieves depletion of both hemoglobin and plasma proteins within a 3- to 4-week period. The dogs are then placed on a test-protein diet, weighed daily, and their protein intake accurately calculated.
Plasma protein and hemoglobin levels and total blood volume are deter- mined and corrected for the amounts of blood protein actually removed by bleeding. From these figures the amounts of plasma proteins and hemoglobin produced weekly can be calculated and compared with the dietary intake. A number of test proteins were fed. These included beef heart and muscle, casein, egg yolk, egg white, whole egg, lactalbumin, pork liver, peanut flour, canned "pink Alaska salmon," and wheat gluten.
The results of these studies are given in Table III. These figures are averages of the data obtained from 2 to 5 dogs fed the several proteins, and they are listed in the descending order of total blood protein forma- tion in terms of output per week. It will be observed that considerable dis- crepancies exist between blood protein production values and gain or loss of body weight. This is particularly true of wheat gluten which ranks fourth in the production of blood proteins and yet produced the greatest weight loss. This weight loss may be associated with excessive loss of body fluids (Fig. 1).
In a series of studies sponsored by the Bureau of Biological Research of Rutgers University, in which five reference proteins (egg white, lactalbumin, whole egg, casein, and wheat gluten) were evaluated by different methods of assay, similar paradoxical findings were obtained in regard to the nutritional value of these proteins and especially with wheat gluten (Allison, 1949). Chow (1950), working with protein- depleted dogs, found a marked lack of correlation between nitrogen
balance index and plasma protein regeneration properties. For example, lactalbumin, with a nitrogen balance index of 1.00, did not stimulate as effectively the synthesis of plasma proteins as did casein or whole egg proteins with indexes of 0.80 and 0.95, respectively. Egg white, which has the highest biological value among the five proteins, failed to bring about regeneration of plasma proteins to the same extent as casein, even when feeding was continued for as long as 8 weeks.
TABLE III
EFFECTS OF FOOD PROTEINS ON THE FORMATION OF BLOOD PROTEINS
Protein fed Beef muscle, fresh Casein
Liver, pork, fresh Wheat gluten Lactalbumin Salmon, canned Beef heart, fresh Egg white, fresh Egg, whole fresh Egg yolk, fresh Peanut flour
Total blood protein
output per week
(gm.) 58.0 55.6 48.4 46.6 41.6 40.6 38.5 29.0 28.5 26.7 23.9
Ratio of hemoglobin
to plasma protein*1
2.08 2.63 2.94 2.13 1.17 2.04 1.85 1.00 0.83 1.30 2.56
Ratio of protein output to intake
(%) 22 28 26 21 23 14 16 18 18 14 13
Weight gain ( + ) or loss (—)
(kg.) + .09
— .04 + 0.4
— 1.9
— 0.6 + 1.0 + 0.4
— 0.4
— 0.5 + 0.15
— 1.5
a In the normal dog the concentration of hemoglobin (18-20 gm. %) is about 3 times the concentration of plasma protein (6.0-6.5 gm. % ) .
2. Human Studies
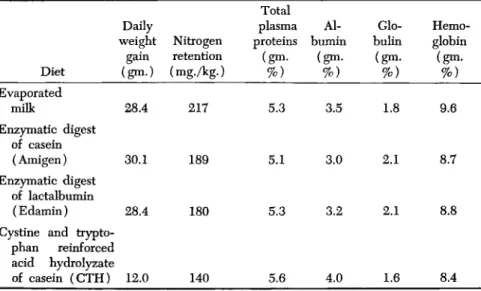
In a biological evaluation of some milk protein preparations in normal infants, the author and his co-workers (1947a) found a discordance between body weight gain, nitrogen retention, and total plasma protein concentration levels. Data typical of 6 subjects so studied are shown in Table IV. The nitrogen balance and body weight measurements obtained in these experiments clearly indicate that by these two criteria the nutritional quality of the CTH diet is inferior to that of the evap- orated milk, Edamin, or Amigen formulas. The definitely inferior nutri- tional quality of the reinforced acid digest of casein was not reflected in blood protein levels of these subjects. Fluid intake and output records showed that this effect was not related to a possible dehydration. From these measurements it appears that, in infants, a temporary 30% decrease in nitrogen retention cannot be detected by measurements of total plasma protein or hemoglobin levels.
It is very clear from the observations of Whipple and the Rutgers group on experimental animals that there exists a definite lack of accord between the nitrogen balance maintenance and plasma protein regen- erative properties of wheat gluten. Since wheat gluten constitutes the principal, and sometimes the only, dietary protein of the major segment of the world's population, and since protein nutrition of population groups is evaluated primarily in terms of total serum or plasma protein
TABLE IV
EFFECT OF D I E T ON BODY WEIGHT, NITROGEN RETENTION, AND BLOOD PROTEINS0
Diet Evaporated
milk
Enzymatic digest of casein (Amigen) Enzymatic digest
of lactalbumin (Edamin) Cystine and trypto-
phan reinforced acid hydrolyzate of casein (CTH)
Daily weight
gain (gm·)
28.4
30.1
28.4
12.0
Nitrogen retention (mg./kg.)
217
189
180
140
Total plasma proteins (gm·
%) 5.3
5.1
5.3
5.6
bumin Al- (gm.
%) 3.5
3.0
3.2
4.0
bulin Glo- (gm.
%) 1.8
2.1
2.1
1.6
Hemo- globin (gm.
%) 9.6
8.7
8.8
8.4
a All diets fed at the daily rate of 100 calories and 3.5 gm. of protein per kilogram of body weight. Results are given as daily averages of 7-day periods.
Subject: P.D. male, 6 mo.; initial body weight, 6,484 gm.
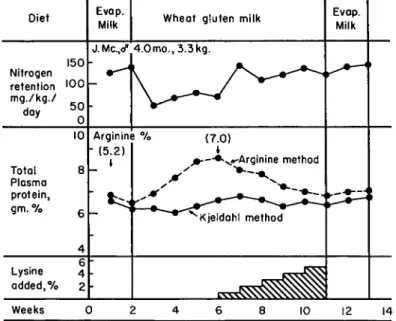
percentage levels, it seemed worthwhile to the author to attempt a resolution of this nutritional paradox if it existed in the human. Accord- ingly, 6 male infants were fed a synthetic milk preparation in which wheat gluten constituted the principal source of protein (1953). The pattern of the dietary regimen for these studies is illustrated in Fig. 3.
It will be noted from this graphic representation of typical data secured in this investigation that, although the wheat gluten diet caused a marked depression in nitrogen retention values, it did not affect the plasma protein levels as determined by the Kjeldahl procedure. How- ever, measurement of the plasma proteins in terms of their arginine content (Albanese et at, 1946b) showed them to increase progressively with duration of the wheat gluten diet. When this diet was supple- mented step wise with L-lysine, the arginine content of the total plasma
proteins was slowly restored to the norm from the aberrant values of 7.0-9.2% arginine. No significant alteration in the albumin-globulin ratios was observed throughout the course of these studies. From this it would appear that the compositional change involved both major plasma fractions. The nitrogen retention of all infants was restored to normal values when the wheat gluten diet was supplemented so that the lysine intake ranged from 185-220 mg. per kilogram daily. Since the percentage plasma protein levels were not altered by this dietary sup-
Diet
150 Nitrogen retention ' 0 0 mg./kg./
10
Total 8 Plasma
protein,
gm. % 6
Lysine added,%
Evap.
Milk Wheat gluten milk J.Mc.,<f 4.0mo., 3.3kg
Arginine %
I" (5.2) "
t
(7.0)
•---•^-•r'Arginine method Evap.
Milk
Weeks 10 12 14
FIG. 3. Effects of a wheat gluten diet on the nitrogen retention, plasma protein levels, and arginine content of the plasma proteins. The values in parentheses denote calculated arginine content of the plasma proteins.
plement, it must be concluded that measurements of these blood com- ponents do not constitute an adequate criterion of lysine intake in the infant.
The dietary lack of tryptophan (Albanese et al., 1947b), methionine (Albanese et al., 1949a), or isoleucine (Albanese et al., 1948) has been found to cause a drop in nitrogen retention as well as a decrease of 20%
or more in plasma protein levels of infants within 10 to 16 days. The finding that plasma proteins are formed at an apparent normal rate in the face of an inadequate lysine intake (Fig. 3) suggests that synthesis could be maintained by one of two processes: (a) substitution of argi- nine in these proteins; or (b) an increase in a plasma protein fraction or fractions rich in arginine. On the basis of available collateral evidence
the first mentioned mechanism appears to be more probable. Apparently such compensatory mechanisms are not available to the organism under the stress of dietary deficiencies of tryptophan, methionine, or isoleucine.
Subsequent studies by Hundley and co-workers (1957) on the effect of lysine-poor diets on the arginine, lysine, and threonine content of serum proteins of adults showed no changes. Aside from the age differences of the test subjects, the dietary conditions and analytical procedures in these studies were quite different from those employed by Albanese.
B. BLOOD PROTEIN LEVELS AND DIETARY INTAKE
In spite of the above considerations, the usefulness of serum or plasma protein determinations as criteria of protein intake is not without some support. Observations on animals confirm the development of serum protein deficiencies when they are kept on diets poor in protein or single amino acids (Albanese, 1952). In man, many studies in famine areas during World Wars I and II disclosed low serum proteins. Heg- sted and his associates (1946) found that total protein and plasma albu- min and globulin tended to decrease when low-protein, all-vegetable diets were fed at a level low enough to produce negative nitrogen balance. Kark and his co-workers (1947), in studies on the nutrition of troops in tropical areas, found that there was reasonable correlation between the average protein intake and its concentration in the serum.
Indian troops, with a lower protein intake than Americans or Canadians, had lower serum protein levels.
However, Keys and co-workers (1946) found only a slight decrease in the plasma protein of 34 men maintained on a European-type famine diet for 6 months. Reports from the East Indies, Australia, Western Netherlands, and Panama have disclosed high serum protein values in poorly nourished groups in these areas. Other workers in Europe after World War II failed to find a lowering of serum protein in groups in which they had expected it. In the United States and Canada, many surveys have failed to demonstrate hypoproteinemia in low income groups (Youmans et al., 1943).
Published studies of Scrimshaw and co-workers (1951) have shown that the problem of interpretation which is posed by the serum protein data is not only one of failure of low protein intake to be reflected in serum protein levels, but also the occurrence of a distinct elevation of serum protein above normal levels under certain conditions in relatively undernourished individuals in Central America. Values as high as 7.39-7.61 gm. % were found in groups who were well hydrated but dis- tinctly undernourished. Scrimshaw also found that this circumstance prevailed in pregnant women in Panama whose daily protein intake was
decidedly below normal levels. In studies on women in Rochester, New York, he found further that 204 clinic patients showed consistently higher plasma protein levels throughout the pregnancy period than did 210 private patients. This occurred in spite of the fact that the protein intake of the private patients was approximately 10% higher than that of the clinic patients.
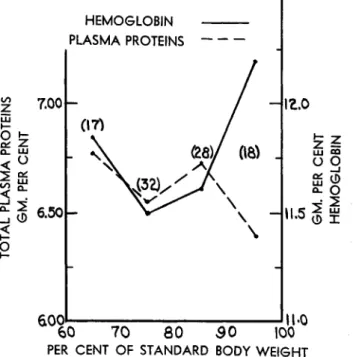
Recent data of Albanese and co-workers (1958) on adults shows that there exists relatively poor correlation between total plasma protein
IZ.O
U j GO
υο
»1.5 äj 1
~~60 70 80 30 I0Ö "
PER CENT OF STANDARD BODY WEIGHT
FIG. 4. Blood protein levels and body weight variations of adults 40-73 years of age.
levels and deviation from desirable body weight (% S), but good corre- lation between hemoglobin concentration and body weight in the 100-70% S range. The experiments of Madden and Whipple (1940) suggest that this observed divergence of hemoglobin content and body weight in the 70-60% S range (Fig. 4) may constitute an expression of the hemoconcentration effects of severe malnutrition.
Depletion of plasma protein, specifically albumin, occurs frequently in the aged (Rafsky et al.y 1952). Chesrow and co-workers (1958) have shown that the total serum proteins of 41 adults (70-94 years) was significantly lower than that of 13 younger adults (20-35 years). This
HEMOGLOBIN PLASMA PROTEINS
in Z 7.00
Q_ LLI
<°
^ LU
o 2
Φ 6.50h
fiftn
was caused primarily by a decrease in the albumin level of the aged group. The explanation for this difference is not clear. Chinn and his associates (1956) were unable to demonstrate any discrepancy between the rate of digestion and absorption of an I131-labeled albumin test meal in aged and young people. However, both Kountz et al. (1951) and Albanese et ah (1957) have demonstrated that negative nitrogen bal- ances may occur subclinically in the elderly.
In the light of the foregoing, the question arises as to what nutri- tional significance can be given to plasma protein and hemoglobin concentration values. The clinical value of plasma protein concentration levels and albumin-globulin ratios in some diseases has been well estab- lished (Poli, 1951). In the author's experience, these measurements are an invaluable aid in following the nutritional effects of nephrosis in children (Albanese et al., 1949b). Similarly, the hemoglobin determina- tion has proven itself an indispensable tool in the study and treatment of anemias (Wintrobe, 1949). In most of these instances, where the clinical and nutritional state of the patient correlates well with the blood protein picture, the problem of interpretation and therapy is clear. The para- doxical findings seem to occur predominantly in malnourished indi- viduals, but they are not associated with any specific disease. Available evidence suggests that it is this subclinically ill group who might benefit most readily from dietotherapeutic measures (Cannon, 1944). Unfortu- nately, we have no ready means at present for detecting the need for such measures. Nitrogen balance or fluid space determinations which, in conjunction with blood protein concentration measurements, might aid in the detection of dietary defects are not always practicable.
C. SUMMARY
It is abundantly clear from the evidence that concentration levels of hemoglobin and serum or plasma proteins are not always dependable criteria of the nutritional state in some individuals. Examination of the available evidence indicates that this lack of correlation may arise from (a) hemoconcentration or hemodilution effects; (b) compensatory com- positional changes of the blood proteins; and (c) an assymetric rate of synthesis of various tissue proteins. We feel that the existence of these phenomena should be more generally recognized and that basic studies should be undertaken to attempt a resolution of the anomalies.
III. NITROGEN BALANCE
The simplest and oldest chemical method used to evaluate the nutri- tional properties of proteins in an animal is to determine the difference between nitrogen intake and nitrogen excreted. This difference, called nitrogen balance, shows whether an animal is gaining or losing bodily nitrogen. If the nitrogen intake equals the total nitrogen output, the balance hovers about zero and the animal is said to be in nitrogen equi- librium. This condition is attained in the normal well-fed adult. In the well-fed immature organism which is endowed with a growth potential involving the formation of tissues, the nitrogen balance is always posi- tive; that is, the nitrogen intake exceeds the nitrogen output. This indicates that nitrogen is being retained for synthesis of body tissues.
In man, a maximum positive value is achieved during the first six months of life, and decreases steadily in a logarithmic manner with age.
A. THEORY
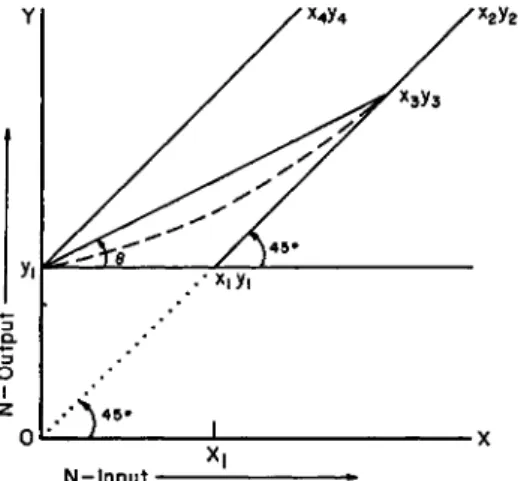
A very useful mathematical exposition (Fig. 5) of the theory of the nitrogen balance method was set forth some thirty years ago by Martin
Y
Q.
o I
z
N-lnput '■ ■»
FIG. 5. Mathematical expression of the theory of nitrogen balance. Adapted from Martin and Robison (1922).
and Robison (1922). This relates the nutritive value of dietary protein to changes in nitrogen balance with classic lucidity.
Let 2/1 be the output on a nitrogen-free diet of adequate fuel value;
then t/i is equal to the nitrogen minimum. Suppose that an ideal protein (biological value = 100) is fed in gradually increasing amounts and is utilized without waste. So long as the intake (x) remains lower than yu the output will remain constant and equal to yu since the food protein
x2y2
saves an equal amount of body protein. When the nitrogen input equals the nitrogen output (x± = t/i) the body will be in nitrogen equilibrium.
This point (xitfi) will represent the minimal protein needs of the body.
If now the intake of the ideal protein be further increased, equilibrium will again result (unless the body is in a growing condition or has been previously starved of nitrogen) and its graph will follow the line to x2 tj2 at an angle of 45° to the axes.
With proteins of biological value (B.V.) less than 100, minimal nitrogen equilibrium will not be attained on an intake equal to t/i but on some greater amount defined by the point xs 1/3- On all amounts less than this, the output will exceed the input and the graph will follow some line joining the points y1 and xs i/3. Whether this line is straight or curved will depend on the conditions set out above, viz.: (a) uniform caloric economy with varying nitrogen intake; (b) amino acid pattern of the nitrogen requirements of the body. If these conditions obtain, the line j/i, xs ys will be straight and its equation will be y = yx + x tan 0 where y is the real output corresponding to any real intake x, less than
#3. For higher values of x the graph will follow the line joining the points xs ys and x2 y2-
In this frame of reference Thomas's formulas (1909) can be very simply expressed in terms of Θ; thus
Urine N in N-free diet + N-balance N-intake
B.V. = 100 X Vl + (* ~ y) becomes X
B.V. = 100 x fl + « - (yi + « taD *>
or X
B.V. = 100 X (1 — tan Θ).
If the above conditions do not obtain, e.g., if certain of the amino acids are required for specific purposes which are distinct and can be separately satisfied, the graph of a protein diet, rich in these acids but poor in others, would be a curved line such as the dotted line joining points t/i and Xs ys- This curvature would express the fact that a certain fraction of the body's needs could be satisfied by a smaller amount of this protein than would correspond with the amount required to obtain equilibrium. The angle Θ and the biological value would then vary for different values of x.
The graph of a protein (B.V. = 0) unable by itself to satisfy any
portion of the body's nitrogen requirements, would be a straight line t/i, x4 J/4, parallel to the slope of x2 y2, since the nitrogen output would always be equal to the intake + t/i. For this line Θ = 45° and the equation y = x tan Θ becomes y = j/i + x, while the biological value = 100 (1 —tan 45°) = 0 .
B. EXPERIMENTAL DATA
The demonstration by Rose (1938) that animals could be grown and maintained on mixtures of amino acids as well as whole proteins has greatly expanded the scope of the above theorem. Recent studies have shown that it may be employed to advantage in estimating the human need for certain amino acids in terms of amino acid blood levels
(Albanese et al., 1958). Many experimental procedures based on corol- laries of the nitrogen balance theorem have been devised for the meas- urement of the nutritive value of proteins in terms of biological value, protein minima, and nitrogen balance index (Allison, 1949; also this book).
1. Animal Studies
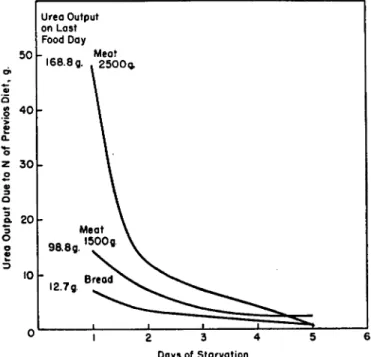
Most of the problems of application of the theory stem from the fact that the validity of the data depends on having an absolute nitrogen minimum value (E0) (Lang and Ranke, 1950). The dependence of the nitrogen minimum on the quantity and quality of protein ingested prior to the depletion period was demonstrated as early as 1866 by Voit. He fed a dog weighing 35 kg. different quantities of meat and measured the effect on urea output during the subsequent starvation period
(Fig. 6). By deducting the urea eliminated on the sixth day, when the output became constant at 12.0 gm. per day, from that excreted on previous days of starvation, he obtained the grams of urea derived from previous food. Bread, fed in ad libitum quantities, showed poor nutri- tional value by this criterion. In later experiments with hogs, McCollum and Steenbock (1912) showed that the minimum nitrogen expenditure on a protein-free starch diet was considerably lowered by feeding zein instead of urea in the fore period.
Mitchell (1923-1924) described the determination of the biological value of a protein by a method based upon nitrogen balance data obtained under dietary conditions which provided sufficient carbohy- drate and fat to satisfy the energy requirements so that the catabolic processes were prevented. The basic calculation of Mitchell's biological value is
Retained food N
Absorbed food N X 1 0° = B V'
Values for the two unknown functions of this equation are derived from the following considerations:
Absorbed food N = Food N — fecal food N
Fecal food N == Fecal N — Metabolic N of feces Retained food N = Absorbed food N — Excreted food N
Excreted food N = Urine N — Endogenous N or urine The items "metabolic N of feces" and "endogenous N or urine" are obtained by measuring the nitrogen output of animals maintained on a
50
.8 4 0
z 3 0 o
20 O σ
Urea Output on Last Food Day
Meat 168.8g. χ 2500g.
10
w 1 2 3 4 5 6
Days of Starvation
FIG. 6. Effect of previous diet on rate of nitrogen depletion of dogs (data of Voit, 1866).
nitrogen-free diet until a true nitrogen-minimum level (t/i in Fig. 1) has been achieved. Unfortunately, this value must be determined for each experiment, since it varies not only from animal to animal, but in the same animal at different times. The possibility, that the distinction between exogenous and endogenous nitrogen as envisioned by Folin (1905) and derived from these calculations by Mitchell is no longer tenable according to the dynamic concept of protein metabolism, in no way invalidates the results secured by the method. It is of more than passing interest to note that Mitchell also found that the biological value of proteins, as determined by his procedure, increased with a decrease
in protein content of the diet (Table V). This effect appears to be related in part to the biological value of the test proteins.
Melnick and Cowgill (1937) have demonstrated the linear relation- ship between nitrogen balance and per cent protein calories in the diet.
On the basis of this relationship the nutritional value of proteins and amino acid mixtures can be estimated from the minimum amount of dietary nitrogen necessary to maintain nitrogen equilibrium. Allison
(1949) and associates have further modified this technique so that the relationship of absorbed nitrogen and nitrogen balance are measured in
TABLE V
RELATIONSHIP OF THE BIOLOGICAL VALUE ON THE AMOUNT OF PROTEIN IN THE DIET»
Protein Milk Oats Corn Potatoes
5% Protein 93 79 72 69
Biological Value
10% Protein 65 85 67 60
a Mitchell and Hamilton (1929).
the region of negative or slightly positive balance. The slope of the line obtained by a plot of these values, which are functions of nitrogen out- put and input given in Fig. 5, yields the nitrogen balance index of the foodstuff. This is equivalent to a function of the angle 0° (Fig. 5). It should be recognized that although these variants do not add anything essentially new to the theory of measuring biological value, they do simplify visualization of the processes, especially in catabolic states.
2. Human Studies
The difficulties encountered in determining biological values or nitro- gen balance indexes in experimental animals are also faced to an even greater degree in studies with humans. Hoffman and McNeil (1949) applied the nitrogen balance index procedure to human studies and found the following disadvantages: (a) the need of a long and difficult balance study; (b) irreducible error of the determination of the nitrogen minimum; and (c) difficulty of securing data having a linear relationship.
These difficulties have long been known. Measurements of the min- imum endogenous nitrogen metabolism of man, made by the early workers, have been cited by Millard Smith (1926). The data in Table VI has been taken mainly from his paper and from the recent findings of Bassett (1945). Attention is called to the variations in the nitrogen per kilogram values. Bassett's experiments on the effect of testosterone on the nitrogen minimum suggests that the hormonal state of the indi-
vidual may exert a more profound influence on the minimum nitrogen metabolism than has hitherto been realized.
Apart from the nutritional history and hereditary factors of the organ- ism, it has been found that while the endogenous nitrogen per unit of body weight tends definitely to decrease with increasing weight and age, the endogenous nitrogen is constant when related to basal metab- olism (Terroine and Sorg-Matter, 1920, 1928). This correlation seems to prevail not only for man, but also for pigs, cattle, sheep, dogs, and rats and may be due in part to hormonal or enzyme factors.
TABLE VI
MINIMUM EXCRETION OF NITROGEN IN URINE OF ADULT HUMANS«
Investigator Folin Klemperer Thomas Graham and
Poulton Robinson Klerker Siven Smith Bassett Bassett
a Albanese
Total urine nitrogen
(gm.) 2.60 2.51 2.98 2.25 1.99 2.01 1.84 1.58 2.03 1.39 (1950).
Nitrogen kilogram per
(gm.) 0.0406 0.0395 0.0391 0.0366 0.0344 0.0319 0.0317 0.0242 0.0372 0.0278
Day of experiment 12 8
19 11 9 6 7 24 41 to 45
51 to 55 (Testosterone propionate)
Murlin et al. (1946) have also measured the excretion of nitrogen by man fed a protein-free diet with the aim to determine biological values of proteins. They too found that the minimum nitrogen expendi- ture varied in man with (a) level of protein in the pre-experimental diets; (b) the position of the nonprotein period in the series of periods;
(c) the nature of the protein (supporting protein) immediately preced- ing the protein-free period and its level of intake; and (d) conditions antecedent to the supporting proteins which could influence the nitrogen debt to the beginning of the protein-free period. In the face of such difficulties these investigators were able to ascertain that the biological value of mixtures of amino acids was always 10-40% lower than the natural proteins.
The adaptive mechanisms of the body serve to further confute efforts at a quantitation of the protein needs by the nitrogen balance method.
As long ago as 1900, Siven showed that nitrogen equilibrium could be maintained at a lower level than that ordinarily occurring in starvation.
In this experiment, which was divided into five periods of about a week each, a healthy man, weighing 60 kg., who normally ate a mixed diet containing 16 gm. of nitrogen, was given a diet containing 12.7, 10.4, 8.7, 6.3, and 4.5 gm. of nitrogen, rich in carbohydrate, and yielding 2444 calories per day, in each successive period. Nitrogen equilibrium was established at all five levels of nutrition, albeit 3 and 4 days, respectively, were required to achieve it at the lowest nitrogen intake levels. In a subsequent experiment on himself, Siven, who was 31 years old and weighed 65 kg., reported that he attained nitrogen balance on an intake of 4 gm. of protein nitrogen and 2717 calories (1901). Petren (1924) maintained a diabetic patient in nitrogen balance for a month or more
50
45
Si 40
E «= >
1 §* ε 35
C £ 5 c
30
Age(yr.) 25
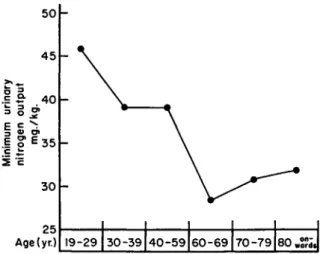
FIG. 7. Effect of age on minimum urinary nitrogen output of man. Adapted from Schulze (1955).
on a diet containing 4 gm. of protein nitrogen. Chittenden (1904) found that nitrogen equilibrium can be maintained on diets providing but 7.19 gm. nitrogen per day and only 21.3 calories per kilogram. It would appear that amino acid and protein needs, indicated by these low levels of nitrogen or caloric intake, are of little or no value as measures of dietary requirements for optimal health (Terroine, 1957).
Schulze (1955) has collected and graphically summarized the avail- able data on the effect of advancing years on the endogenous nitrogen output of man (Fig. 7). Adaptation of older subjects to protein restric- tion has led to further discrepancies between the results of various investigators. To test this mechanism, Schulze compared the nutritive values of wheat and milk proteins in elderly patients. For the first 10 days they were kept on a nitrogen-free diet, then placed for 10 days on a diet which was adequate in protein intake. The physiological net
\
19-29 30-39 40-59 60-69 70-79 80„S?d,
utilization of milk protein proved to be higher in the older than in the young patients. On the other hand, the net utilization of wheat proteins was much lower in the older age group than in the young group (Fig.
8). These observations led Schulze to the conclusion that the minimal nitrogen expenditure in the aged decreases in proportion to the basal metabolic rate, and that the phenomenon was not due to impairment of intestinal absorption of proteins in the elderly.
70 60 50
g 40
1 30
Q) C
"5 o
f 20
o
*5>
>»
έ io
0 age group
FIG. 8. Effect of age on human utilization of milk and wheat proteins.
C. DEPLETION STATES
In this connection it should be noted that Allison (1949) has found nitrogen balance indexes of proteins to increase as the animal is depleted in proteins. This increase is illustrated by the data recorded in Table VII, which also show that the effect of depletion is more marked on the indexes of the poorer proteins. Thus, when there is greater need, more nitrogen is retained and conserved in the body of the animal. Silber et al. (1946) also found that depletion in proteins reduced the excretion of amino nitrogen following intravenous administration of amino acid mixtures.
It has long been known that in the anabolic phase of convalescence, adults can store body proteins at a rate which is inversely proportional
Gmilk 0 wheat
young (22-30 yr.)
old ( 6 0 - 9 2 yr.)
TABLE VII
NITROGEN BALANCE INDEXES IN NORMAL AND PROTEIN-DEPLETED DOGS0
Protein source Egg white Casein
Casein hydrolyzate Wheat gluten a-Protein
Normal 0.96 0.80 0.80 0.44 0.39
Nitrogen balance index
Depleted 0.93 1.2 0.92 0.70 0.73 β From Allison (1949).
to the existing depletion (Forsyth et al, 1955). The relation of the return of nitrogen balance and body weight to the norm is shown dia- grammatically in Fig. 9. Other things being equal, it was noted in our laboratory that if the self-selected dietary was suboptimal (National Research Council, 1953) in terms of total calorie or protein content, normal nitrogen balance for the age of the subject was achieved slowly by decrements of an existing negative balance. On the other hand, if the self-selected diet was optimal in terms of total calorie or protein content, normal nitrogen balance was achieved quickly by decrements of the existing positive nitrogen balance.
FIG. 9. Normal nitrogen balance recovery of convalescent adults consuming suboptimal and optimal self-selected diets.
In depletion states, the need for a greater than normal allowance of calories and protein has been amply documented by Pollack and Halpern (1952). Many evidences, both clinical and biochemical, of a change from a suboptimal to an improved diet have been found to occur in undernourished adult convalescents receiving daily for 21 days a dietary supplement containing approximately 35 gm. of milk proteins and 650 calories (Higgons and Albanese, 1957). These investigations revealed that, in depleted individuals (70-80% S) with negative nitrogen
balance, administration of the milk protein supplement was initially associated with a marked shift to a repletion level of positive nitrogen balance (Fig. 10). With continuation of the supplement, positive nitro- gen balance fell to the normal range for healthy adults (+1.0 ± 0.5 gm.
N per day). Preliminary studies have revealed that excellent accord
PROTEIN and CALORIE SUPPLE MEMT
0 1 2 3
WEEK5
FIG. 10. Representative nitrogen balance and fasting plasma amino nitrogen changes observed in underweight adult convalescents receiving a dietary supplement containing: milk proteins, 36 gm.; carbohydrate, 64 gm.; and fats, 28 gm. The average daily intake on a self-selection basis was approximately 2000 calories and 65 gm. of protein per day. Nitrogen balance is represented by the solid line and fasting plasma amino nitrogen by the broken line.
with the metabolic nitrogen patterns shown in Fig. 10 also characterizes the nutritional improvement found to occur in adult convalescents receiving daily lysine supplements (600-900 mg.) for periods of 1 or 2 weeks (Albanese et ah, 1957).
Unfortunately, the physiological decrease in positive nitrogen bal-
ance, which may often be revealed by detailed studies of this kind, can be misinterpreted to indicate an untoward effect of the test diets or supplements. Failure to realize the dynamic nature of these processes has led many a well-intentioned investigator to cause metabolic embar- rassment in study subjects by excessive administration of proteins and
other nutrients for the purpose of enhancing an existing low but physi- ologically optimal positive nitrogen balance. It seems evident from these considerations that although the nitrogen balance method constitutes a useful tool for the detection of protein or specific amino acid deficiency states which induce negative balances, it is less than a satisfactory procedure for the determination of protein stores and quality in the undernourished with substandard positive nitrogen balances. Indeed, it is this possible interpretative confusion of nitrogen balance data in the continuum of nutritional states of convalescents which led us to explore the use of other methods as criteria of protein metabolism.
The foregoing examples may be regarded as a sampling of many available evidences of the operation of Liebig's law of the minimum (1855). As noted above, this phenomenon makes possible the attain- ment of positive nitrogen balances at planes of nutrition far below those which human experience and history show to be necessary for optimal nutrition. It is obviously difficult for many to accept doubts of the validity of nitrogen balance data obtained with low protein intakes, on the grounds of nutritional history. Dr. McCollum's recent book, "A History of Nutrition" (1957), reveals that the battle of parsimony vs.
generosity in nutrition has been fought with unlagging fervor since the days of the Venetian gentleman, Luigi Comaro (1467-1566).
The ultimate benefits of each of these nutritional attitudes have been questioned. Debate on the point can be long and futile. The true answers lie in the future. Dr. E. V. McCollum's comment (1939) on this subject is worthy of note: "In the United States for about three hundred years we have been trying an experiment in human nutrition on a nation- wide scale with a dietary which is of a kind which no people in history ever tried to live upon before. There is no way in which the results of such an experiment can be foretold." We do know that our way of living has, in the short span of three or four centuries, produced a nation which is the envy and desired haven of many people throughout the world.
D. SUMMARY
The foregoing discussion points up the view that the measurement of nitrogen balance per se is not a sound or infallible criterion of protein nutrition. Unfortunately, the serious shortcomings of this measurement are not generally recognized. However, they are well-known to those
who have employed this tool in metabolic studies on experimental ani- mals or human subjects. Interpretations of nitrogen balance data are especially fraught with imponderable hazards when derived from tests on spontaneously or artificially depleted organisms. This consideration applies in particular to experiments designed to determine protein or amino acid needs by procedures involving prior limited intake of the test nutrient. Improvements in nitrogen balance obtained by stepwise additions of the limiting nutrient, give a measure of the need in a specifically depleted organism. It is not, as has been suggested by some, a measure of the test nutrient requirement for normal healthy organisms.
IV. OTHER METHODS
A. CREATININE EXCRETION
Folin (1905), as a result of his classic studies on protein metabolism, came to the conclusion that the daily output of creatinine of a given person is more or less constant; is influenced by the body weight; and is independent of a diet which does not contain creatine or creatinine.
At that time he introduced the term "creatinine coefficient" which is defined as the amount in milligrams of creatinine or creatinine nitrogen excreted per kilogram of body weight. Also, since the excretion of creatinine is independent of the diet, it was considered to represent the
"endogenous metabolism" of the body as contrasted to the excretion of urea which represents the "exogenous metabolism." In Schaffer's opinion (1908) the creatinine output represented only a special phase of the endogenous metabolism which took place largely, if not wholly, in the muscles. Shaffer, and later, Myers and Fine (1913), and Hahn and Meyer (1928) adduced evidence that muscle creatine is the precursor of urinary creatinine. This transformation was proved conclusively by Bloch and Schoenheimer (1939) and Block et al. (1941) by isotope tracer evidence, which also showed that creatinine was the only normal urinary constituent containing any significant amount of body creatine nitrogen. Insofar as the biosynthesis of creatine is concerned, it is now well established that three amino acids are the precursors (Schoen- heimer, 1942). The fatty acid chain is derived from glycine; the guani- dine nucleus from arginine; and the glycocyamine thus formed is methy- lated by transfer of the labile methyl group from methionine.
1. Children
The creatinine coefficient has been variously interpreted as propor- tional to, or an index of: (a) the amount of active protoplasmic tissue in the body, by Folin (1905); (b) the muscular mass and efficiency of the individual, by Schaff er (1908). In infants where the muscular mass
dominates the endogenous metabolism, the excretion of creatinine has been found by Catherwood and Steams (1937) to be a function of weight with a correlation of 0.9. The correlation coeflBcient for creatine excretion to body weight is about 0.8. At birth the creatinine output averages about 10 mg. per kilogram. Breast-fed infants remained at this level throughout the first year of life; whereas babies fed a formula of undiluted cow's milk showed a mean value of 12.5 nig. of creatinine output per kilogram. The amount of musculature very quickly rises to a maximum in the infants given a higher protein diet.
25r
o20h
& I
JC I
E
| iol·
<υ
51 I I I I I I I I I i ' »
B I 2 3 4 5 6 7 8 9 10 II Age in Years
SUJDIES 8 3 , 0 9 l 0 6 7 2 6 9 3 9 6 5 48 4 I 6 7
FIG. 11. Mean creatinine per kilogram for boys of each age group studied. The fine lines represent standard deviation for the given age. This figure indicates relative growth of the skeletal musculature in relation to total body growth (Steams, 1958).
Macy (1942) found that the preformed creatinine output of growing children rises concomitantly with increase in body weight in such a way that young children may show a creatinine coefficient comparable to that established in normal adults. The data in Fig. 11 relates daily creatinine excretion to body weight for children (Steams, 1956). In children whose weight and height are within normal range, but whose nutrition has been somewhat substandard, except for calories, there are somewhat lower creatinine values. Apparently, muscular development in children is dependent in a large part on the amount of available dietary protein.
Steams feels that the daily creatinine excretion is a very close measure of the total skeletal musculature of the child; and that the protein intake, permitting the quantity of muscle characteristic for any age, closely approximates the protein requirement for that age level.
Talbot (1936) proved that urinary creatinine excretion is directly related to basal metabolism in children. This relationship was amply
confirmed by Macy (1942). Talbot and co-workers (1939) have also presented new creatinine standards for basal metabolism and clinical application for children. These data show that the creatinine standard is as accurate as weight standards for children who are normal, and suggest that it is of greater accuracy for those who are abnormal, espe- cially the obese, because creatinine excretion is an index of muscle weight.
2. Adults
According to Hunter (1928), the creatinine coefficient for males varies from 20 to 26, and for females from 14 to 22. Hodgson and Lewis
14.0 l·-
c , 3 0Γ \ ·
•2 I \ / o I \ /
§ 12.0 U \ /
«> I \ /
i H.of- V
° Ii- I
O I
lo.o' 1 1 1 ·—
60 70 80 90 100 Age in years
FIG. 12. Effect of age on creatinine coefficient. Data are based on 259 con- secutive measurements on 22 individuals over a 7-year period.
(1926) consider the difference in creatinine coefficients of males and females to be related to differences in muscular development rather than sex differences, since they found women with unusual muscular develop- ment to have creatinine coefficients comparable to those of males.
Corpulent, or even moderately corpulent, subjects yield less creatinine in the urine per unit of body weight than do lean ones. Moderately corpulent persons eliminate daily 20 mg. of creatinine per kilogram of body weight; while lean ones yield about 25 mg. per kilogram.
McClugage and associates (1931) found that, upon weight reduction through dietary control, the creatinine excretion of obese persons re- mained constant. These observations on adults are in good agreement with those of Talbot on children.
Serial measurements done in our laboratory on a group of women (65-95 years of age) show that the creatinine coefficient falls with age to the levels found in infants (Fig. 12). In the aged, this fall in creatinine coefficient parallels the drop in basal metabolic rate.