Chapter 4 Availability of Plant Proteins
M . SWAM IN ATH AN
Applied Nutrition and Dietetics Discipline Central Food Technological Research Institute Mysore, India
I. Introduction 197 II. Plant Protein Resources 199
A. Cereals and Millets 200
B. Legumes 202 C. Nuts and Oilseeds 202
D. Vegetables 202 E. Leaf and Grass Proteins 202
III. Amino Acid Composition 203
IV. Nutritive Value 203 A. Factors Affecting the Nutritive Value of Plant Proteins . . . . 207
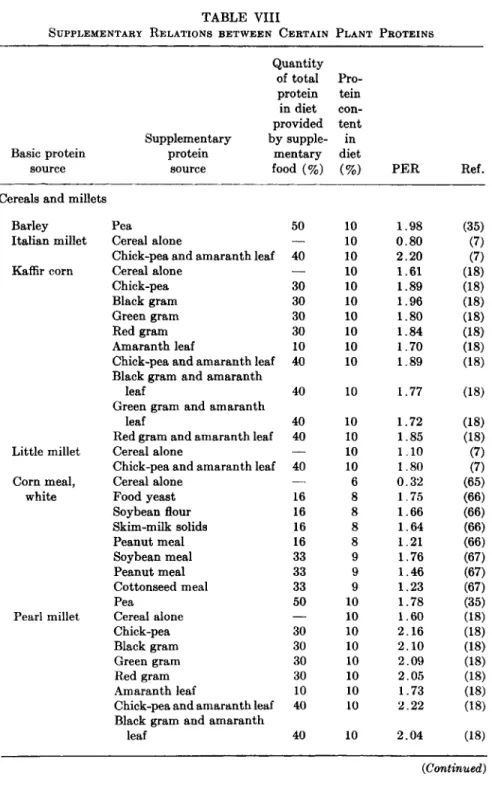
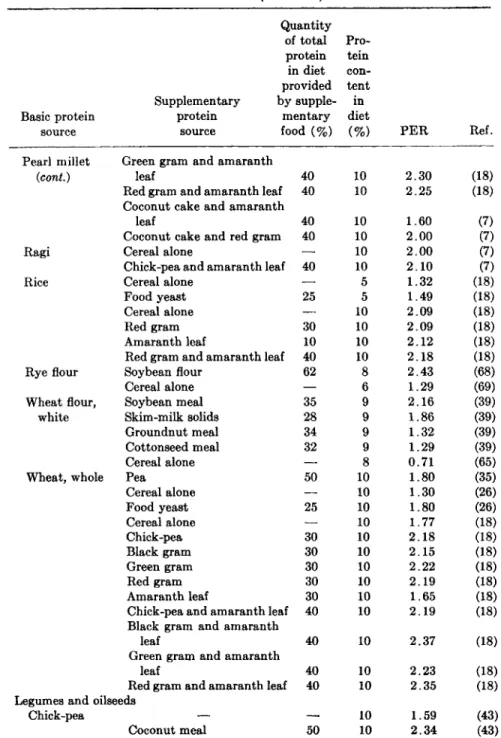
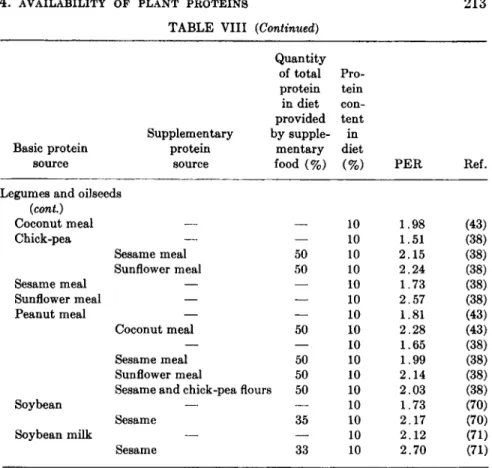
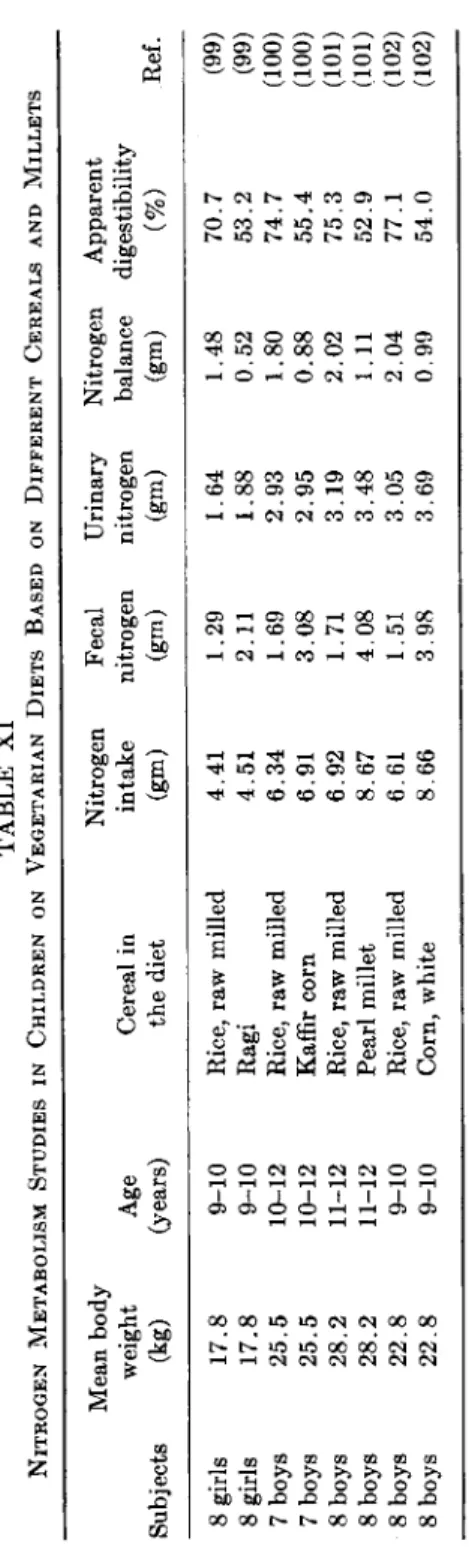
B. Mutual Supplementation between Plant Proteins 210 C. Amino Acid Supplementation of Plant Proteins 214 V. Nitrogen Balance Studies in Humans on Vegetarian Diets Based Mainly on
Cereals and Millets (with and without Amino Acid Supplementation) . 216
VI. Use of Plant Proteins in Child Feeding 220
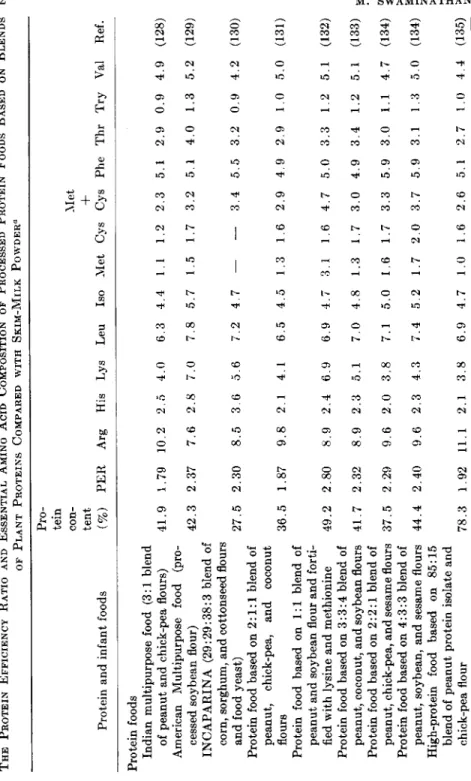
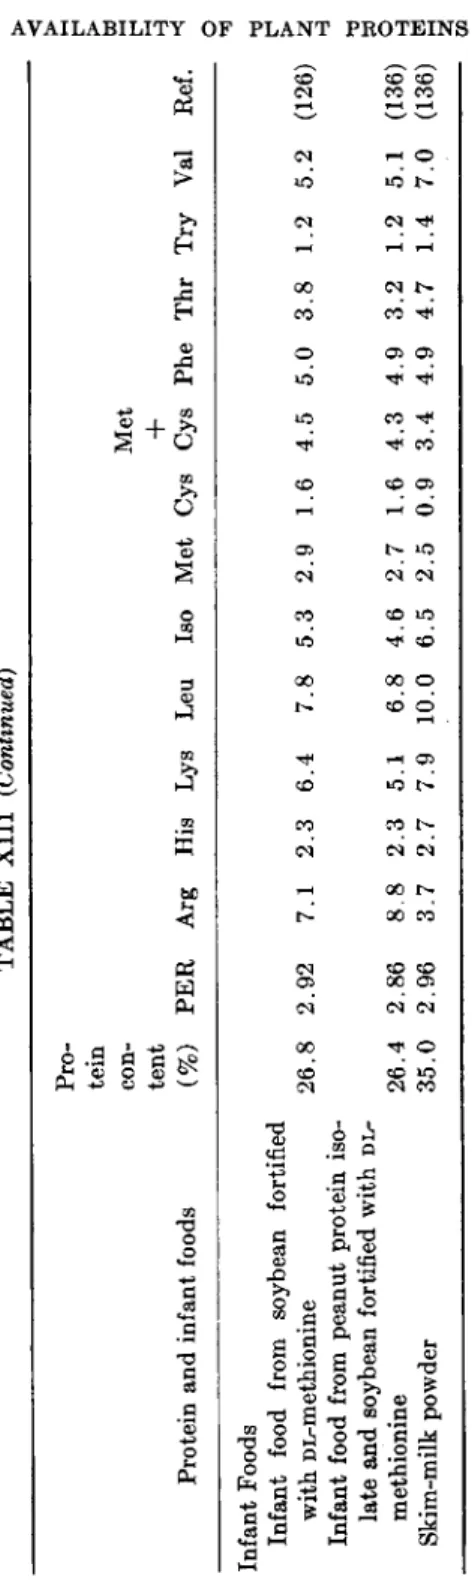
A. Infant Foods 221 B. Processed Protein Foods 221
VII. Discussion 230 VIII. Summary 234
References 235
I. INTRODUCTION
Plants are the main source of protein for man, animals, and birds.
A large majority of the world's population subsists on diets containing predominantly vegetable proteins. In many countries, cereals, millets, roots, and tubers are the staple foods of the people, and legumes, nuts and oilseeds, and vegetables are consumed in small amounts (1). Foods of animal origin are consumed in large quantities in the highly developed countries, viz., North America, Europe, and Oceania, but only in small amounts in the developing countries of Asia, Africa, and South America.
It is now well recognized that in the developing countries a majority of the population lives on diets lacking in protein, and that protein malnutrition is widely prevalent among weaned infants and preschool children (2, 3). These problems are engaging the attention of research
197
workers in the field of nutrition and food technology as well as interna
tional organizations, such as the Food and Agricultural Organization (FAO), the World Health Organization (WHO), and the United Nations International Children's Fund (UNICEF). As a result, a consider
able amount of work has been carried out on the amino acid compo
sition and nutritive value of plant proteins and their use for the preven-
TABLE I
NATIONAL SUPPLY OF FOODS OF VEGETABLE ORIGIN FOR 1 9 6 2 - 1 9 6 3 IN SOME SELECTED COUNTRIES*
Potatoes
and other Pulses
Region and country Cereals starchy roots and nuts Vegetab]
Europe
Germany, Federal Republic 7 8 1 2 8 4 4 7
Ireland 1 0 2 1 4 0 3 6 8
Italy 1 3 4 5 2 8 1 4 0
United Kingdom 8 1 9 4 6 5 6
North America
Canada 6 3 5 9 6 8 1
United States of America 6 5 4 7 7 9 6
Latin America
Argentina 8 9 1 0 6 3 5 0
Brazil 1 0 5 1 6 0 2 7 7
Chile 1 1 8 7 7 9 8 1
Colombia 7 0 1 6 7 1 4
Mexico 1 3 6 1 7 2 3 —
Peru 1 0 0 1 4 7 9 7 7
Far East
Ceylon 1 1 9 3 2 2 9 4 3
China, Taiwan 1 5 7 5 8 1 0 5 6
India 1 3 9 1 1 2 2 —
Japan 1 4 9 7 1 1 7 8 5
Pakistan 1 5 5 4 5 1 6
Philippines 1 1 4 4 0 7 2 9
Africa and Near East
Israel 1 1 7 3 6 8 1 1 0
South Africa 1 6 6 1 4 4 3 6
Turkey 2 2 3 3 8 1 3 1 0 5
United Arab Republic 1 9 8 1 0 8 9 1
Oceania
Australia 8 4 4 4 4 6 4
New Zealand 8 6 6 2 4 8 6
α From FAO Production Year Book ( 1 ) . All values in kilograms per capita per year.
tion and treatment of protein malnutrition in children (4-10). The avail- able data are briefly presented in this review.
I I . PLANT PROTEIN RESOURCES
Data regarding the national supplies of foodstuffs of plant origin per capita in certain countries of the world during 1962-1963 are given in Table I. The estimated production and availability of legumes are
T A B L E II
ESTIMATED PRODUCTION AND AVAILABILITY OF LEGUMES FOR HUMAN CONSUMPTION IN DIFFERENT COUNTRIES0-6
Total production Availability (thousand (grams per Country metric tons) day per capita)
Argentina 82 8.9
Australia 14 4.7
Austria 5 1.4
Belgium-Luxemburg 38 5.2
Canada 66 6.0
Ceylon 4 13.1
Denmark 36 11.2
Egypt 305 24.7
Finland 12 4.6
Germany, Federal Republic 15 4.8
Greece 107 30.1
Honduras 201 30.2
India 10617 60.8
Ireland 2 2.7
Israel 2 . 6 8.8
Italy 850 16.2
Netherlands 105 7.7
New Zealand 24 5.2
Norway 1 7.1
Pakistan 900 20.5
Philippines 40 5.3
Portugal 55 17.3
Switzerland — 5.8
Sweden 38 4.1
Turkey 282 2 6 . 3
Union of South Africa 58 5.3
United Kingdom 62 11.0
United States of America 914 10.6
Uruguay 3.7 5.0
° Exclusive of peanut and soybean.
6 From Patwardhan (11).
T A B L E I I I
ANNUAL PRODUCTION OF PEANUT, SOYBEAN, COTTONSEED, SESAME, COCONUT, AND SUNFLOWER SEED IN DIFFERENT COUNTRIES DURING 1 9 6 2 - 1 9 6 3A
Region and country
Peanut in shell
Soy
bean
Cotton
seed Sesame Coco
nut
Sun
flower seed Europe (excluding USSR) 3 0 1 5 4 4 0 1 0 — 1 2 0 0
USSR — — 2 8 0 7 — — 4 7 9 5
North America 8 2 0 1 8 4 0 0 5 5 3 0 1 — 8 Latin America 1 2 4 0 4 2 0 3 1 8 0 2 2 0 2 5 0 5 9 0
Near East 2 6 0 4 2 1 5 0 2 2 0 — 6 0
Far East (excluding China) 5 8 9 0 1 1 9 0 2 9 5 0 6 2 0 2 5 2 0 — China (mainland) 2 3 6 0 — 1 7 3 0 3 2 5 — 6 1
Africa 4 3 3 0 4 0 5 8 0 1 4 0 1 0 5 1 2 0
Oceania 1 7 — 4 — 2 8 0 —
World total 1 4 8 0 0 3 0 7 0 0 2 0 6 0 0 1 5 0 0 3 2 0 0 6 8 4 0 a From FAO Production Year Book (1). All values in thousand metric tons.
T A B L E I V
PROTEIN AVAILABLE FROM EDIBLE OILSEEDS"
Annual Average Available production protein protein
(thousand content (thousand Oilseeds metric tons) (%) metric tons)
Peanut 1 4 8 0 0 2 5 3 7 0 0
Soybean 3 0 7 0 0 3 8 1 1 6 6 6
Cottonseed 2 0 6 0 0 2 0 4 1 2 0
Sesame 1 5 0 0 2 5 3 7 5
Coconut 3 2 0 0 7 2 2 4
Sunflower seed 6 8 4 0 2 0 1 3 6 8 α World total for 1 9 6 2 - 1 9 6 3 .
given in Table II, and the estimated production of edible oilseeds and nuts in Table III. The available protein resources from oilseeds and nuts are given in Table IV. Data regarding the estimated contents of animal and vegetable protein in the national average food supplies per capita are given in Table V. The results are briefly discussed below.
A. Cereals and Millets
Cereals and millets contain moderate amounts of protein, varying from about 6 to 14%, depending on the grain. Consumption of cereals
is highest in the Near East, exceeding 160 kg per capita per year, fol
lowed by the Far East with 146 kg; it is lowest in North America and Oceania with about 70 kg and 90 kg, respectively. Africa and Europe use close to the world average of 134 kg, but more is consumed in eastern
TABLE V
PROTEIN CONTENT OF THE CURRENT FOOD SUPPLIES OF SELECTED COUNTRIES'1
Source of protein supply Protein content of current food supplies Pulses
Ce- Starchy and Vege- Vege-
Region and country reals roots nuts tables Total tables Animal Europe
Germany 22 7 1 2 79 33 46
Ireland 29 7 1 2 96 41 57
United Kingdom 25 4 3 2 86 35 51
North America
Canada 23 3 3 2 95 32 63
United States of America 15 2 5 4 92 27 65 Latin America
Argentina 34 3 1 2 98 41 57
Brazil 24 2 14 — 61 42 19
Mexico 33 — 13 1 68 48 20
Far East
Ceylon 27 1 16 2 45 36 9
China (Taiwan) 31 3 7 2 57 43 14
India 30 — 14 1 51 45 6
Japan 31 2 13 4 67 50 17
Pakistan 33 — 4 1 46 39 7
Philippines 26 2 2 3 47 34 13
Africa and Near East
Libya 34 1 4 2 53 43 10
South Africa 37 1 3 1 73 43 30
Turkey 61 2 7 3 90 75 15
United Arab Republic 51 — 7 3 76 63 13
Oceania
Australia 23 3 2 2 92 31 61
New Zealand 25 3 2 2 105 33 72
α From FAO (12). For years 1957-1959. All values in grams.
Europe [including the Union of Soviet Socialist Republic (USSR) ] than in the rest of Europe. The pattern varies from region to region and with
in regions. Thus, in the Far East rice is usually preferred, but, in parts of China, India, Ceylon, Pakistan, and Japan, wheat, corn, and millets are consumed, and, in parts of Indonesia, corn. The countries of the
Near East depend on wheat and to a lesser extent on millets, corn, and barley. In northern Africa the main cereal is wheat, in savannah areas of Africa, millets and corn, and in eastern Africa, corn. In Latin America corn is the main cereal, with wheat and rice used in small amounts.
B. Legumes
Legumes contain about 18 to 25% protein. Their consumption (Table II) in the countries of Asia, Africa, and South America is, in general, higher than that observed in the advanced countries of Europe, the United States of America, and Oceania. They contribute about 10 to 25% of the proteins in the diet, depending on the country.
C. Nuts and Oilseeds
With the exception of coconut, nuts and oilseeds are good sources of protein (18-27%). Data regarding the world production of important edible oilseeds and nuts are given in Table III. Only about 5 to 15%
is consumed as such in human diets, since the major portion is used for the production of oil. The residual oilseed meals which are rich sources of protein (22-50%) are at present used mainly as a concentrate for cattle, swine, and poultry, but recent investigations have shown that blends of oilseed meals after suitable processing and fortification could be used as supplements to the diets of weaned infants and preschool children (8-10). This subject is discussed under Section VI.
D. Vegetables
In general, vegetables contribute only small amounts of protein (2-4 gm) in the daily diet. Vegetable consumption in the developing countries is lower than that reported from well-developed countries. Green leafy vegetables are good sources of protein and other dietary essentials when consumed in adequate amounts (6). Potato contains on the moisture-free basis about 6 to 9% protein, and is consumed in considerable amounts in the countries of Europe, North America, and Oceania. Cassava and sweet potato, which have a low protein content, are used extensively in the Near East, Africa, and Latin America.
E. Leaf and Crass Proteins
Recent investigations have shown that protein isolates prepared from leaves and grasses are a useful supplement in human diets (6, 10). They yield larger amounts of protein (in pounds per acre) than other foodstuffs of vegetable origin, e.g., 1250 lb from leaves, 370 lb from beans, and
269 lb from wheat. It will therefore be highly economical to manufacture leaf proteins for countries with large populations (13).
I I I . AMINO ACID COMPOSITION
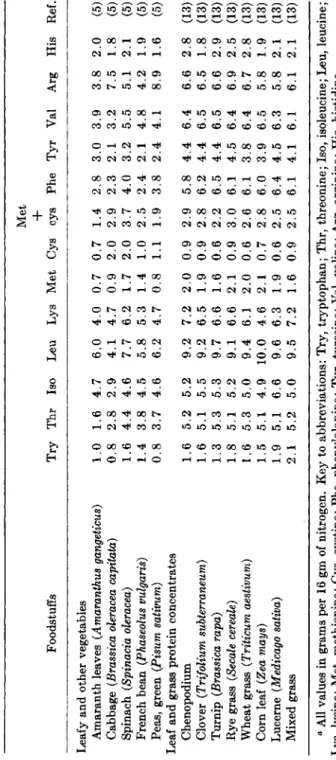
The essential amino acid composition of common foods of vegetable origin has been determined by many workers. The results were sum- marized by Block and Weiss (4), Orr and Watt (5), Kuppuswamy et al. (6), and Patwardhan and Ramachandran (7). The data given in Table VI are taken from the publication of Orr and Watt (5) and Kuppuswamy et al. (6). It is evident from Table VI that the limiting amino acids in different cereals and millets are lysine and threonine.
Corn is deficient also in tryptophan. The proteins of legumes are good sources of lysine and threonine, but deficient in sulphur amino acids and tryptophan.
The most important oilseeds and nuts are soybean, peanut, cotton- seed, sesame seed, coconut, and sunflower seed. Soybean proteins are rich in lysine and threonine, but deficient in methionine. Cottonseed and coconut proteins are deficient in lysine and methionine. Sesame and sunflower seed proteins are rich in sulphur amino acids and tryptophan, but deficient in lysine. Peanut proteins are deficient in lysine, methionine, and threonine. Of the vegetables, green pea protein is a good source of lysine, but deficient in methionine. The proteins of green leafy vege- tables are well balanced with respect to all essential amino acids except methionine, and those of other vegetables are deficient in one or more essential amino acids. Potato, yam, and cassava are deficient in sulphur amino acids and tryptophan, and Colocasia is deficient in sulphur amino acids. A considerable amount of work has been carried out recently on the amino acid composition of protein concentrates obtained from leaves and grasses (6, 13). From some of the available data presented in Table VI it is evident that these proteins are fairly well balanced except for methionine.
I V . NUTRITIVE VALUE
Toward the close of the last century it was realized that proteins in different foods have different nutritive values. Two methods are com- monly employed for the assessment of the nutritive value of dietary proteins, namely, the nitrogen-balance method and the rat-growth method. The former, within limitations, affords the advantage of furnish- ing data on both the biological value and the digestibility of the protein food. The rat-growth method, because of its greater ease, has been widely used by many workers to determine the protein efficiency ratio (PER).
Various workers have studied the following aspects of plant proteins:
T A B L E V I
AMINO ACID COMPOSITION OF SOME IMPORTANT PLANT PROTEINS'1 Met
+
Foodstuffs Try Thr Iso Leu Lys Met Cys cys Phe Tyr Val Arg His Ref.
Cereals and millets
Amaranth seeds (Amaranthus paniculatus) 0. 9 4. 4 6. 9 8. 0 8. 2 2. 5 2.2 4. 7 4. 8 3 . 3 6. 1 14. 8 2. 9 (5)
Barley (Hordeum vulgare) 1. 2 3. 2 4. 0 6. 5 3. 2 1. 3 2 . 9 3. 2 4. 8 3 . 4 4. 7 4. 8 1. 7 (5)
Buckwheat (Fagopyrum esculentum) 1. 4 3. 8 3. 8 5. 8 5. 9 1. 8 2 . 0 3. 8 3. 8 2.1 5. 2 8. 0 2. 2 (5)
Canihua (Chenopodeum pallidiculae) 0. 8 4. 8 6. 8 5. 8 6. 0 1. 8 1.1 2. 9 3. 6 2 . 0 4. 6 7. 9 2. 5 (5)
Corn (Zea mays) 0. 6 4. 0 4. 6 13. 0 2. 9 1. 9 1.3 3. 2 4. 5 6.1 5. 1 3. 5 2. 6 (5)
Corn germ 1. 0 4. 3 3. 9 7. 1 5. 5 1. 6 0.9 2. 5 3. 3 2 . 3 5. 4 7. ,8 3. 2 (5)
Kaffir corn (Sorghum vulgare) 1. 1 3. 6 5. 4 16. 1 2. 7 1. ,7 1.7 3. 4 5. 0 2 . 8 5. 7 3. ,8 1. 9 (5)
Italian millet (Seteria italica) 1. 0 3. 1 7. 6 16. 1 2. 1 2. .8 •— 6. .7 — 6. 9 3. 6 2 1 (5)
Job tears (Coix lacryma-jobi) 0. 5 4. 2 5. 6 23. ,7 2. 5 3 1 1.8 4. 9 4. 8 — 3. 5 2. 1 (5)
Kodra (Paspalum scrobiculatum) 0, ,7 3. .8 6 5 9. ,7 2. .7 3 .0 — 8. .0 — 6. 5 4 .4 1 .9 (5)
Little millet (Panicum miliare) 0 .6 3 .4 6 .7 10 .9 1 .8 2 .3 — 4. ,8 — 6. 1 4 .7 1 .9 (5)
Oats (Avena sterilis) 1 .2 3 .1 4 .8 7, .0 3 .4 1 .4 2 . 0 3 .4 4 .9 3 . 4 5. .6 6 .1 1 .7 (5)
Quinoa (Chenopodium quinoa) 1 .1 4 .8 6 .6 7, .1 6 .6 2 .5 1.0 3 .5 3. ,6 2 . 3 4. .1 7, .5 2 .7 (5)
Ragi (Eleusine coracana) 1 .3 4 .1 6 .0 9 .3 3 .0 4 .1 2 . 8 6 .9 4. .0 5.3 7. 1 1 .5 1 .2 (5)
Rice (Oryza sativa) 1 .0 3 .7 4 .5 8 .2 3 .8 1 .7 1.3 3 .0 4, .8 4 . 4 6, .7 5 .5 1 .6 (5)
Wheat, whole (Triticum vulgare) 1 .2 2 .7 4 .1 6 .3 2 .6 1 .4 2.1 3 .5 4. .6 3 . 5 4. 3 4 .5 1 .9 (5)
Wheat germ 1 .0 4 .9 4 .3 6 .3 5 .7 1 .5 1.1 2 .6 3 .3 3 . 3 5 .0 6 .7 2 .5 (5)
Legumes (dry seeds)
Black gram (Phaseolus mungo) 1 .0 3 .4 5 .9 8 .7 6 .4 1 .4 1.2 2 .6 5 .3 2 . 3 6 .1 6 .6 2 .4 (5) (5)
Broad bean (Vicia faba) 0 .9 3 .3 6 .3 8 .7 5 .6 0 .4 0.7 1 .1 4 .2 4.7 5 .0 7 .0 2 .9 (5)
Chick-pea (Cicer arietinum) 0 .8 3 .6 5 .7 7 .4 6 .9 1 .3 1.4 2 .7 4 .9 3 . 3 4 .9 7 .5 2 .7 (5)
Cowpea (Vigna app) 1 .0 3 .9 4 .9 7 .5 6 .5 1 .5 1.3 2 .8 5 .2 3 . 0 5 .7 6 .4 3 .0 (5)
Field bean (Dolichos lab lab) 0 .5 3 .3 6 .0 8 .9 8 .1 0 .7 1.0 1 .7 5 .3 — 5 .6 9 .2 2 .8 (14)
Green gram (Phaseolus radiatus) 0 .7 3 .1 5 .5 9 .0 6 .8 1 .1 0.6 1 .7 4 .8 1.6 5 .9 5 .6 2 .2 (5)
Horse gram (Dolichos biflorus) 1 .0 3 .9 6 .7 7 .9 7 .9 1 .4 2.2 3 .6 6 .9 2.6 5 .9 5 .7 3 .0 (5)
4 M. SWAMINATHAN
Kidney bean (Phaseolus vulgaris) 1 .1 3 .5 4.9 7 .7 9 .2 1 .0 5 .3 5 .9 5.9 2 .4 (15) Lentil (Lens esculentus) 0 .9 3 .6 5.3 7. .0 6 .1 0 .7 0 .6 1 .5 4 .4 2 .7 5 .4 7.6 2 .2 (5) Lima bean (Phaseolus lunatus) 0 .9 4 .7 5.8 8. .3 6 .6 1 .6 1 .5 3 .1 5 .9 2 .6 6 .3 6.4 3 .2 (5) Navy bean (Phaseolus vulgaris) 5 .2 4.8 8 .0 7 .9 1 .2 6 .1 6 .4 6.9 2 .9 (16) Pea (Pisum sativum) 1 .1 3 .9 5.6 8 .3 7 .3 1 .2 1 .3 2 .5 5 .0 4 .0 5 .6 8.8 2 .7 (5) Pinto bean (Phaseolus vulgaris) 1 .0 4 .3 5.7 8 .2 6 .8 1 .0 6 .2 6 .2 5.4 2 .9 (17) Red gram [Pigeon pea (Cajanus cajan)] 0 .5 3 .8 6.1 7 .8 7 .1 1 .2 1 .4 2 .6 8 .6 3 .3 5 .3 6.8 2 .8 (5) Oilseeds and nuts Almond (Prunus amygdalus) 0 .8 2 .7 3.9 6 .5 2 .6 1 .2 1 .7 2 .8 5 .1 2 .8 5 .0 12.2 2 .3 (5) Brazil nut (Bertho lettia excelsa) 1 .1 2 .6 3.6 6 .9 2 .7 5 .7 3 .1 8 .8 3 .7 2 .9 5 .0 13.6 2 .2 (5) Cashewnut (Anacardium occidentale) 2 .2 3 .4 5.6 7, .0 3 .6 1 .6 2 .4 4 .0 4 .3 3 .3 7 .3 9.6 2 .0 (5) Coconut (Cocos mucifera) 0 .8 3 .2 4.5 6 .7 3 .8 1 .8 1 .6 3 .3 4 .3 2 .5 5 .3 12.1 1 .7 (5) Cottonseed (Gossypium herbaceum) 1 .2 3 6 3.8 5 9 4 .3 1 .4 1 .6 3 .0 5 .2 2 .7 4 .9 11.2 2 .7 (5) Chinese tallow-tree nut (Sapium sebiferum) 1 .2 3 .2 5.2 6 .4 2 .4 1 .4 1 .0 2 .4 4 .2 3 .0 6. .6 14.8 2 .3 (5) Filbert nut (Corylus avellana) 1 .4 2 .8 5.7 6 3 2 .8 0 .9 1 .1 2 .0 3 .6 2 .9 6. 2 14.5 1 9 (5) Peanut (Arachis hypogea) 1 .1 2 .7 4.1 6 .1 3 .6 0 .9 1 .5 2 .4 5 .1 3 .6 5 0 10.7 2 .4 Pecans nut (Carya pecan) 1 .3 3 .5 5.0 7, .2 3 9 1 .4 2 .0 3 .4 5 .1 2. .9 4. .7 10.7 2 .5 (5) Safflower seed (Carthamus tinctorius) 1 .4 2 .9 3.9 5 .5 3 .1 1 .5 5 .3 4. ,9 9.3 2 0 (5) Sesame seed (Sesamum indicum) 1 .5 3 .1 4.2 7. 4 2 6 2 .8 2 .2 5 .0 6 .4 4. 1 3. 9 8.8 1. 9 (δ) Soybean (Glycine max) 1 .4 3 .9 5.4 7. .7 6 .3 1 .3 1 .8 3 .1 4. .9 3. 2 5. 3 7.2 2. 4 (5) Sunflower seed (Helianthus annus) 1 .3 3 .4 4.7 6. A 3 2 1 .6 1 .7 3 .3 4. .5 2. 4 5. 0 8.7 2. 2 (5) Walnut (Juglans regia) 1 .0 3 .3 3.3 5 .3 2 .5 1 .7 1 .8 3 .5 4. 3 3. 3 5. 5 9.7 2. 3 (5) Roots and tubers Carrot (Daucus carota) 0. .8 3. 6 3.8 5. 4 4. 3 0. 9 2. 5 3. 3 3. 5 1. 7 4. 7 3.5 1. 4 (5) Colocasia (Taro) 2. 4 4. 7 5.2 8. 9 5. 8 1. 1 5. 2 6. 0 6.2 1. 7 (5) Onions (Allium cepa) 1. 5 1. 6 1.5 2. 6 4. 5 1. 0 2. 8 3. 3 2. 2 12.8 1. 0 (5) Potato (Solanum tuberosum) 1. 1 3. 9 4.4 5. 0 5. 3 1. 3 1. 0 2. 2 4. 4 1. 8 5. 3 4.9 1. 4 (5) Radish (Raphanus sativus) 0. 4 4. 9 — 2. 8 0. 1 2. 5 — (5) Sweet Potato (Ipomoea batatas) 1. .7 4. 7 4.8 5. 7 4. 7 1. 9 1. 6 3. 5 5. 6 4. 5 7. 5 5.2 2. 0 (5) Tapioca (Cassava) 1. 3 2. 8 2.8 4. 1 4. 1 0. 6 1. 1 1. 7 2. 8 1. 9 3. 0 10.0 1. 5 (5) (Continued
TABLE VI (Continued) Met Foodstuffs Try Thr Iso Leu Lys Met Cys cys Phe Tyr Val Arg His Ref. Leafy and other vegetables Amaranth leaves (Amaranthus gangeticus) 1 .0 1 .6 4 .7 6 .0 4 .0 0, .7 0 .7 1 .4 2.8 3. .0 3. .9 3 .8 2 .0 (5) Cabbage (Brassica oleracea capitata) 0 .8 2 .8 2 .9 4 .1 4 .7 0 .9 2 .0 2 .9 2.3 2. .1 3 2 7. 5 1 .8 (5) Spinach (Spinacia oleracea) 1 .6 4 .4 4 .6 7 .7 6 .2 1 .7 2 .0 3 .7 4.0 3 .2 5 .5 5 .1 2 .1 (5) French bean (Phaseolus vulgaris) 1 .4 3 .8 4 5 5 .8 5 .3 1 .4 1 .0 2 .5 2.4 2 .1 4 .8 4 .2 1 .9 (5) Peas, green (Pisum sativum) 0 .8 3 .7 4 .6 6 .2 4 .7 0 .8 1 .1 1 .9 3.8 2 4 4 .1 8. .9 1 .6 (5) Leaf and grass protein concentrates Chenopodium 1 .6 5 .2 5 .2 9 .2 7. .2 2 .0 0 .9 2 .9 5.8 4 4 6 .4 6 .6 2 .8 (13) Clover (Trifolium subterraneum) 1 .6 5 .1 5 5 9 .2 6 .5 1 .9 0 .9 2 .8 6.2 4. .4 6. .5 6 .5 1 .8 (13) Turnip (Brassica rapa) 1 .3 5 3 5. .3 9, .7 6 6 1 6 0, 6 2 .2 6.5 4. 4 6 .5 6 .6 2 9 (13) Rye grass (Secale cereale) 1 .8 5. 1 5. 2 9. .1 6, ,6 2. 1 0. .9 3, ,0 6.1 4. 5 6. 4 6. 9 2 ,5 (13) Wheat grass (Triticum aestivum) 1. 6 5. 3 5. 0 9. 4 6. 1 2. 0 0. 6 2. 6 6.1 3. 8 6. 4 6. 7 2. ,8 (13) Corn leaf (Zea mays) 1. .5 5. 1 4. 9 10. .0 4. 6 2. 1 0. ,7 2. ,8 6.0 3. 9 6. 5 5. 8 1. 9 (13) Lucerne (Medicago sativa) 1. 9 5. 1 6. 6 9. 6 6. 3 1. .9 0. 6 2. 5 6.4 4. 5 6. 3 5. 8 2. 1 (13) Mixed grass 2. 1 5. 2 5. 0 9. 5 7. 2 1. 6 0. 9 2. 5 6.1 4. 1 6. 1 6. 1 2. 1 (13) a All values in grams per 16 gm of nitrogen. Key to abbreviations: Try, tryptophan; Thr, threonine; Iso, isoleucine; Leu, leucine; Lys, lysine; Met, methionine; Cys, cystine; Phe, phenylalanine; Tyr, tyrosine; Val, valine; Arg, arginine; His, histidine.
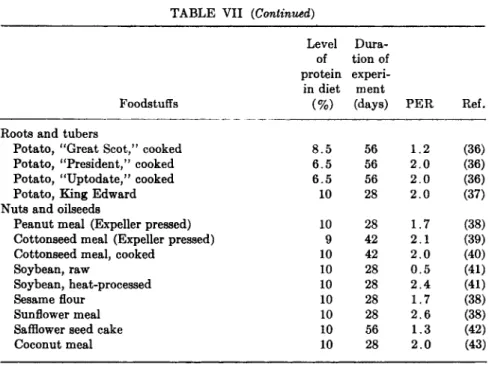
(a) factors affecting their nutritive value, (b) mutual supplementation, and (c) amino acid supplementation. The available data are briefly summarized in this section. Data regarding the PER of different plant proteins are given in Table VII.
A. Factors Affecting the Nutritive Value of Plant Proteins
1. Trypsin and Growth Inhibitors and Other Toxic Factors These substances are present in a large number of foods (44-47), and exert a deleterious effect on the utilization of proteins and the growth of animals. Optimal heat treatment has been found to destroy the trypsin and growth inhibitors in most foods. This aspect is discussed further in Section IV,A,4.
2. Amino Acid Deficiencies, Imbalance, Toxicity, and Antagonism Partial deficiency of any one essential amino acid affects adversely the utilization of proteins for the maintenance of nitrogen equilibrium and growth. Certain amino acids when present in quantities that greatly exceed the requirements, adversely affect the growth of animals. These effects have been ascribed to (a) amino acid imbalance, (b) amino acid toxicities, and (c) amino acid antagonism (48). Amino acid imbalance may be defined as a condition in which an increase in the concentration of certain amino acids brings about an increase in the amount of other amino acids needed to maintain a given growth rate when the total protein intake is low (49). In a 2-week study using wheat gluten, the requirements for lysine as a percentage of the diet and the total amount of lysine required to support maximal growth were both increased (50).
The quantity of excess amino acid required to cause toxicity varies greatly (48). Methionine, cystine, tyrosine, tryptophan, and histidine, present in excess quantities, are more toxic than arginine, lysine, threonine, isoleucine, and valine (51, 52). The signs and symptoms of toxicity include depression in growth, increased mortality, and histologi- cal changes in liver, skin, and pancreas. In amino acid antagonism, excess of one amino acid depresses the utilization of a structurally similar amino acid; e.g., excess of leucine depresses the utilization of isoleucine, as in corn proteins (53), and excess of lysine depresses the utilization of arginine (54).
3. Amino Acid Availability
This depends on (a) the digestibility coefficient of a protein, and (b) the rate of release of amino acids during digestion. There is evidence that some of the essential amino acids present in proteins may not be
T A B L E V I I
PROTEIN EFFICIENCY RATIO OF CERTAIN PLANT PROTEINS
Level Dura
of tion of protein experi
in diet ment
Foodstuffs (%) (days) PER Ref.
Cereals
Rice, husked (Oryza sativa) 10 28 2.0 (18)
5 70 1.9 (19) 6 70 1.8 (20) Wheat, whole (Triticum vulgare) 5 70 0.9 (21) 9 70 1.1 (21) Wheat, whole, hard spring (Triticum vulgare) 5 42 1.7 (22) 10 42 1.6 (22)
Wheat germ 10 42 2.5 (23)
Buckwheat, whole groats (Fagopyrum esculentum) 8 30 2.5 (24) 13 30 2.1 (24)
Kaffir corn (Sorghum vulgare) 5 28 0.9 (25)
8 56 1.2 (26) 10 28 2.0 (18)
Oats, rolled (Avena sterilis) 5 42 2.2 (22)
10 42 2.5 (22) Pearl millet (Pennisetum typhoideum) 5 28 1.3 (25) 10 56 1.4 (18)
Ragi (Eleusine coracana) 5 28 1.0 (25)
Barley, pearled (Hordeum vulgare) 5 42 1.6 (22) Barley, meal (Hordeum vulgare) 9 30 2 . 0 (20)
Rye, whole (Scale cereale) 5 42 2.3 (22)
8 42 2.2 (22) 10 42 1.8 (22) Italian millet (Setaria italica) 10 28 0.8 (7) Little millet (Panicum miliare) 10 28 1.1 (7)
Corn, whole, white (Zea mays) 9 63 1.3 (27)
Corn, whole, yellow (Zea mays) 5 70 0.5 (21) 7 70 0.9 (21) 8 42 1.2 (28) Legumes
Chick-pea, cooked (Cicer arietinum) 10 10 1.8 (29) Black gram, autoclaved (Phaseolus mungo) 12 40 1.6 (30) Green gram, cooked (Phaseolus aureus) 10 28 1.5 (18) Horse gram, autoclaved (Dolichos biflorus) 12 37 1.7 (30) Red gram, cooked (Cajanus cajan) 10 28 1.7 (18) Lathyrus pea, autoclaved (Lathyrus sativus) 12 21 0 . 4 (31) Kidney bean, cooked (Phaseolus vulgaris) 10 30 1.5 (32) Lima bean, autoclaved (Phaseolus lunatus) 10 56 1.2 (33) Lentil, cooked (Lens culinaris) 10 30 1.2 (32)
Pea, cooked (Pisum sativum) 10 56 1.0 (34)
Pea, raw [Alaska (Pisum sativum)] 10 42 1.3 (35)