Periodic price reductions, or price promotions, constitute a widely observed phenomenon in retail- ing. It is difficult to overstate the importance of price promotions from both the retailer (recent estimates for USA show 58% of all retailer marketing expenditures going for sales promotions, Allender and Richards 2012) and the consumer points of view. Sales oc- cur on a regular basis, which suggests that they are not entirely due to random variations such as the shocks to inventory holdings or demand. In recent years, the frequency of periodic price reductions has increased, indicating that the price promotion has become more important for retailers and consum- ers. Assuming that consumers have some familiarity with the complex pricing strategies employed by the supermarkets, during the past decades a number of competing sale theories were developed to explain discounts and price dispersion (e.g. Salop and Stiglitz 1982; Varian 1980; Sobel 1984; Pesendorfer 2002).
Many recent papers suggest that most of the retail price variation can be explained by the temporary price reductions (e.g. Hosken and Reiffen 2004; Li et al. 2005). Yet the recently developed theories of sales often provide conflicting predictions for many aspects of price promotions (e.g. timing of sales, whether
manufacturers or rather retailers decide on sales, pricing strategies followed by retailers etc.). Despite of its growing importance – especially when food products are considered – only a limited number of empirical papers focused on sales and their impact upon retail prices (e.g. MacDonald 2000; Pesendorfer 2002; Chevalier et al. 2003; Berck et al. 2008). The choice of a food item of the above mentioned papers reflects the need of an universally available homog- enous product such as orange juice (e.g. Dutta et al. 2002; Berck et al. 2008) or ketchup (Pesendorfer 2002). Although included in baskets of the analysed food items by few papers (e.g. Carman and Sexton 2005; Eichenbaum et al. 2008), we could not find examples in the international literature specifically focusing on the milk price promotions. Most of the related studies employing milk price data focuses on analysing the effects of the milk promotion programs (generic milk advertising), see for example Lenz et al.
1988 or more recently, Gvillo et al. 2014 or Tikkanen 2015. Albeit milk consumption in Hungary follows a decreasing trend, from around 170 litres in 2009 to 155 litre in 2014 for those regularly consuming milk (equivalent of 53 litres/cap in 2009 and slightly below 50 litres/cap in 2013 when the total population
Empirical tests of sale theories: Hungarian milk prices
Zoltán BAKUCS
1,2, Imre FERTŐ
1,2,31Institute of Economics, Centre for Economic and Regional Studies, Hungarian Academy of Sciences, Budapest, Hungary
2Corvinus University of Budapest, Budapest, Hungary
3University of Kaposvár, Kaposvár, Hungary
Abstract: Th e paper tests various predictions of the sale theory literature, using the retailer specifi c price data in Hungary.
Besides being set in a New Member State, characterised by rather diff erent history of retailing than the established market economies, one of the main innovations of this paper is the comparative assessment of price promotions of two homoge- nous, every-day products diff erent only with respect to their perishability: one litre boxed and one litre durable fl uid milk.
Using a battery of empirical techniques from the simple summary statistics, the distribution analysis to the discrete choice models and the co-integration, there is concluded that competing theory predictions on price distributions are not accep- ted. Also the Hypothesis that manufacturers determine timing of sales is rejected. Th e results do not confi rm that durable goods should have a qualitatively diff erent pricing pattern than perishable products. When the temporal order of sales is considered, the estimations support the Hypothesis of alternate sales. In sum, the predictions of the existing retail sales models only partly confi rm certain empirical aspects of price promotions.
Key words: chain level prices, milk products, price promotion, sale theories
is considered1), the boxed and UHT (durable)2 milk still constitute important staples in the populations’
diet. More, milk is considered to be often used (along with the in-store fresh bakery products) as a cos- tumer attractor by retailers. The fact that the same product, fluid milk, is available in the perishable and durable form alike makes it an attractive subject for testing empirically the predictions of the existing sale theories. To achieve this, we use a wide range of quantitative techniques from simple descriptive statistics to the correlation analysis of retail specific prices, the causality analysis, discrete choice models, the co-integration and panel co-integration. Whilst the literature on price promotions is abundant, to the best of our knowledge, there is no published research focusing on empirical testing of sale hypotheses in a Central East European Country, with a history of the modern type retailing dating back only 25 years.
COMPETING PRICE PROMOTION THEORIES
Starting with earlier papers, one stream of research describes the sales phenomena as a temporary price discrimination, explained by alternating consumer preferences and tastes, otherwise defined as the im- perfect knowledge on prices (Salop 1977; Salop and Stiglitz 1982). Research papers emphasise, that firms are motivated to apply the price discrimination, since some consumer groups are purchasing larger quan- tities when prices are low, and store them at home, whilst the consumers with a higher willingness to pay make purchases according to their immediate needs (Conlisk et al. 1984; Sobel 1984; Pesendorfer 2002).
Other branch of the literature considers firms fol- lowing a mixed strategy in order to determine prices (Shilony 1977; Varian, 1980; Lal 1990; Lal and Villas- Boas 1998). Most theoretical models within this group assume there are at least two or more different types of consumers, characterised by varying search costs.
Several papers have highlighted the importance of search costs. As an example, Seiler (2012) found that in 70% of shopping trips, consumers are not aware of competing prices because of the search costs.
Applying a counterfactual exercise, Seiler (2012) suggests that should the search costs be halved, the
elasticity of demand may experience a threefold in- crease. Generally, the literature considers the search cost of well-informed consumers being zero, whilst others facing substantial search costs. A number of empirically testable hypotheses may result from the sale theories. The paper closest to our research is Berck et al. (2008), empirically testing sale theories using the retail chain specific price data of the frozen and refrigerated orange juice, somewhat similar to the boxed and storable milk employed in this study. Thus in the following sections, we follow their example by briefly discussing the theory and empirical examples from the literature (where applicable) than formulate the hypotheses to be tested.
Shilony (1977) and Varian (1980) discuss a static sales model with retailers pursuing a mixed strategy.
In this model, sales are explained by the differences with respect to how well informed the consumers are. Since the consumers with a high willingness to pay make immediate purchases, the retailers com- pete for the costumers only willing to buy when the prices are low. Thus the oligopolistic retailers offer homogenous products for sale, using a mixed strategy by determining the temporary low prices at a level that attracts these costumer groups. If we consider the process as a game, and repeat it independently during a number of periods, than the mixed strategy results an explicit price oscillation with a continuous probability distribution. Facing competition, firms are more likely to drop prices, rather than to follow a price discrimination strategy. Thus the following hypotheses arise:
Hypothesis 1. Price promotions induce specific price distribution on the market
Hypothesis 1a. The distribution of prices is continu- ous (most likely bell shaped)
Conlisk et al. (1984), shows that the sales of durable (e.g. UHT milk) products can be a useful tool of the price discrimination against eager costumers char- acterised by an inelastic demand. In the monopolies model of Conlisk et al. (1984), the retailers employ a cyclical pricing strategy. Periodical discounts are aimed at the consumers with relatively low reservation prices, whilst the periods characterised by high prices are for the consumers with relatively high reservation prices. Other relevant research (e.g. Stokey 1979 and 1981) analyses the temporary price drops, i.e. the inter-
1Data from Hungarian Central Statistical Agency.
2Throughout this paper, we use boxed and perishable milk as synonyms. Similarly, UHT, storable and durable milk are also interchangeable terms is this research.
temporary price discrimination of durable products.
These models, however, do not explain the phenomena of temporary price promotions. Sobel (1984) augments the Conlisk et al. (1984) model with a fixed number of retailers, offering homogenous products. Here, the consumers differ from each other with respect to their preferences towards the homogenous product.
In every period they enter, purchase the product, and then leave the market. Sellers adjust prices to their will, maintaining a high price level for most of the period, however, occasionally discounting prices in order to fulfil the needs of the relatively numerous group of the low reservation price costumers. The crucial assumption of the model is that the consumers possess different rates of shopping time preferences that correlate with the intensity of their preferences.
Another important characteristic of the model is that all retail units drop their prices simultaneously to the very same level. At the beginning, the retailers set prices to higher levels and focus on loyal customers with high storage costs3. As the time passes, a sig- nificant number of customers with low storage costs enter the market, therefore it is profitable to discount prices and compete for these costumers. The prices are then increased again, and a new cycle begins.
Further, in the Pesendorfer’s (2002) model two distinct groups of costumers are assumed. The first group consumes a unit of product in every period, and does not store it, whilst the second group stores the product, and consumes it when the prices are high.
Those who store, only purchase the product if the price falls below a certain threshold. We formulate the next Hypothesis as:
Hypothesis 1b. Prices have a smooth distribution with a mass point at the highest price
Most price discrimination and sale models are rooted in the games theory and implicitly or explic- itly assume the price discounts being determined at the manufacturer level. The massive concentration process of the retailing sector during the past two decades emphasised the increasing market power of retailers with respect to the processors, casting some doubts with respect to this assumption. More, the empirical results of Villa-Boas (2007) and Berck et al. (2008) show that it is more likely for the retailers to determine prices rather than the manufacturers.
Further, Lal (1990) and Pesendorfer (2002) conclude that processors motivations’ to initiate price pro-
motions at the retail level is rather weak, and thus potentially easily ignored. Thus we expect to reject the Hypothesis defined as:
Hypothesis 2. Retail prices are more likely to be determined by processors rather than retailers
There are a number of competing theory predic- tions with respect to the timing of sales by retail- ers. According to Shilony (1977) and Varian (1980), timing of sales is random between competing firms.
Pesendorfer (2002) predicts that the probability of price promotions increases with the time passed since the last sale, whilst Sobel (1984) suggests that the retailers drop their prices simultaneously. In addi- tion, it is an interesting question whether the retailers follow each other’s price promotions. The question we ask is, does the timing of sales at a given retailer influence the decision of a competing outlet to go on the sale with the respective product? Accordingly, we formulate four hypotheses with respect to the timing of sales across firms:
Hypothesis 3a. Timing of sales is random between competing firm
Hypothesis 3b. The probability of discounts increases with the time passed since the last sale action
Hypothesis 3c. The timing of sales at a given retailer influences the timing of competing retailers
Hypothesis 3d. Retailers drop their prices simul- taneously
Should indeed the processors rather than retailers determine price discounts, and the price sensitive consumers prefer certain brands, then the periodical, however rare, price promotions squeeze these con- sumers out of the market, shifting their preferences towards purchasing durable goods (should they exist).
Such a strategy is not acceptable for those costumers, which cannot store products at home. In the Varian’s (1980) model, the timing of sales for the homogenous, not durable products is considered to be random. The theories of Sobel (1984) and Pesendorfer (2002) state with respect to durable goods that the price changes are predictable, thus at first a smooth price decrease is experienced, followed by a sudden increase, and the cycle re-begins. In addition, Pesendorfer (2002) concludes that the probability for durable goods to go on sale increases with the time passed since the last discount. Thus our last Hypothesis aims to test:
Hypothesis 4. The price distribution may vary with durability of goods
3The storage costs and their implication upon consumer demand and retailer pricing strategy is emphasized (amongst others) by Bell and Hilber (2006).
RESULTS AND DISCUSSION
For the empirical application, we use data supplied by the Research Institute of Agricultural Economics (RIAE). The weekly retail prices for 1 litre (2.8% fat) boxed milk and 1 litre (2.8% fat) durable UHT milk observed in 8 major retail chains (Auchan, CBA, Coop, Cora, Interspar, Metro, Plus, Tesco) are used for the empirical analysis. The time span is between January 2005, and 36th week of 2008, totalling 192 observations per product and retail chain.
Empirical approaches of sales analysis
Since the data does not come labelled depending whether in a given period the price is a sale price or regular price, we first need to define these terms.
Following the empirical literature (e.g. Lloyd et al.
2009), we define the regular price for a specific good as its modal price during the analysed period. This approach implicitly assumes that a product has a single regular price each period. To compare price variation within and across categories, it is useful to divide a specific product’s price by a measure of the respective price’s central tendency. The fact that the empirical distributions have significant mass points suggests that the appropriate measure of the central tendency is a product’s annual mode. Therefore, we define the scaled prices ( ) as:
mod , j
jt
jt r
P r
where rjt is the price (as reported by the RIAE) of product j in the week t, and rj, mode is the modal rice of product j in the year that contains the week.
The next step is to assess, whether most price re- ductions are indeed temporary (see Pesendorfer 2002;
Hosken and Reiffen 2004; Berck et al. 2008). Thus we examine the price changes between the week t and t + 1, conditional on price falling between weeks t − 1 and t. If a price reduction is temporary rather than permanent, then the price would rise between the week t and t + 1. Contrary, if the price change between the weeks t and t + 1 is zero (or negative), it would suggest that the retail price movement re- flects a permanent change in the retailer’s cost (and/
or the manufacturer’s cost), thus the price decrease is permanent.
Table 1 shows that most of the time, price reduc- tions are followed by price increases, for both boxed and storable milk products (43–48%).
These results help us to create a useful definition of sales. Following Hosken and Reiffen (2004), we define a sale as occurring if the price falls by at least some fixed percentage (10 or 20%) between the periods t – 1 and t and then rises by at least that percentage between the period t and t + 1. Table 2 presents the frequency of sales using 10 and 20% threshold values.
With 10% threshold 7–8 percent of observations may be classified as sales. This falls to a fraction, if the 20% threshold is considered.
Hypotheses tests
With respect to Hypothesis 1, Figures 1 and 2 pres- ent the frequency distribution of the scaled boxed and durable milk prices. It is clear, the distribution is not bell shaped (Hypothesis 1a), and the mass point of prices is below the mode (Hypothesis 1b). Formal testing of the normal probability density distribution results chi(2) = 763.2 (p = 0.00) and chi(2) = 447.2 (p
= 0.00) for boxed and durable milk prices respectively.
The second Hypothesis we test is whether indeed the processors rather than retailers determine the timing of price promotions. For a direct Hypothesis testing we would need the milk processor prices by the retail chain, which are not available, thus we follow an indirect approach4. If the processors determine the timing of sales, we expect these to occur in each retail chain independently, i.e. we expect low correlation Table 1. Direction of price changes following a price drop
% of observations when there is price
increase there is no change following a price fall
Durable milk 43,7 36,2
Boxed milk 48,3 31,3
Source: Own calculations, data from the RIAE
Table 2. Percent of sales in the total observations using a 10 and 20% threshold respectively
Threshold 10 % 20 %
Boxed milk 7.8 1.6
Durable milk 7.3 0.0
Source: Own calculations, data from the RIAE
4Our approach is somewhat similar to Carman and Sexton (2005) focusing on retailers’ competition with respect to fluid milk pricing.
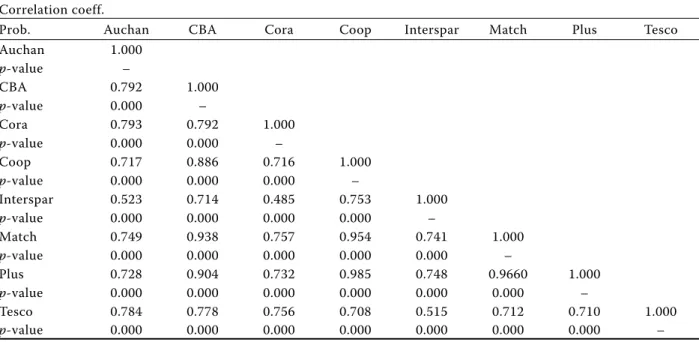
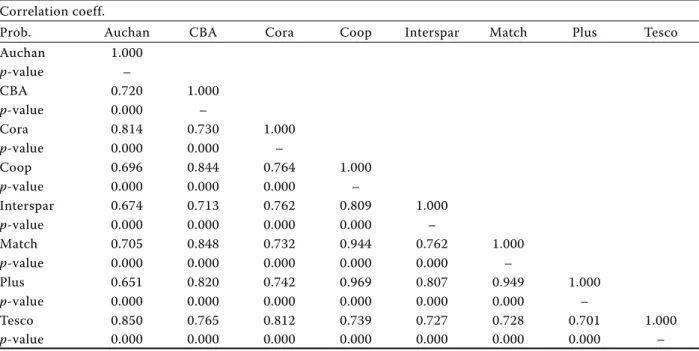
coefficients between the chain specific milk prices. If, however, the retailers decide when the boxed or UHT milk goes on sale, because of the competition, higher correlation coefficients are expected. Tables 3 and 4 present the correlation coefficients of the boxed and durable milk prices among the retailers. As expected, the coefficients are positive, significant and relatively high albeit of a different magnitude. For example, in the case of the boxed milk prices it ranges between 0.48 (Interspar and Cora) to 0.98 (Plus and Coop).
Irrespective whether we consider the boxed or du- rable milk prices, two clusters of retail outlets can be identified. The first cluster, displaying a strong price correlation (above 90%), includes smaller-sized
supermarkets, mostly located in urban centres: the Coop, Match, CBA and Plus. Although all retail chains make an effort to publicise their sales promotions, most importantly through leaflets and throwaways delivered at the doorstep, the results emphasise the importance of the physical distance between the stores, with respect to the price discovery (lower search costs for shoppers). Milk prices of larger super and hypermarkets, less centrally located (Tesco, Auchan, Cora, Interspar) form the second cluster, displaying a weaker correlation. The lower correlation coefficients observed for the second cluster (where larger stores belong) may be explained by the higher search costs the costumers need to pay in order to compare prices.
Figure 1. Frequency distribution of the boxed milk prices Source: Own calculations, data from the RIAE
Figure 2. Frequency distribution of the durable milk prices Source: Own calculations, data from the RIAE
Table 3. Boxed milk price correlation coefficients Correlation coeff.
Prob. Auchan CBA Cora Coop Interspar Match Plus Tesco
Auchan 1.000
p-value –
CBA 0.792 1.000
p-value 0.000 –
Cora 0.793 0.792 1.000
p-value 0.000 0.000 –
Coop 0.717 0.886 0.716 1.000
p-value 0.000 0.000 0.000 –
Interspar 0.523 0.714 0.485 0.753 1.000
p-value 0.000 0.000 0.000 0.000 –
Match 0.749 0.938 0.757 0.954 0.741 1.000
p-value 0.000 0.000 0.000 0.000 0.000 –
Plus 0.728 0.904 0.732 0.985 0.748 0.9660 1.000
p-value 0.000 0.000 0.000 0.000 0.000 0.000 –
Tesco 0.784 0.778 0.756 0.708 0.515 0.712 0.710 1.000
p-value 0.000 0.000 0.000 0.000 0.000 0.000 0.000 –
Source: Own calculations, data from the RIAE
To conclude, it seems more likely that the retailers rather than the processors determine the timing of sale promotions, by keeping an eye on their direct competitors’ prices.
Next, we test the hypotheses with respect to the timing of sales. Strong correlation coefficients in Tables 3 and 4 reject the Hypothesis 3a, stating that the sale promotions are random events. In order to analyse how the past price promotions influence the present price drops (Hypothesis 3b. Past discounts determine present price promotions), we use a Probit regression. The dependent variable takes the value of 1, if in the corresponding week the product is on sale, and 0 otherwise. The main explanatory variable is the number of weeks elapsed between two price promotions. To account for the possible retail chain specific effects, the retail chain dummy variables were also included in the Probit regression. These
dummy variables however proved to be insignificant, neither did they change the results. The simple, sig- nificant model is presented in Table 5. The sign of the coefficient is negative for boxed and positive for the durable milk. The negative sign observed in the boxed milk regression emphasises that as the number of weeks between two price promotions increases, it is less likely for a price discount to happen in the given retail chain at the given week. The reason might be the rare occurrence of sale promotions (see Table 2), thus, if in the past a retail chain rarely went on sale with the boxed milk, then it is less likely to do so at present. However, we find a positive and significant coefficient of the explanatory variable for the durable milk confirming the Hypothesis 3b.
To sum up, similarly to the findings of Berck et al.
(2008), our results only partly support Pesendorfer’s (2002) predictions that the probability of price pro- motions increases with the time passed since the last sale, also emphasising some differences between the perishable and durable milk prices.
To assess Hypothesis 3c, we analyse whether the retail chains influence each other’s boxed and durable milk prices by estimating the Vector Auto Regression (VAR) models, followed by the Granger causality tests. Table 6 presents the causality results for the boxed milk prices, whilst Table 7 for the durable milk prices. The lag length was selected by the AIC information criteria, and it is ranging between 1 and 3 weeks.
Table 4. Durable milk price correlation coefficients Correlation coeff.
Prob. Auchan CBA Cora Coop Interspar Match Plus Tesco
Auchan 1.000
p-value –
CBA 0.720 1.000
p-value 0.000 –
Cora 0.814 0.730 1.000
p-value 0.000 0.000 –
Coop 0.696 0.844 0.764 1.000
p-value 0.000 0.000 0.000 –
Interspar 0.674 0.713 0.762 0.809 1.000
p-value 0.000 0.000 0.000 0.000 –
Match 0.705 0.848 0.732 0.944 0.762 1.000
p-value 0.000 0.000 0.000 0.000 0.000 –
Plus 0.651 0.820 0.742 0.969 0.807 0.949 1.000
p-value 0.000 0.000 0.000 0.000 0.000 0.000 –
Tesco 0.850 0.765 0.812 0.739 0.727 0.728 0.701 1.000
p-value 0.000 0.000 0.000 0.000 0.000 0.000 0.000 –
Source: Own calculations, data from the RIAE
Table 5. Probit model: probability of sale of the boxed and durable milk
Boxed milk Durable milk No. of weeks since
the last sale –0.009* 0.025***
Constant –1.402*** –1.715***
Pseudo R2 0.0020 0.0229
N 1392 1504
* and *** represent 10% and 1% significance level respectively Source: Own calculations, data from the RIAE
In line with the correlation results, a cluster of ‘large’
hypermarkets, and a cluster of ‘smaller’, centrally located supermarkets can be identified with respect to the causality results. At 5% level of significance, for the boxed milk, there are causality relationships between the ‘large’ retailers, the Auchan, Cora and Tesco (bidirectional between the Auchan and Cora, unidirectional from the Cora to Tesco and Tesco to Auchan), and mostly a bidirectional causality between the’smaller’ retailers, the Coop, Plus, CBA, Match and to some extent the Interspar. The boxed milk prices of the Interspar are weakly exogenous, the price vari- able being influenced only by its past values. Yet the boxed milk prices of the Interspar do cause pricing in the CBA, Cora, Coop, Plus – most retail chains.
For the durable milk, the dual cluster of retailers is less obvious. Amongst the ‘large’ retailers, a bidirec- tional causality between the Tesco and Auchan, uni- directional (bi-directional at 10%) from the Auchan to Cora is recorded. The Tesco prices are, however, influenced by the Interspar prices, whilst the Match present exogenous prices, dependent only by its past values. The price of the durable milk in the Cora causes most supermarket’s (Auchan, CBA, Interspar and Plus) durable milk prices. Similarly to the boxed
milk results, there is mostly a bidirectional causality relationship among the smaller sized retail chains. It needs to be mentioned, however, that the results are sensitive to the lag length choice, in turn dependent on the information criteria used. In sum, based on the results, we cannot reject the null Hypothesis that the timing of sales at the given retailer influences the timing of sales at the competing retailers.
According to the Hypothesis 3d, price promotions happen simultaneously across the retail chains. We may handle the Hypothesis 3d from two directions.
First, the Hypothesis of parallel discounts may easily be rejected by counting the number of simultaneous sale promotions over the period. Using 20% level, there are only 3 cases when minimum two retail chains were dropping prices at the same time. Using a 10% threshold with respect to price reductions, not a single case of the simultaneous sale promotion can be identified. Second, the timing of sales can be analysed deeper from a different perspective, using the time series properties of the data. If there are some link- ages between the price reductions of the individual retail chains, we would expect the prices to move together on the long run, or using the econometric term, to co-integrate. Two or more time series are
Table 7. Granger causality tests for the durable milk prices Retail
chain
Does not
Granger cause Retail chain Prob.*
Auchan → Cora 0.0039
→ Plus 0.0919
→ Tesco 0.0000
CBA → Tesco 0.0073
Cora → Auchan 0.0658
→ CBA 0.0313
→ Interspar 0.0271
→ Plus 0.0381
COOP → Plus 0.0635
Interspar → Cora 0.0358
→ Plus 0.0140
→ Tesco 0.0457
Match → COOP 0.0358
→ Plus 0.0000
Plus → CBA 0.0759
Tesco → Auchan 0.0001
*Null hypothesis: price of a given good in retail chain X does not cause the price of an identical product in retail chain Y. Only results with p < 0.1 are presented.
Source: Own calculations, data from the RIAE Table 6. Granger causality tests for the boxed milk prices
Retail chain
Does not
Granger cause Retail chain Prob.*
Auchan → Cora 0.0028
CBA → Auchan 0.0036
→ Match 0.0250
Cora → Auchan 0.0355
→ Tesco 0.0078
COOP → Plus 0.0426
Interspar → CBA 0.0235
→ Cora 0.0264
→ COOP 0.0147
→ Plus 0.0537
Match → CBA 0.0023
→ COOP 0.0189
→ Plus 0.0057
Plus → Match 0.0119
Tesco → Auchan 0.0456
→ CBA 0.0263
* Null hypothesis: price of a given good in retail chain X does not cause the price of an identical product in retail chain Y. Only results with p < 0.1 are presented.
Source: Own calculations, data from the RIAE
5For a detailed discussion of the unit root tests and integration see for example Maddala and Kim (1998).
co-integrated (CI) if there is (are) empirically test- able long-run relationship(s) between them. First step of the co-integration analysis is to test the order of integration of the individual series, i.e. whether they contain the unit root or not. There are a large number of the unit root test in the literature5, here we employed the Augmented Dickey-Fuller (ADF) test, and the Perron’s test, the latter being capable to account for the possible structural breaks in the data generation process. To clearly determine the order of integration, the first difference of variables was also tested. Two deterministic specifications, the constant and constant and trend, were used in the test equation, where the lag lengths were determined by the AIC criteria.
After a careful examination of the ADF and Perron unit root test statistics6, we conclude that all milk price time series are non-stationary, i.e. contain a unit root. The finding that all price series are non- stationary may be translated that the milk prices do not have any constant mean and/or variance in time, but these values are the function of the retailers’ cur- rent marketing strategy.
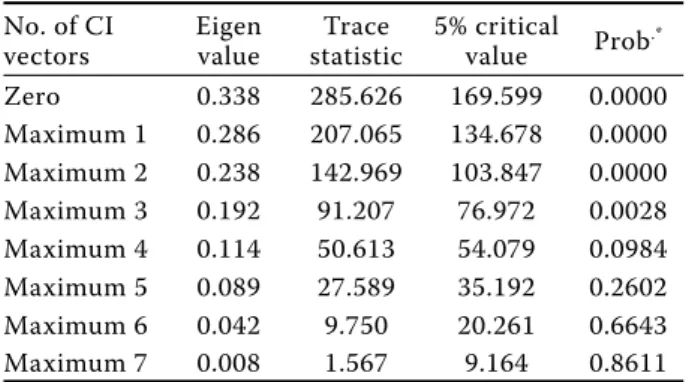
Next, we use the Johansen approach to test for co- integration between the boxed (Table 8) and durable
milk prices (Table 9) observed at each retailer. The tables present the number of hypothesised co-integra- tion vectors, the Eigen value of maximum likelihood estimator, the trace statistic (test statistic), the 5%
critical value, and finally the probability of rejecting the null of given CI vectors. The results emphasise the existence of a long-run relationship between the boxed milk prices (Table 8). At 5% level of significance 4, at 10% 5 CI vectors can be identified. The durable milk prices (Table 9) are co-integrated with 2 vectors. A higher number of CI vectors may be translated onto a stronger long-run relationship between the variables, thus the results show a stronger in-between boxed milk prices relationship than between its durable counterpart. This may be explained on one hand by the perishability of the boxed milk, resulting in the faster product rotation on shelves, and on the other hand by more accentuated sales marketing in the case of the UHT milk.
Hypothesis 4 states that the price distribution de- pends on the durability of the product. Having both the durable (UHT) and perishable (boxed) milk prices in the dataset, our sample is appropriate to test the hypothesis. On Figures 1 and 2, there is no evidence of any significant difference between the two prices
6Unit root test results were not included in the paper to save space, however, they are available upon request.
Table 9. Johansen co-integration test of the durable milk price
No. of CI vectors
Eigen value
Trace statistic
5% critical
value Prob.*
Null 0.329580 222.5254 169.5991 0.0000 Maximum 1 0.258447 146.5537 134.6780 0.0083 Maximum 2 0.189292 89.74196 103.8473 0.2942 Maximum 3 0.093766 49.87102 76.97277 0.8572 Maximum 4 0.070082 31.16395 54.07904 0.8767 Maximum 5 0.053064 17.35871 35.19275 0.8707 Maximum 6 0.026347 6.999293 20.26184 0.8973 Maximum 7 0.010087 1.926261 9.164546 0.7923 MacKinnon et al. (1999) p-values
Source: Own calculations, data from the RIAE Table 8. Johansen co-integration test of the boxed milk
prices No. of CI vectors
Eigen value
Trace statistic
5% critical value Prob.*
Zero 0.338 285.626 169.599 0.0000
Maximum 1 0.286 207.065 134.678 0.0000 Maximum 2 0.238 142.969 103.847 0.0000 Maximum 3 0.192 91.207 76.972 0.0028 Maximum 4 0.114 50.613 54.079 0.0984 Maximum 5 0.089 27.589 35.192 0.2602 Maximum 6 0.042 9.750 20.261 0.6643
Maximum 7 0.008 1.567 9.164 0.8611
*MacKinnon et al. (1999) p-values
Source: Own calculations, data from the RIAE
Table 10. Difference in proportion of pricing distribution 10% (20%) above mode to 10% (20%) below mode
10% Z test 20%
Z test
below mode above mode below mode above mode
Boxed milk 20.5 31.3 0.000 6.4 18.2 0.000
Durable milk 23.4 23.6 0.911 6.4 16.2 0.000
Source: Own calculations, data from the RIAE
from this respect. We formally test the asymmetry of the price distribution by examining the proportion of prices above and below the mode. Specifically, if price promotions are an important component of the price variation, we would expect to see more deviations below the mode than above it. We apply this test by examining two typical levels of price promotions a 10% or more and a 20% or more reduction from the regular (modal) price. We calculate the difference between the proportion of prices 10% (20%) above the mode and the proportion of prices 10% (20%) below the mode. Estimations confirm the graphical analysis (Table 10). The prices are much more likely to be above than below the mode. The asymmetry is significant with both threshold values (10 and 20%).
To conclude, we observe an upward asymmetry for all cases, except the durable milk with 10% cutting value, where the price distribution is symmetric. To conclude, when 10% threshold is used, we cannot reject Hypothesis 4, however, using a 20% threshold, there is evident a price distribution between the boxed and storable milk prices.
In order to investigate more in-depth Hypothesis 4, we may again exploit the more robust results offered
by panel analysis techniques. By building a panel database, we have 8 categories, 194 time points, i.e.
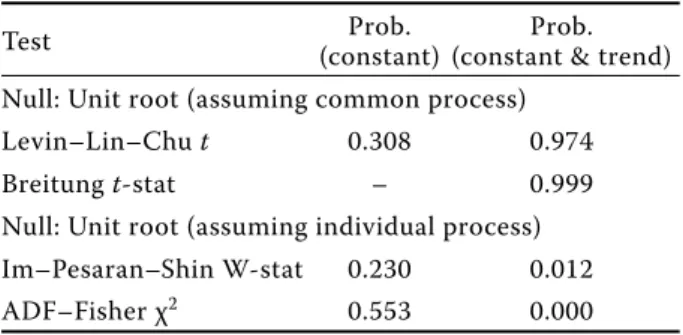
1544 observations by variable (note we now have two variables left, boxed and durable milk price). Table 11 summarises the panel unit root test results for the boxed milk prices and Table 12 for the durable milk prices. The first column of both tables presents the type of the test, the second the probability of rejecting the unit root null with only the constant specification and the third column the same probability but with the constant and trend specification.
For the boxed milk, all test results emphasise the presence of the panel unit roots, regardless of the deterministic specification. For the durable milk, most test results also show a panel unit root in the time series. With the constant & trend specification, the test result depends on whether the individual or common process is assumed. Based on the results in Tables 11 and 12, we consider both series as contain- ing one panel unit root. Although not the focus of Hypothesis 4, the existence of a unit root in a panel setting is an evidence that the price series included are not converging to a common equilibrium on the long-run. Next, we proceed to the panel co-integration tests. A number of different tests were employed, and the results are displayed in Table 13.
The null of no panel co-integration between the boxed and durable milk prices is strongly rejected by all tests. Thus there is a strong evidence of the panel co-integration, i.e. there is a long-run relationship between the boxed milk and the UHT milk prices.
Whilst not directly comparable, panel CI results in contradicting the findings emerging from Table 10 with 10% threshold and the previous support find- ings using the 20% threshold. It follows that there are connections between the price distribution of the durable and non-durable goods, however, the mixed results obtained do not allow us to clearly reject or do not reject Hypothesis 4.
Table 13. Panel co-integration tests between the boxed and durable milk prices
Test/statistic Test statistic Prob.* Kao
ADF –1.968 0.024
Pedroni
Panel v-statistic 3.296 0.001
Panel rho-statistic –39.376 0.000 Panel PP-statistic –17.234 0.000 Panel ADF-statistic –20.492 0.000
*Null hypothesis: no panel co-integration Source: Own calculations, data from the RIAE
Table 12. Panel unit root tests of the durable milk prices
Test Prob.
(constant)
Prob.
(constant & trend) Null: Unit root (assuming common process)
Levin–Lin–Chu t 0.308 0.974
Breitung t-stat – 0.999
Null: Unit root (assuming individual process) Im–Pesaran–Shin W-stat 0.230 0.012
ADF–Fisher χ2 0.553 0.000
Source: Own calculations, data from the RIAE Table 11. Panel unit root tests of the boxed milk prices
Test Prob.
(constant)
Prob.
(constant & trend) Null: Unit root (assuming common process)
Levin–Lin–Chu t 0.469 0.999
Breitung t-stat – 1.000
Null: Unit root (assuming individual process) Im–Pesaran–Shin W-stat 0.194 0.1431
ADF-Fisher χ2 0.508 0.110
Source: Own calculations, data from the RIAE
CONCLUSIONS
In this paper, we empirically tested four main groups of sale theory hypotheses using the store level price data for two distinct milk products, a perishable and a durable one. Our most important results can be summarized as follows:
First, the price distribution suggests that we may reject the predictions of all competing theories such as Varian (1980), or Sobel et al. (1984), and Salop (1977).
Second, the empirical results do not support the Hypothesis common for most sale theories that the processors determine price promotions. Instead, there is the evidence that the retailers decide when to go on sale, and they closely follow the actions of their competitors.
Third, we could not find any conclusive evidence for the either the randomness or simultaneity of sales promotions. We have also rejected the Pesendorfer’s (2002) Hypothesis that the probability of sales pro- motions increases with the number of weeks passed since the last discounting action. Instead, the analysis supports the Hypothesis that the retailers alternate the sale promotions of the national brands (Lal 1990).
Fourth, the empirical analysis could not find any significant differences between the distributions of the boxed and durable milk prices. The frequency of sale promotions is nearly identical irrespective of the threshold percent used to define sales. The panel co-integration results reinforce this finding, by emphasising the long-run relationship between the prices of durable and non-durable milk. Thus it seems the durability property of products does not play any role in this respect as one would expect based on Sobel (1984) or Conlisk et al. (1984) theo- retical models.
The fact that the individual series are non-stationary, yet there is a co-integration (i.e. long-run relation- ship between them) regardless of the simple or panel setting employed, and the high number of common structural break points (emerged as by-product of the Perron testing) for the retailers suggests that although the sale promotions do not occur simultaneously, the retailers closely follow each other’s sale promo- tions and act accordingly. Our conclusion is that the existing price promotions models are only partially consistent with some empirical aspects of sales, and none of the models can fully explain all important aspects of the retail price formation. As with many economic phenomena it is likely that more complex theoretical models (e.g. the inclusion of purchased
quantities) are needed to more accurately predict the retailers’ behaviour with respect to price promotions.
Acknowledgments
Zoltán Bakucs gratefully acknowledges OTKA fi- nancial support under project No. K-101868 (Price transmission on Hungarian agri-food markets – a complex view).
REFERENCES
Allender W.J., Richards T.J. (2012): Brand loyalty and price promotion strategies: an empirical analysis. Journal of Retailing, 88: 323–342.
Bell D.R., Hilber C.A.L. (2006): An empirical test of the theory of sales: do household storage constraints affect consumer and store behavior? Quantitative Marketing and Economics, 4: 87–117.
Berck P., Brown J., Perloff J.M., Villas-Boas S.B. (2008):
Sales: tests of theories on causality and timing. Interna- tional Journal of Industrial Organisation, 26: 1257–1273.
Carman H.F., Sexton R. (2005): Supermarket fluid milk pricing practices in the Western United States. Agri- business, 21: 509–553.
Chevalier J.A., Kashyap A.K., Rossi P.E. (2003): Why don’t prices rise during periods of peak demand? Evidence from scanner data. American Economic Review, 93:
15–37.
Conlisk J., Gerstner E., Sobel J. (1984): Cyclic pricing by a durable goods monopolist. Quarterly Journal of Eco- nomics, 99: 489–505.
Dutta S., Bergen M., Levy D. (2002): Price flexibility in channels of distribution: Evidence from scanner data.
Journal of Economic Dynamics & Control, 26: 1845–
1900.
Eichenbaum M., Jaimovich N., Rebelo S. (2008): Reference Prices and Nominal Rigidities. Working Paper No. 13829, National Bureau of Economic Research, Cambridge.
Available at http://www.nber.org/papers/w13829 Gvillo R.M., Capps O. Jr., Dharmasena S. (2014): Dynamics
of Advertising and Demand for Fluid Milk in the United States: An Incomplete Demand Approach. Selected Paper prepared for presentation at the Agricultural &
Applied Economics Association’s 2014 AAEA Annual Meeting, Minneapolis, MN, July 27–29, 2014.
Hosken D., Reiffen D. (2004): Patterns of retail price varia- tion. Rand Journal of Economics, 35: 128–146.
Lal R. (1990): Price promotions: limiting competitive en- croachment. Marketing Science, 9: 247–262.
Lal R., Villas-Boas J.M. (1998): Price promotions and trade deals with multi-product retailers. Management Sci- ence, 44: 935–949.
Li L., Carman H.F., Sexton R. (2005): Grocery Retailer Pricing Behaviour for California Avocados with Implica- tions for Industry Promotion Strategies. In: American Agricultural Economics Association Annual Meeting, Providence, Rhode Island, July 24–27, 2005.
Lloyd T., Morgan C.W., McCorriston S., Zgovu E. (2009):
Do Sales Matter? An Exploration of Price Discounting in UK Food Retailing. In: International Association of Agricultural Economists Conference, Beijing, China, August 16–22, 2009. Available at http://ageconsearch.
umn.edu/bitstream/51572/2/IAAE%20Final.pdf MacDonald J. (2000): Demand, information, and competi-
tion: why do food prices fall at seasonal demand peaks?
Journal of Industrial Economics, 48: 27–45.
MacKinnon J.G., Haug A., Michelis L. (1999): Numerical distribution functions of likelihood ratio tests for cointe- gration. Journal of Applied Econometrics, 14: 563–577.
Maddala G.S., Kim I.-M. (1998): Unit Roots, Cointegration, and Structural Change. Cambridge University Press.
Pesendorfer M. (2002): Retail sales: a study of pricing be- havior in supermarkets. Journal of Business, 75: 33–66.
Salop S.C. (1977): The Noisy monopolist. Review of Eco- nomic Studies, 44: 393–406.
Salop S.C., Stiglitz J.E. (1982): The theory of sales: a simple model of equilibrium price dispersion with identical agents. American Economic Review, 72: 1121–1130.
Seiler S. (2012): The impact of search costs on consumer behavior: A dynamic approach. Quantitative Marketing and Economics, 11: 155–203.
Shilony Y. (1977): Mixed pricing in oligopoly. Journal of Economic Theory, 14: 373–388.
Sobel J. (1984): The Timing of Sales. Review of Economic Studies, 51: 353–368.
Stokey N.L. (1979): Intertemporal Price Discrimination.
Quarterly Journal of Economics, 93: 355–371.
Stokey N.L. (1981): Rational expectations and durable goods pricing. Bell Journal of Economics and Management Science, 12: 112–128.
Tikkanen I. (2015): Measuring Effectiveness of a Milk Information and Promotion Programme in Finland.
University of Eastern Finland, Business School, Kuo- pio. Available at http://www.saunalahti.fi/irmtikka/
MilkPromProgrammeEffect09022015.pdf
Varian H. (1980): A model of sales. American Economic Review, 70: 651–659.
Villas-Boas J.M. (1995): Models of competitive price pro- motions: some empirical evidence from the coffee and saltine crackers markets. Journal of Economics and Management Strategy, 4: 85–107.
Villas-Boas J.M. (2007): Vertical relationships between manufacturers and retailers: inference with limited data.
Review of Economic Studies, 74: 321–352.
Received: 12th October 2014 Accepted: 31th June 2015
Contact address:
Zoltán Bakucs, Hungarian Academy of Sciences, Centre for Economic and Regional Studies, Budapest, Hungary e-mail: zoltan.bakucs@krtk.mta.hu