1
An Examination of the Relationship of Governance Structure and Performance:
Evidence from Banking Companies in Bangladesh Hasnan Ahmed
Post-doctoral Research Fellow, Department of Information Systems, Corvinus University of Budapest
E-mail: hasnanahmed@yahoo.com Andras Gabor
Professor, Department of Information Systems, Corvinus University of Budapest E-mail: gabor@informatika.uni-corvinus.hu
Corporate governance has become increasingly important in developed and developing countries just after a series of corporate scandals and failures in a number of countries.
Corporate governance structure is often viewed as a means of corporate success despite prior studies reveal mixed, somewhere conflicting and ambiguous, and somewhere no relationship between governance structure and performance. This study empirically investigates the relationship between corporate governance mechanisms and financial performance of listed banking companies in Bangladesh by using two multiple regression models. The study reveals that a good number of companies do not comply with the regulatory requirements indicating remarkable shortfall in corporate governance practice. The companies are run by the professional managers having no duality and no ownership interest for which they are compensated by high remuneration to curb agency conflict. Apart from some inconsistent relationship between some corporate variables, the corporate governance mechanisms do not appear to have significant relationship with financial performances. The findings reveal an insignificant negative impact or somewhere no impact of independent directors and non- independent non-executive directors on the level of performance that strongly support the concept that the managers are essentially worthy of trust and earn returns for the owners as claimed by stewardship theory. The study provides support for the view that while much emphasis on corporate governance mechanisms is necessary to safeguard the interest of stakeholders; corporate governance on its own, as a set of codes or standards for corporate conformance, cannot make a company successful. Companies need to balance corporate governance mechanisms with performance by adopting strategic decision and risk management with the efficient utilization of the organization’s resources.
Keywords: corporate governance, corporate performance, governance mechanisms, Bangladesh, agency theory, stewardship theory.
JEL-codes:
2 1. Introduction
Corporate governance has become increasingly important for corporations in developed and developing countries around the world just after a series of corporate scandals and failures in a number of countries. Corporate governance shortcomings are identified as significant in explaining the financial scandals and corporate collapses. It is observed that weak corporate governance causes lack of monitoring and transparency, inefficiency in companies’ overall activities and ultimately results in poor corporate performance and disgusts stakeholders.
Although, corporate governance encompasses the whole gamut of administration with its integrity, efficiency, growth and profitability, its successfulness lies in the appropriate combination of resources with the governance structure. In this perspective, it is hard to belief that only some rules and regulations about governance structure can wave the rim of success without regard to psycho-physiological aspects combined with the prevailing socio-political- cultural environment of a group of people working in the entities. Rather rules and regulations are required for conformance and accountability to the stakeholders and thus prevent malpractices and frauds to a greater extent, not fully. If corporate governance is a structure, dimension and an arrangement of human and nonhuman factors employed in an organization, then its achievement towards desired goals is the product of the successful and effective combination of economic, social and political traits of factors under the legal framework.
Finding this combination is not an easy task. For this reason, several schools of thought and theories are seen to be used to address the problems, to explain situations and success.
In Bangladesh, the contribution of industrial sectors is very poor, only about 16 percent to GDP, which can be seen as too low to eradicate the curse of abject poverty and to sustain growth. What is needed for industrialization is an efficient capital market. To improve the situation, different reform programs including a corporate governance reform have been undertaken in Bangladesh over the last few years. As the dominant financier for industrial and commercial activities, banks can play a vital role in Bangladesh’s economy and the corporate governance of banks could have been a burning issue in the discussions, but they have been almost ignored. Banks are not only the key intermediaries between lenders and borrowers, but also providers of financial information on the economy. The reports by the Banking Reform Commission (1999) and BEI (2003) raised serious concerns on the banking sector and criticized the quality of governance. Many of the problems have been attributed to the lack of sound corporate governance among the banks.
3
Much of the large body of empirical studies devoted to corporate governance have emerged over the last decade dealing with the issue from various angles and with varied degrees of emphasis, but always in the context of advanced countries. Some of them are related to developing countries. Most of them are aimed at evaluating the effectiveness of corporate governance to the ultimate objective of a corporation – value maximization. One commented
‘a sound corporate governance structure provides useful information to investors and creditors to reduce information asymmetry that also helps the company to improve operations’ (Chiang, 2005). In contrast, some studies have revealed mixed results about the relationship between governance structure and performance. Gregory and Simms (1999) suggest that effective corporate governance helps in increasing the responsiveness of firms to social needs and expectations and in improving the long-term performance of firms. Fahy et al. (2005), separated corporate performance (business governance) dimensions out from corporate conformance (corporate governance) dimensions, commenting that
[c]orporate governance, or its apparent failure, has received a lot of attention in recent years with market meltdown and high profile scandals. Often regarded as a mandatory box-ticking exercise, corporate governance has rarely been counted as an activity that can create sustainable shareholders value. The performance dimension is concerned with developing and deploying effective strategic management processes to ensure that the firm creates value for shareholders.
The PAIB Committee (2004) opined that
[c]onformance (corporate governance) covers issues such as board structures and roles and executive remuneration. [...] Codes and/or standards can generally address this dimension with compliance being subject to assurance. The performance dimension focuses on strategy and value creation. The focus is on helping the board to: make strategic decisions; understand its appetite for risk and its key drivers of performance, and; identify its key points of decision making. This dimension does not lend itself easily to a regime of standards and audit. Instead, it is desirable to develop a range of best practice tools and techniques that can be applied intelligently within different types of organisation.
This divergent situation paves the way to new research in the same context.
In addition, according to Haniffa – Hudaib (2006),
[e]very nation has its own national character as well as social and economic priorities and as such, what is desirable in one country may not be so in another. Likewise, every corporation has its own unique history, culture and business goals. Hence, efforts to reform corporate governance should take into account all of these factors.
4
In the case of Bangladesh, the social, political, and legal environment is not the same as in other countries and the journey of corporate governance has started very recently. Moreover, there has been only a handful of studies done on the issue dealing with non-financial sectors in developing countries like Bangladesh, but few of which are related to corporate governance in the banking sector. But the corporate governance in the banking sector has unique behaviour due to two special characteristics of banks. One is greater opacity in acquiring information about bank behaviour and another one is greater government regulation in monitoring bank activities that make many traditional mechanisms applicable for non- financial sectors weaken. These suggest special separate consideration in the analysis of corporate governance apart from non-financial sectors as to how these newly devised legal, regulatory and supervisory polices influence the bank governance mechanisms and its objectives. This is the broad perspective that the study finally addresses. Now, in the above context, the pertinent question is: do the prevailing corporate governance mechanisms of banking companies in Bangladesh have any relationship with the companies’ performance?
The study intends to search for the answer to this basic question by empirically examining the relationship between the two variables.
With this end in view, this section covers the background and the problem statement of the study. The rest of the sections are organized as follows: the next section briefly depicts the corporate governance framework and corporate performance. Section 3 discusses briefly the corporate governance in the banking sector of Bangladesh. Section 4 reviews the relevant literature on governance mechanisms and their relationship with performance along with presenting the testable hypotheses. Section 5 presents the methodology of the research, and the models and variables used in the study. Section 6 deals with analysis of data comprising of descriptive statistics, correlation analysis, results of regression analysis, and comparison with other studies. The study ends with section 7 which summarizes the findings, including limitations and avenues for further study, and finally draws conclusions.
2. Corporate Governance Structure and Corporate Performance
The corporate governance structure of a company comes into operations with the control forces through its internal and external mechanisms. Two broad categories of mechanisms are board structural mechanisms and ownership structural mechanisms. Generally, board mechanisms are utilised to monitor the activities of top managers. The board is entrusted with the responsibility of policy finalization and approval, and for making sure that the top
5
managers are pursuing polices consistent with the shareholders’ interests in a way that will ensure maximization of shareholder value in the company. Ownership structure is the final type of monitoring mechanism that the firm can implement to increase the incentive for board members to monitor firm managers. With their increasing shares of firm ownership, board members will have a personal wealth incentive to monitor managers, in addition to their fiduciary responsibility as members of the board of directors (Coles et al. 2001).
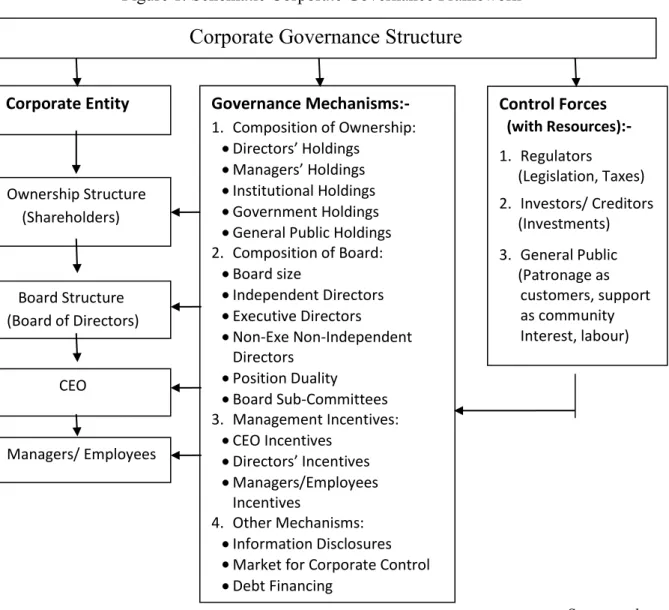
Figure 1. Schematic Corporate Governance Framework
Source: authors
The information disclosure mechanism works as an important indicator of corporate governance quality. It helps stakeholders understand the company’s governance practices and thus, minimise the problems of adverse selection and moral hazard. Debt financing is another internal governance mechanism whereby increased debt reduces free cash flow and so limits managerial discretion (Jensen 1986). If the company’s internal mechanisms fail, the market
Corporate Governance Structure
Corporate Entity Governance Mechanisms:- 1. Composition of Ownership:
Directors’ Holdings Managers’ Holdings Institutional Holdings Government Holdings General Public Holdings 2. Composition of Board:
Board size
Independent Directors Executive Directors
Non-Exe Non-Independent Directors
Position Duality Board Sub-Committees 3. Management Incentives:
CEO Incentives Directors’ Incentives Managers/Employees Incentives
4. Other Mechanisms:
Information Disclosures Market for Corporate Control Debt Financing
Control Forces (with Resources):- 1. Regulators
(Legislation, Taxes) 2. Investors/ Creditors (Investments) 3. General Public (Patronage as
customers, support as community Interest, labour) Ownership Structure
(Shareholders)
Board Structure (Board of Directors)
CEO
Managers/ Employees
6
for corporate control acts as a disciplining mechanism of last resort (Jensen 1986). The
‘Schematic Corporate Governance Framework’ in Figure 1 depicts the mixture of controlling mechanisms and governance structures along with the controlling forces and resources. From these, a company selects configurations for formulation of policy and strategy, which’s implementation must be consistent with the socio-cultural and political environment.
A company’s operations and successfulness are integrally connected. Studies show that the concept of a company’s performance is multidimensional. But the fact is that the company’s investors, shareholders and some stakeholders find its success in the financial performance.
Financial performance refers to a ‘firm’s ability to generate new resources from day to day operations over a given period of time’ (ASB 2000). The financial performance measures can be divided into two major types: (1) accounting-based measures, and (2) market-based measures. Whatever may be the basis of measurement, profitability is the only way to maximise shareholders’ wealth in a company. And a sound system of corporate governance is believed to lead to increased returns to the company’s shareholders.
3. Corporate Governance in Bangladesh
The concept of corporate governance is relatively new in Bangladesh. The current legal framework in respect to corporate governance in Bangladesh includes: the Companies Act of 1994, the Securities and Exchange Rules of 1987, the Banking Companies Act of 1991. The Securities and Exchange Commission (SEC) has promulgated different orders and notifications from time to time to ensure good corporate governance practice in the listed public limited companies. On the 9th January and the 20th February 2006, the SEC has issued orders for complying with a number of governance codes.Keeping in mind the importance of the financial sector and its proper control and guidance, the Central Bank (Bangladesh Bank) was given autonomy in terms of it’s operations and monetary policy formulation and implementation in March 2003, bringing massive reforms in the banking as well as the financial sector. The central bank promulgated codes of corporate governance for banks focusing on different mechanisms of corporate governance in which responsibilities and authorities of the Chairman, CEO, board of directors have been redefined, the constitution of boards of directors, audit committees, and requirements for the appointment of bank directors have been restructured. The number of directors in a board has been reduced to 13 and one person can be a board member for only one bank.
7 4. Prior Studies and Testable Hypotheses
A review of the literature on the relationship between corporate performance and corporate governance characteristics shows mixed results (Haniffa – Hudaib 2006). Every researcher gives strong arguments in favor of his/her findings referring preferred theories on the convenience that all theories are based on human behavior and activities that vary from one case to another and cannot be measured properly. They always try to demarcate human beings within an economic boundary without considering the nature of mind and uniqueness of human traits. To examine the relationship of performance, the mechanisms to be considered are board structure, board monitoring, committee structure, CEO incentive alignment devices, directors’ shareholdings, institutional shareholdings and debt financing.
The board of directors is the top executive unit of a company and assigned with the responsibility of formulating policies and strategies and supervising operations of the company. In Bangladesh, law limits the minimum number of director to be at least 5 and maximum 13. Fixing the optimal number of board of directors is a dilemma. The proverb “too many cooks spoil the broth” may be true for cases with many directors and again decision- making precision may be hampered because of being too few. Empirical evidence indicates that the size of the board does matter as it affects the extent of monitoring, controlling and decision making in a company (Monks – Minow 1995; Haniffa – Hudaib 2006). Small boards are said to help in alleviating the effort problem and in becoming more effective (Jensen 1993), but when they grow too big, boards become more symbolic rather than being a part of the management process (Hermalin – Weisbach 2000). Yermack (1996) finds an inverse relationship between board size, profitability and Tobin’s Q. Haniffa and Hudaib (2006) find board size negatively associated with market performance and positively with accounting performance measures that indicate contradictory results of the board size, whereas Holthausen and Larcker (1993) find no association between the two variables. As the supervisory authorities of banks are of the opinion that decreasing the number of directors will result in better governance and better performance, it may be implicitly assumed that the increase of operating costs associated with the increased number of directors results in decreased financial performance. Given the notion, the first hypothesis is stated as follows:
H1: There is a significant inverse relationship between board size and corporate performance.
8
Most regulatory efforts have concentrated on the issue of independence of the board. In an attempt to reduce the CEO’s influence over the board, many countries have introduced requirements that a minimum fraction of the board be composed of so-called ‘independent’
directors. The rationale behind these regulations is that if directors are not otherwise dependent on the CEO they are more likely to defend shareholders’ interests’ (Becht et al.
2005). In Bangladesh, a notification of the SEC made it compulsory in 2006 that at least one- tenth (minimum one) of the company’s board of directors should be an independent director in order to enhance core competencies considered relevant in the context of each company.
Chiang (2005) argues that as the independent directors are more specialized to monitor the board than the inside directors, they reduce the concentrated power of the CEO, and help to prevent misuse of resources and enhance performance. But it is not difficult to find flaws in the logic. Independent directors are still dependent on the CEO for reappointment.
To date, most research on boards and the impact of independent directors is empirical, and the findings concerning the effects of independent directors are mixed (Becht et al. 2005).
However, Yermack (1996), Agrawal and Knoeber (1996), and Bhagat and Black (1998) find a negative relationship between the proportion of independent directors and performance. In contrast, Krivogorsky (2006) observes significant positive relationship between independent directors and the companies’ performance. But one can argue that the bank supervisory authorities have made provision for maintaining at least one-tenth independent directors of the board keeping an eye on ensuring increased independent supervision of board and bank activities and to protect stakeholder interest in the company, not to earn profit. Appointment of independent directors does not or should not guarantee an increase in the company’s earnings. On this argument and considering mixed and conflicting results of this variable as discussed above, the second hypothesis is formulated as:
H2: The proportion of independent directors in the board has no significant relationship with corporate performance.
The success of a company mostly depends on the balanced composition of a board consisting of inside and outside directors. Some authors argue that boards dominated by non-executive directors may help to alleviate the agency problem by monitoring and controlling the opportunistic behaviour of management and also by ensuring that managers are not the sole evaluators of their own performance (Jensen – Meckling 1976; Baysinger – Hoskisson 1990).
9
It is evident that almost all non-executive directors have multiple shareholdings and directorships. So, it is not unjustified to raise the issue that they are busy with so many tasks in different places around the clock and have little time to look into specific issues of a particular company, other than to have bird’s eyes view.
Empirical evidence on non-executive directors and performance is mixed. Some authors found positive relationship between the non-executive directors and the firm’s performance (Choi et al. 2007; Wang et al. 2007). In contrast, in the UK, Weir and Laing (1999) found insignificant relationship between non-executive director representation and performance.
However, Baysinger and Hoskisson (1990) and Harmalin and Weisbach (1991) find no relationship between board composition and performance when both relate to the same year.
Haniffa and Hudaib (2006) also found no relationship and commented that boards dominated by non-executive directors do not seem to affect performance regardless of the measures used.
So, the third hypothesis of the study is:
H3: No significant relationship exists between the proportion of non-independent non- executive directors and corporate performance.
To curb agency conflicts and to reduce agency costs, a company may choose three types of CEO incentive alignment mechanisms to implement to monitor the CEO – the CEO duality mechanism, CEO ownership mechanism, and CEO compensation mechanism. In case of the banking sector in Bangladesh, Bangladesh Bank rules and SEC guidelines regarded the practice of duality undesirable. Interesting enough that the CEO’s in the banking sector in Bangladesh are hardly seen to have possessed shares of the same bank and as a result no hypotheses are required to be drawn in respect to CEO duality and ownership. The last usual one is the CEO compensation mechanism that implies that a company may pay higher remuneration to the managers, especially to the CEO in order to align his interests with shareholders interests. This alignment should induce the CEO to take actions that create firm value and thus curb agency conflict.
Conyon and Schwalbach (2000) find a significant positive association between cash pay and company performance. In contrast, Brick et al. (2006) argues that an excessive level of compensation for a CEO provides an indicator of poor corporate governance structure and that this is a precursor to the underperformance of firms. Basu et al. (2007) also finds that
10
relative to ownership and monitoring variables, excessive pay levels have a negative association with subsequent accounting performance. Similar negative relationship between excess director compensation and firm performance is reported by Brick et al. (2006).
Recently, Duffhues and Kabir (2008) question the conventional wisdom of using executive pay to align managers’ interest with those of shareholders after finding no systematic evidence that executive pay of Dutch firms is positively related to corporate performance. The above mentioned arguments lead to the following hypothesis:
H4: There is a significant relationship between CEO compensation and corporate performance.
Consistent with the agency theory, the audit committee works as an additional control mechanism that ensures that the shareholders’ interests are being safeguarded. In keeping with the Cadbury proposal, Bangladesh Bank and SEC have made it compulsory for all banks to constitute a board’ audit committee consisting of a minimum of three members and it must hold at least three meetings in a year. As the constitution of audit committee is mandatory for banking companies in Bangladesh, every company has an audit committee in existence but there is no way to judge their effectiveness. In this case, the total numbers of meetings held in a year have been used as a proxy to internal control mechanisms to judge the effectiveness of the committee in this study. However, given the corporate governance guidelines of Bangladesh Bank, the hypothesis is drawn as:
H5: Number of audit committee meetings has a significant positive relationship with corporate performance.
Ownership structure that shows the concentration of ownership by inside shareholders and outside shareholders plays a vital role in effective corporate governance. It is argued that when firms effectively become controlled by larger shareholders, deviations in the control of cash flow rights induce these controlling shareholders to expropriate wealth by seeking personal benefits at the expense of minority shareholders. The existence of controlling shareholders thus implies agency costs arising from conflicts between controlling shareholders and outside investors (Lemmon – Lins 2003; Chen – Lee 2008). In the banking sector of Bangladesh, on average 85 percent of the directors of a company are non-executive- non-independent directors holding 40.19 percent shares on average in their companies.
11
According to the ‘convergence-to-interest’ model, there is a relationship between directors shareholdings and performance because the greater the financial stake, the greater the costs for not maximizing shareholders’ wealth (Jensen – Meckling 1976). As the agency costs relating to managers are obviously increased to align the managers, the board of directors is supposed to maximize their wealth at the expense of creditors / depositors interests. Different researchers found ambiguous relationship between board shares and performance. Haniffa and Hudaib (2006) commented that the size of insider ownership does matter and the effect can be both positive and negative. The positive relation at low levels of managerial ownership suggests incentive alignment while the negative relation at high levels of managerial ownership provides evidence that managers become entrenched and can indulge in non-value- maximizing activities without being disciplined by shareholders (Himmelberg et al. 1999).
Directors’ shareholdings, directly or indirectly are common in the banking sector in Bangladesh. Based on these ambiguous results in the literature, the hypothesis is drawn as:
H6: No significant relationship exists between the proportion of board ownership and corporate performance.
Institutional investors generally do have some characteristics that make them unique and distinct shareholders. Firstly, institutional investors typically hold shares as part of a portfolio investment strategy. A second and related point is that although legally the shares are owned by the investment company, economically the ultimate investors and clients are the clients of the investor (Jonathan 2007). But institutional investors as external investors cannot influence the key decisions about companies’ operation.
Ho (2005) reports that significant share holdings by institutional investors raises board vigilance, which in turn has a positive effect on firm performance. On the other hand, Agrawal and Knoeber (1996) and Dhnadirek and Tang (2003) find no significant relationship between performance and institutional shareholding. The authors are of the opinion that institutional ownership itself cannot be effective to enhance the operating performance. So, the hypothesis is:
H7: No significant relationship exists between the proportion of institutional ownership and corporate performance.
12
One of the mechanisms in controlling moral hazard problems arising from separation of ownership and control is via concentrated ownership by outside shareholders, as they have greater incentives to align management and shareholder interests, resulting in better corporate performance (Li – Simerly 1998) and benefiting minority shareholders. However, concentrated ownership can come with costs for minority shareholders as the controlling owners might try to expropriate the company’s assets (Haniffa – Hudaib 2006). Fishman et al.
(2005) posit that ownership structure depends on the individual characteristics of the organization. For this reason, different empirical studies on the association between ownership concentration and corporate performance give ambiguous results. Holderness and Sheehan (1988), and Leech and Leahy (1991) found a positive relationship between external shareholdings and performance. In contrast, Demsetz and Villalonga (2001) found no empirical relationship between ownership structure and profitability, and Murali and Welch (1989) and Weir et al. (2002) also drew the same conclusion. So, the study considers the following hypothesis:
H8: No significant relationship exists between the proportion of general public ownership and corporate performance.
Two other variables in determining a company’s performance, leverage (in terms of debt- equity ratio), and size (proxied by total assets) are considered in this study as control variables. Like other variables, relationship of the gearing ratio with performance shows conflicting results in different studies. Short and Keasey (1999) and Weir et al. (2002) found a significant negative relationship between gearing and corporate performance. This study draws the hypothesis that:
H9: No significant relationship exists between debt-equity ratio and corporate performance.
The size of the company has been shown to have a relationship with other factors. The literature is in harmony with this tendency. Company size may be measured in different ways such as sales turnover, total assets, capital employed, etc. Actually, to measure the magnitude of a company, total assets is such a determinant that may preferably be used than other measures because sometimes a medium firm may have larger sales volume, for example, due to increase in assets turnover. Hence, the next hypothesis is:
13
H10: There exists a significant relationship between company size and corporate performance.
5. Methodology and Variables
The sample companies used in this study are banking companies listed on the Dhaka Stock Exchange (DSE) in Bangladesh. As of December 31, 2009, a total of 27 banking companies were listed on the main board of the DSE. Excluding two banking companies – one for being listed at the end of 2007 and another for data missing, a sample of 25 banking companies is used in this study. The study is conducted on six years of data from 2003 to 2008. The study primarily collected data from the published annual reports of the company. In the following we provide a brief description of dependent and independent variables and the models used for this study to test hypotheses.
Dependent Variables: The dependent variable is corporate performance and three measurements, return on assets (ROA), return on equity (ROE), and Tobin’s Q are taken into account as proxies as accounting-based measures of performance and market-based measures of performance.
Independent Variables: The explanatory variables used in this study are board size, share of independent directors, share of non-independent non-executive director, ownership of directors, institutional ownership, general public ownership, CEO remuneration, and the number of audit committee meetings. Control variables are leverage and company size.
The Model: To test the hypotheses discussed above, the study used Ordinary Least Square (OLS) multiple regression to examine the relationship of corporate governance variables and corporate performance.
ROAt / ROEt / TOBQt = α0 +β1BSIZE+ β2 INDD+ β3NINED+ β4SDOWN+ β5INOWN+ β6GPOWN+ β7CEORM+ β8AUDCM+ β9TASSETS+ β10DERATIO+ ε (1)
Where
α0 constant;
ROA rate of return on total assets;
ROE rate of return on equity;
TOBQ Tobin’s Q;
14 BSIZE board size (log);
INDD proportion of independent director;
NINED proportion of non-independent non-executive director;
SDOWN share of sponsor/director ownership;
INOWN share of institutional ownership;
GPOWN share of general public ownership;
CEORM CEO remuneration (log);
AUDCM number of audit committee meetings (log);
TASSETS total assets (log);
DERATIO debt-equity ratio (log).
ε error term.
‘Given the perspective nature of the Code of Best Practice, it could be argued that the internal governance mechanisms are exogenous rather than endogenous. Using OLS would therefore be appropriate’ (Weir et al. 2002). However, it is often argued that is similar cases ‘OLS yields inconsistent results as OLS parameter estimates are biased’ (Rose 2005) and endogeneity creates a problem in corporate governance research and researchers do not often consider this issue with reasonable care. Considering the potential endogeneity, another model is also tested to gain further insights into the relationship. The model is constructed such that year t’s performance is dependent on year t-1’s governance structure and as such a lagged dependent variable is introduced in the right-hand side of the respective model (as constructed by Klein 1998; Weir et al. 2002; Haniffa – Hudaib 2006; and Brick et al. 2006).
The model is:
ROAt / ROEt / TOBQt= α0 +β1BSIZE+ β2 INDD+ β3NINED+ β4SDOWN+ β5INOWN+ β6GPOWN+ β7CEORM+ β8AUDCM+ β9TASSETS+ β10DERATIO+ β11LAG+ ε (2)
Where,
LAG is ROAt-1,or ROEt-1, or TOBQt-1 i.e. ROA, ROE, and TOBQ lagged one year.
Multiple regression for each model are conducted for the pooled data for all six years.
6. Findings
6.1. Descriptive Statistics
15
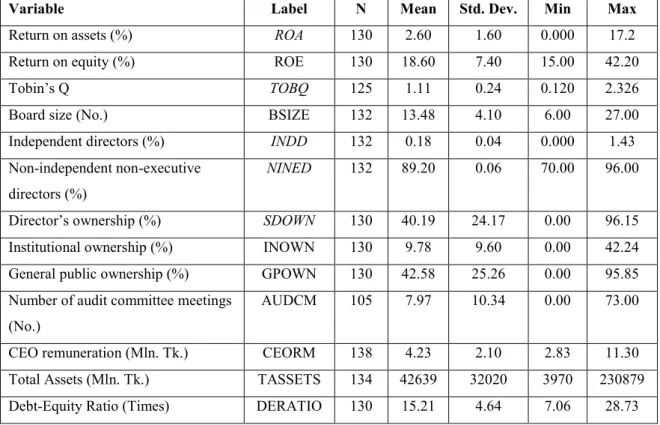
Table 1 presents the overall descriptive statistics of the variables used in the study.
Table 1. Descriptive Statistics
Variable Label N Mean Std. Dev. Min Max
Return on assets (%) ROA 130 2.60 1.60 0.000 17.2
Return on equity (%) ROE 130 18.60 7.40 15.00 42.20
Tobin’s Q TOBQ 125 1.11 0.24 0.120 2.326
Board size (No.) BSIZE 132 13.48 4.10 6.00 27.00
Independent directors (%) INDD 132 0.18 0.04 0.000 1.43
Non-independent non-executive directors (%)
NINED 132 89.20 0.06 70.00 96.00
Director’s ownership (%) SDOWN 130 40.19 24.17 0.00 96.15
Institutional ownership (%) INOWN 130 9.78 9.60 0.00 42.24
General public ownership (%) GPOWN 130 42.58 25.26 0.00 95.85 Number of audit committee meetings
(No.)
AUDCM 105 7.97 10.34 0.00 73.00
CEO remuneration (Mln. Tk.) CEORM 138 4.23 2.10 2.83 11.30
Total Assets (Mln. Tk.) TASSETS 134 42639 32020 3970 230879
Debt-Equity Ratio (Times) DERATIO 130 15.21 4.64 7.06 28.73
Source: authors
In respect of dependent variables, it can be seen that the mean value for the rate of return on shareholders’ equity, on average is 18.60 percent, ranging from 15.00 percent to 42.20 percent, implying over-performance in investments. As for the independent variables, the table shows that the average board size is 13.48, which is more or less within the size as recommended by Bangladesh Bank but still the number is high in at least 25 percent of companies. Proportion of independent directors shows appalling result, there are some companies where there is not even a single independent director in the board. It implies non- compliance with SEC rules. In terms of board composition, the mean percentage of non- independent non-executive directors in the board is 89.20 percent which implies that the board is composed of mainly non-independent outside directors. It is said that the directors are businessmen having directorships in at least 5 other multi-faceted companies. In respect of ownership, the average percentage of shareholdings by the board of directors is 40.19 indicating concentrated ownership and quite strong voting power of the directors. The mean value of institutional ownership (9.78%) indicates poor holdings suggesting negligible voting
16
power in selecting directors in the board. The average percentage of general public ownership is 42.58 and standard deviation is 25.26, indicating defuse ownership patterns among the general public who hold lesser proportion of ownership in most of the companies.
The average amount of CEO compensation per year shows that most of the companies pay Tk. 4.23 million while the maximum is 11.30 million indicating a very wide variation. The mean for debt-equity ratio is 15.21, indicating that the investment of depositors creditors in the banking business is on an average 15.21 times as much as the investment of the shareholders. It becomes salient that the average rate of interest on deposits (7.5 percent) in the bank and yearly rate of inflation are more or less equal in the country. The directors are prominently non-independent outside businessmen having concentrated ownership in the bank. CEOs are highly paid professionals without position-duality and ownership interests.
The shareholders are getting an average yearly return at the rate of 18.60 percent on their investment having been the owners of only one-fifteenth in the total assets invested in the banks. The situation leads one to comment that banking business is such an attractive low-risk business that pays off.
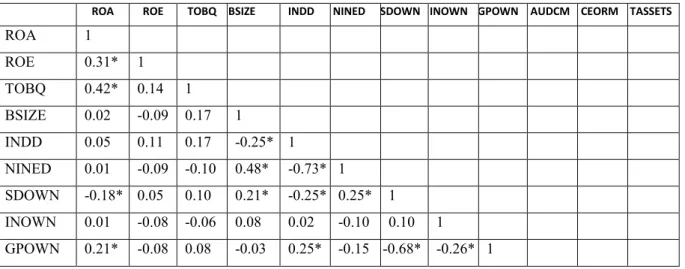
Table 2 presents a correlation matrix for the explanatory variables and the dependent variable.
One of the suggested rules of thumb for a multicollinearity test is that if the pair-wise or zero- order correlation coefficient between two regressors is high, say, in excess of 0.80, then multicollinearity is a serious problem (Gujarati 2004). The estimated pair-wise correlation coefficient is less than 0.70 in all cases and thus the estimated results are not likely to be affected by the multicollinearity problem.
Table 2. Correlation Matrix
ROA ROE TOBQ BSIZE INDD NINED SDOWN INOWN GPOWN AUDCM CEORM TASSETS
ROA 1
ROE 0.31* 1
TOBQ 0.42* 0.14 1
BSIZE 0.02 -0.09 0.17 1
INDD 0.05 0.11 0.17 -0.25* 1
NINED 0.01 -0.09 -0.10 0.48* -0.73* 1
SDOWN -0.18* 0.05 0.10 0.21* -0.25* 0.25* 1
INOWN 0.01 -0.08 -0.06 0.08 0.02 -0.10 0.10 1
GPOWN 0.21* -0.08 0.08 -0.03 0.25* -0.15 -0.68* -0.26* 1
17
AUDCM -0.12 -0.01 0.11 0.18 -0.10 0.24* 0.07 -0.33* -0.01 1 CEORM 0.04 0.14 0.37* -0.02 0.38* -0.31* 0.14 0.18* 0.08 -0.09 1 TASSETS -0.28* 0.04 0.14 -0.17 0.23* -0.26* -0.09 -0.06 0.07 0.43* 0.33* 1 DERATIO -0.32* -0.26* 0.04 -0.13 -0.17 0.024 0.05 -0.26* -0.04 0.14 -0.11 0.09
* indicates 5% level of significance
source: authors
6.2. Regression Analysis
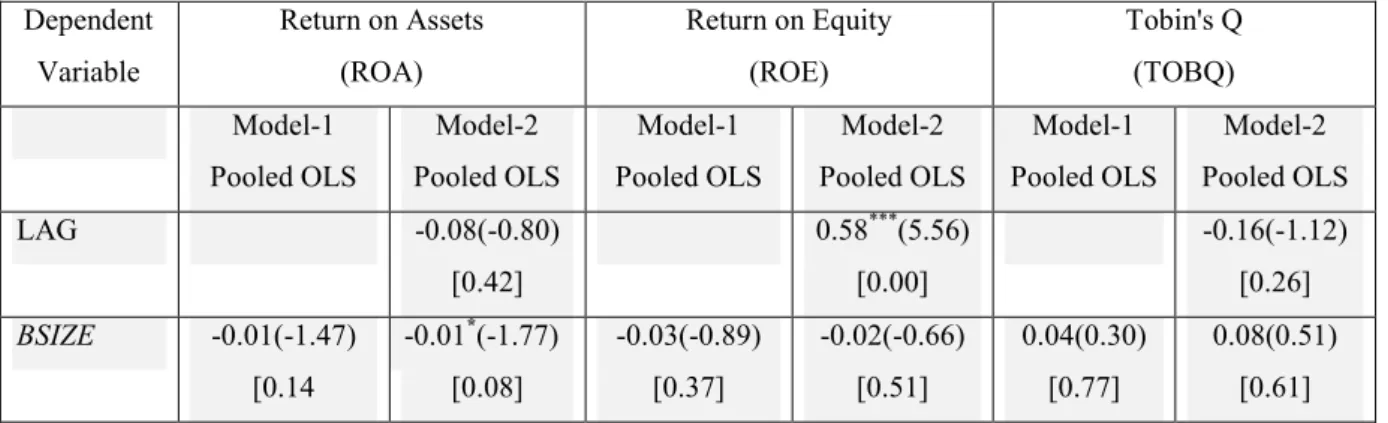
The regression analysis attempts to examine the relationship between corporate governance mechanisms and the companies’ performance based on ROA, ROE, and Tobin’s Q. The results from the regression analysis are presented in Table 3. with six separate regressions, two of each under each performance measure. The F-statistics of the regression models are statistically significant at less than one percent level implying goodness-of-fit of the regression equations. The R squared values range from 0.32 to 0.41 excepting one (.13) indicate that the models are capable of explaining variability ranging from 32 percent to 41 percent in the performance of the companies.
Table 3. Regressions of company performance variables on corporate governance mechanisms
Dependent Variable
Return on Assets (ROA)
Return on Equity (ROE)
Tobin's Q (TOBQ) Model-1
Pooled OLS
Model-2 Pooled OLS
Model-1 Pooled OLS
Model-2 Pooled OLS
Model-1 Pooled OLS
Model-2 Pooled OLS
LAG -0.08(-0.80)
[0.42]
0.58***(5.56) [0.00]
-0.16(-1.12) [0.26]
BSIZE -0.01(-1.47) [0.14
-0.01*(-1.77) [0.08]
-0.03(-0.89) [0.37]
-0.02(-0.66) [0.51]
0.04(0.30) [0.77]
0.08(0.51) [0.61]
18 INDD -0.02 (-0.45)
[0.65]
-0.02(-0.25) [0.80]
0.06(0.17) [0.86]
0.12(0.39) [0.69]
-0.09(-0.08) [0.94]
0.07(0.06) [0.95]
NINED 0.01(0.51) [0.61]
0.03(1.01) [0.31]
-0.01(-0.03) [0.97]
-0.10(-0.43) [0.67]
-0.12(-0.10) [0.92]
-0.03(-0.03) [0.98]
SDOWN -0.01(-1.10) [0.27]
-0.01(-0.81) [0.42]
-0.02(-0.28) [0.78]
0.05(1.26) [0.21]
0.13(1.10) [0.27]
0.13(0.78) [0.44]
INOWN -0.0004(-0.03) [0.98]
-0.001(-0.08) [0.93]
-0.12(-1.06) [0.29]
-0.12(-1.34) [0.18]
-0.29(-1.26) [0.21]
-0.45(-1.48) [0.14]
GPOWN 0.02(1.35) [0.18]
0.02*(1.95) [0.052]
-0.02(-0.33) [0.74]
0.06*(1.95) [0.051]
0.20(1.56) [0.12]
0.20(1.26) [0.21]
AUDCM 0.005*(1.66) [0.09]
0.003(0.77) [0.44]
0.01(0.48) [0.63]
-0.01(-0.94) [0.35]
0.01(0.46) [0.65]
-0.01(-0.14) [0.89]
CEORM 0.002(0.65) [0.52]
0.002(0.38) [0.70]
-0.01(-0.44) [0.66]
-0.02(-1.08) [0.28]
-0.03(-0.48) [0.63]
-0.06(-0.76) [0.45]
TASSETS -0.02*(-1.75) [0.08]
-0.02(-1.59) [0.11]
0.0003(0.01) [0.99]
0.01(0.53) [0.60]
-0.05(-0.53) [0.60]
-0.05(-0.40) [0.69]
DERATIO -0.004(-0.27) [0.79]
-0.002(-0.17) [0.87]
-0.07**(-2.17) [0.03]
-0.02(-0.83) [0.41]
0.13(1.19) [0.24]
0.22(1.60) [0.11]
Constant 0.28**(2.28) [0.02]
0.23(1.63) [0.103]
0.65(1.24) [0.22]
0.53(1.17) [0.24]
1.70(1.18) [0.24]
1.94(0.88) [0.38]
No. of Obs. 100 79 100 79 94 74
Time Dummies
YES YES YES YES YES YES
R-Squared 0.40 0.41 0.13 0.43 0.32 0.32
F-Test (p-value)
0.00 0.00 0.00 0.00 0.00 0.00
T-statistics in parentheses, p-values in square brackets.
***, **, and * indicate 1%, 5%, and 10% level of significance respectively.
Source: authors
The table shows that the results are largely consistent across all the models. Though the beta coefficient of the board size variable confirms to the expected inverse relationship with ROA and ROE as hypothesized before, the variable is found to be significant at 10 percent level of confidence while performance is measured only by ROA. The board size also shows no relationship with market performance. The inverse relation and the lack of relation respectively support the findings of Yermack (1996), Hermalin and Weisbach (2000), who suggest that the market perceives larger boards as ineffective as they tend to be symbolic rather than being part of the actual management process (Haniffa – Hudaib 2006). Neither of
19
the board composition variables (INDD and NINED) turned out to be significant in any of the models, hence hypotheses 2 and 3 are accepted. The results support the findings of Hermalin – Weisbach (2000), Weir et al. (2002) and (Haniffa – Hudaib 2006). The coefficient of CEO compensation variable is negative and insignificant in both the market measure and accounting measure (ROE) of performance, thereby rejecting hypothesis 4. The result is in keeping with the findings of Basu et al. (2007) who posits that relative to ownership and monitoring variables, excessive pay levels have a negative association with subsequent accounting performance. The audit committee variable (AUDCM) is found to have a significant relationship with accounting performance at a 10 percent level in model 1, so there is only weak support for hypothesis 5. The result supports the study conducted by Ho (2005).
Among the ownership structure variables, the extent of influence of directors’ ownership (SDOWN) and institutional ownership (INOWN) on performance in both the models are varied and in most of the cases negative but none of them turns to be significant, and thus we can accepting hypotheses 6 and 7. In contrast, the general public ownership (GPOWN) variable turns up not only with a positive impact but is also significant at the 10 percent confidence level in model 2 in the accounting measure of performance, which rejects hypothesis 8. The results of SDOWN and INOWN in this study largely support the findings of Lehmann and Weigand (2000), and Weir et al. (2002) and GPOWN conforms to the findings of Haniffa and Hudaib (2006). The coefficient of the control variable ‘DERATIO’ is not only negative in almost all the models but also significant at the 5 percent level in case of accounting measures of performance, which partially rejects hypothesis 9. The negative coefficient supports the findings of Weir et al. (2002), Haniffa – Hudaib (2006). The other control variable, company size (TASSETS), does not turn up to be significant other than in model 1 with the accounting measure (ROA) of performance and hence rejects hypothesis 10.
The negative coefficients and significance supports the findings of Haniffa and Hudaib (2006).
6.3. Test of the Regression Model
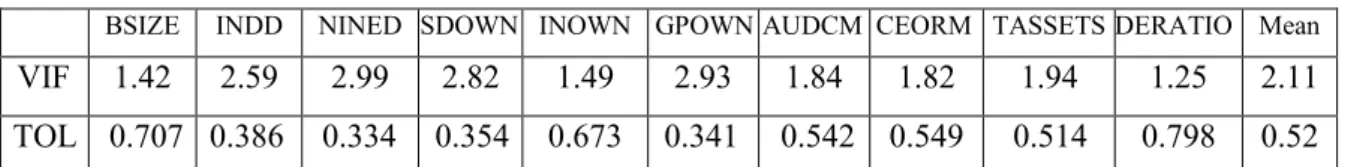
The test of muticollinearity, heteroskedasticity, and auto-correlation was performed with the help of the statistical package used to analyze the data. In addition to using the correlation coefficient matrix, Variance Inflation Factor (VIF) and Tolerance (TOL) have been used as a measures of multicollinearity. Table 4 shows that the estimated VIF (TOL) is far lower
20
(higher) than the threshold level (10 for VIF, 0 for TOL) and thus the estimated results are less likely to be affected by multicollinearity problem.
Table 4. Variance Inflation Factor (VIF) & Tolerance (TOL)
BSIZE INDD NINED SDOWN INOWN GPOWN AUDCM CEORM TASSETS DERATIO Mean
VIF 1.42 2.59 2.99 2.82 1.49 2.93 1.84 1.82 1.94 1.25 2.11 TOL 0.707 0.386 0.334 0.354 0.673 0.341 0.542 0.549 0.514 0.798 0.52
Source: authors
In order to check whether there is any heteroskedasticity in the regression, White’s general heteroskedasticity test has been applied where the null hypothesis is that there is no heteroskedasticity. All the regression models show that the calculated chi-square value does not exceed the critical chi-square and thus the null hypothesis is not rejected. In addition, heteroskedasticity and autocorrelation adjusted robust standard errors were used in the estimation.
Conclusions
The study reports the results of the extent of compliance with the statutory norms and guidelines relating to corporate governance mechanisms and the relationship between corporate governance mechanisms and financial performance of listed banking companies in Bangladesh. Because of possessing unique characteristics, banks are to work under close monitoring and the direct regulatory and supervisory policies promulgated by the central bank to protect the interest of shareholders as well as the depositors.
It is found that a good number of companies do not comply with the mandatory requirements for board size, appointment of independent directors in the board, and holding audit committee meetings set forth by the central bank and the SEC indicating a remarkable shortfall in corporate governance practice. The board is seen to have been prevalently dominated by outside non-independent directors having multiple directorships and the companies are actually run by professional managers having no duality and no ownership interest for which they have been compensated by much remuneration to curb agency conflict.
The rate of return on shareholders’ equity is constantly high. Apart from some inconsistent relationship of some governance variables, the corporate governance mechanisms do not appear to have a significant relationship with financial performances. Irrespective of the
21
models and the measures of performance, insignificant negative impact or somewhere no impact of independent directors and non-independent non-executive directors on the level of performance strongly support the concept that the managers are essentially worthy of trust and earn returns for the owners. The concept is called the stewardship theory which assumes that a steward protects and maximizes shareholders wealth through firm performance, because, by so doing the steward’s utility functions are maximized (Davis et al. 1997). The results support findings of a large volume of literature. The results contend that corporate governance ensures conformance but does not directly ensure performance, rather helps to achieve the desired performance of an organization. Good corporate governance with the goal of adopting strategic decision and risk management by efficient utilization of the organization’s resources can achieve performance.
The study is not fully free from flaws. It suffers from some limitations that pave the way for further avenue of research in this area. Firstly, the study used an OLS regression model. We also used a fixed-effects estimators in addition to the OLS with lagged variables as suggested by Bhagat and Bolton (2008) and Black and Kim (2008), which has not been reported because results did not differ from the OLS version. Further studies may test the link by using 2SLS or 3SLS estimators or System GMM. Secondly, as stated earlier there is few research in the area of governance structure and performance in the banking sector, so the results have been compared to the findings of other research in the non-financial sectors. In this case, the study may be considered as a pointer in this area in Bangladesh. Thirdly, only nine corporate governance variables have been considered in this study. Hence, there remains further scope for adding new variables such as effectiveness of board executive committees, performance of audit committees, multiple directorships of board members, directors incentives, and the threat of take-over. Finally, assessment of this complex topic has been studied from a rather narrow empirical perspective only based on information disclosed in the annual reports. The study could be enhanced further with questionnaires interviewing those involved in governance structure in the company and in the overseeing regulatory body of the company.
This study makes several contributes to the growing literature on corporate governance. There are few studies regarding corporate governance mechanisms and companies’ performance in developing countries. Very few such studies can be found in the context of the financial sector in Bangladesh. From this perspective, the study has immense value to the planners and regulators and will provide additional support for the view that while much emphasis on
22
corporate governance mechanisms is necessary to safeguard the interest of stakeholders, corporate governance on its own, as a set of codes or standards for corporate conformance cannot make a company successful. A company needs to balance corporate governance mechanisms (conformance) with performance by adopting strategic decisions and risk management with the efficient utilization of the organization’s resources.
Bibliography
ASB (2000): Statement of financial performance, FRED 22, Revision of FRS 3, Reporting Financial Performance. London:
Agrawal, A. – Knoeber, C. R. (1996): Firm Performance and Mechanisms to Control Agency Problems Between Manager and Shareholders. Journal of Financial and Quantitative Analysis, 31: 377–89.
Banking Reform Commission (1999): The Report of the Banking Reform Commission.
Government of Bangladesh.
Basu, S. – Hwang L. S. – Mitsudome T. – Weintrop J. (2007): Corporate Governance, top Executive Compensation and Firm Performance in Japan. Pacific-Basin Finance Journal, 15(1): 56-79.
Baysinger, B. – Hoskisson, D. R. E. (1990): The Composition of Boards of Directors and Strategic Control: Effects on Corporate Strategy. Academy of Management Review, 15:
72–87.
Becht, M. – Bolton, P. – Röell, A. (2005): Corporate Governance and Control. Financial Working Paper no. 02/2002
BEI (2003): A Comparative Analysis of Corporate Governance in South Asia: Charting a Roadmap for Bangladesh, Dhaka.
Bhagat, S. – Black B. (1998): Board Independence and Long term Performance. Working Paper, University of Colorado, Boulder.
Bhagat, S. – Bolton, B. (2008): Corporate Governance and Firm Performance. Journal of Corporate Finance, 14(3): 257-273.
Black, B. S. –Kim, W. (2008): The Effect of Board Structure on Firm Value: A Multiple Identification Strategies Approach Using Korean Data. McCombs Research Paper, No.
FIN-02-07
Brick, I. E. – Palmon, O. – Wald, J. K. (2006): CEO Compensation, Director Compensation, and Firm Performance: Evidence of Cronyism? Journal of Corporate Finance, 12(3):
403-423.
23
Chen, M. – Lee, K. C. (2008): Compensation, Corporate Governance and Owner
Shareholding: Theory and Evidence from Family Ownership. International Research Journal of Finance and Economics, 22: 144-162.
Chiang, H. (2005): An Empirical Study of Corporate Governance and Corporate Performance.
The Journal of American Academy of Business, 6(1): 95-101.
Choi, J. J. – Park, S. W. – Yoo, S. S. (2007): The value of outside directors: Evidence from corporate governance reform in Korea. Journal of Financial and Quantitative Analysis, 42: 941-962.
Coles, J. W. – Victoria, B. M. – Nilanjan, S. (2001): An examination of the relationship of governance mechanisms to performance. Journal of Management, 27 (2001) 23-50.
Conyon, M. J. – Schwalbach, J. (2000): Executive Compensation: Evidence from the UK and Germany. Long Range Planning, 33(4): 504-526.
Davis, J. H. – Schoorman, F. D. – Donaldson, L. (1997): Toward a Stewardship Theory of Management. Academy of Management Review, 22: 20-47.
Demsetz, H. – Villalonga, B. (2001): Ownership Structure and Corporate Performance.
Journal of Corporate Finance, 7: 209–33.
Dhandirek, R. – Tang, J. (2003): Corporate Governance problems in Thailand: Is ownership concentration the cause? Asia Pacific Business Review, 10: 121-138.
Duffhues, P. – Kabir, R. (2008): Is the Pay-Performance Relationship Always Positive?:
Evidence from the Netherlands. Journal of Multinational Financial Management, 18(1):
45-60.
Fahy, M. – Roche, J. – Weiner, A. (2005): Beyond Governance –Creating Corporate value through Performance, Conformance and responsibility. John Wiley & Sons.
Fishman, J. – Gannon, G. – Vinning, R. (2005): Ownership structure and corporate
performance: Australian evidence. Unpublished working paper, Social Science Review Network.
Gregory, H. J. – Simms, M. E. (1999): Corporate Governance: What it is and Why it Matters.
The 9th International Anti-Corruption Conference (Kuala Lumpur).
Gujarati, D. (2004): Basic Econometrics. Singapore: McGraw-Hill.
Haniffa, R. – Hudaib, M. (2006): Corporate Governance Structure and Performance of Malaysian Listed Companies. Journal of Business Finance & Accounting, 33(7-8): 1034- 1062
Hermalin, S. – Weisbach, M. (1991): The Effects of Board Composition and Direct Incentives on Firm Performance. Financial Management, 20: 101–12.
24
Hermalin, S. – Weisbach, M. (2000): Boards of Directors as an Endogenously. University of California, Berkeley.
Himmelberg, C. P. – Hubbard, R. G. – Palia, D. (1999): Understanding the determinants of managerial ownership and the link between ownership and performance. Journal of Financial Economics, 53(3): 353-384.
Holderness, C. G. – Sheehan, D. P. (1988): The Role of Majority Shareholders in Publicly Held Corporations: An Exploratory Analysis. Journal of Financial Economics, 20: 317- 346.
Ho, C. K. (2005): Corporate Governance and Corporate Competitiveness: an international analysis. Corporate Governance: An International Review, 13(2): 211-253.
Holthausen, R. – Larcker, D. (1993): Board of Directors, Ownership Structure and CEO Compensation, Working Paper, University of Pennsylvania.
Jensen, M. C. – Meckling, W. H. (1976): Theory of the Firm, Managerial Behaviors, Agency Costs and Ownership Structure. Journal of Financial Economics, 3(4): 305-306.
Jensen, M. C. (1986): Agency Cost of Free Cash Flow, Corporate Finance and Take-overs.
American Economic Review, 76: 323-39.
Jensen, M. C. (1993): The Modern Industrial Revolution, Exit, and the Failure of Internal Control Systems. Journal of Finance, 48: 831–80.
Jonathan, J. S. (2007): Corporate Governance and Accountability. Chichester: John Wiley &
Sons.
Klein, A. (1998): Firm Performance and Board Committee Structure. Journal of Law and Economics, 41(1): 275-303.
Krivogorsky, V. (2006): Ownership, board structure and performance in Continental Europe.
The International Journal of Accounting, 41: 176-197.
Lehmann, E. – Weigand, J. (2000): Does the Governed Corporation Perform Better?
Governance Structures and Corporate Performance in Germany. European Finance Review, 4(2): 157-195.
Leech, D. –Leahy, J. (1991): Ownership Structure, Control Type, Classifications and the Performance of Large British Companies. Economic Journal, 101: 1418–1437.
Lemmon, M. L. – Lins, K.V. (2003): Ownership Structure, Corporate Governance, and Firm Value: Evidence from the East Asian Financial Crisis. Journal of Finance, 58(4): 1445- 1468.
Li, M. – Simerly, R. (1998): The Moderating Effect of Environmental Dynamism on
Ownership and Performance Relationship. Strategic Management Journal, 19: 169– 79.
25
Monks, R. – Minow, N. (1995): Corporate Governance. Cambridge: Basil Blackwell.
Murali, R. – Welch, J. B. (1989): Agents, Owners, Control and Performance. Journal of Business Finance & Accounting, 16: 385–98.
PAIB Committee of IFAC (2004): Enterprise Governance – Getting the Balance Right.
International Federation of Accountants
Rose, C. (2005): Managerial Ownership and Firm Performance in Listed Danish Firms: In Search of the Missing Link. European Management Journal, 23(5): 542-553.
Short, H. – Keasey, K. (1999): Managerial Ownership and The Performance of Firms:
Evidence from The UK. Journal of Corporate Finance, 5(1): 79-101.
Wang, J. L. – Jeng, V. – Peng, J. L. (2007): The impact of corporate governance structure on the efficiency performance of insurance companies in Taiwan. The Geneva Papers on Risk and Insurance: Issue and Practice, 32: 264-282.
Weir, C. – Laing D. (1999): The Governance-Performance Relationship: The Effects of Cadbury Compliance on UK Quoted Companies. European Accounting Conference (Bordeaux).
Weir, C. – Laing, D. – McKnight, P. J. (2002): Internal and External Governance
Mechanisms: Their Impact on the Performance of Large UK Public Companies. Journal of Business Finance & Accounting , 29: 579–611.
Yermack, D. (1996): Higher Market Valuation of Companies with a Small Board of Directors. Journal of Financial Economics, 40: 185–211.