CORVINUS JOURNAL OF SOCIOLOGY AND SOCIAL POLICY Vol.2 (2011) 2, 3–26
The effecTs of social capiTal on wage income: a mulTi-counTry analysis
1Zoltán Hermann2–marianna KopasZ3
AbstrAct We analyze the effect of individual social capital on wage income in European countries. A number of studies have already tested the earnings effects of social ties but the majority of them have been limited to small samples and/or to certain occupations. The major contribution of the paper is its assessment of the earnings effects of social capital in a multi-country context using a large international dataset, the EU-SILC. We estimate individual level earnings regressions for a pooled sample and for individual countries as well. Three indicators are used to measure social capital: memberships in voluntary organizations, the frequency of contacts with friends and frequency of contacts with relatives. Results indicate a significant positive association between social capital and wage income both for the pooled sample and the majority of the countries individually. The effect of social capital is stronger for post-socialist countries than for other countries while it is almost missing in the Nordic countries. Comparing the effects of memberships in voluntary organizations, friendship and kinship ties provides some support for the strength of weak ties hypothesis.
Keywords social capital, weak ties, post-socialist countries, EU-SILC
1 An earlier version of this paper was prepared as Research Note 8/2008 of the „European Observatory on the Social Situation - Network on Social Inclusion and Income Distribution”, contracted by Tárki Social Research Institute. Further details on the observatory can be found at www.socialsituation.eu
2 Zoltán Hermann is research fellow at the Institute of Economics of Hungarian Academy of Sciences, e-mail: hermann@econ.core.hu
3 Marianna Kopasz (corresponding author) is research fellow at the Social Science Centre of Hungarian Academy of Sciences, e-mail: marianna.kopasz@gmail.com
4 ZOLTÁN HERMANN–MARIANNA KOPASZ
inTroDucTion
It is a widely held view both in sociology and economics that human capital is the most important factor in determining life chances in Western societies.
However, in the past several decades a number of studies have demonstrated the role of social connections in life chances, including chances on the labor market.
This paper is concerned with the effects of social capital on wage income in European countries. More specifically, we seek to answer the following questions: First, whether social capital has an effect on individual income.
Second, whether weak ties (remote friends, acquaintances) have a stronger effect on income than strong ties (relatives, close friends) do. Or, stating it differently; does the strength of ties matter, as theory suggests. Third, we inquire whether the income effect of social connections is more pronounced in post-socialist countries than in countries with different pasts.
A number of studies have already tested the earnings effects of social ties.
The majority have been limited to small samples and/or to certain occupations, such as managers (Boxman et al. 1991; Barros 2006), or to the self-employed (Gomez and Santor 2001). To the best of our knowledge, this is the first attempt to assess the earnings effects of social capital on nationally representative samples in a multi-country context. We estimate individual level earnings regressions for 26 countries: the EU-25 countries (except Malta) and two non- EU members: Norway and Iceland. We use data from the 2006 wave of the EU-SILC (Community Statistics on Income and Living Conditions) survey.
The remaining part of the paper is structured as follows: In the next section we firstly outline the theoretical background of our research and then formulate our hypotheses. We also provide a brief overview of research findings on the earnings effect of social capital. In Section 3 we describe the survey and the data and then detail econometric specifications. In Section 4 we discuss the measurement of social capital and specify the explanatory variables of the model. Our results are presented in Section 5. We also discuss some problems with the estimation of returns on social capital here. Finally, Section 6 summarizes the main findings.
2. TheoreTical BacKgrounD anD hypoTheses In this paper, we treat social capital as being individual level resources.
Following Lin’s (2001) definition, social capital is conceived as being
“resources embedded in one’s social network, resources that can be accessed
5 THE EFFECTS OF SOCIAL CAPITAL ON WAGE INCOME: A MULTI-COUNTRY ANALYSIS
or mobilized through ties in the networks”. Social capital thus conceived has been hypothesized to cause a number of positive effects, such as better educational attainment, jobs with higher earnings, higher occupational status, entrepreneurial success, physical or mental health, and subjective well-being, etc. In this paper, we focus on the income effects of social capital.
Social capital theories provide different answers to the question of what the sources of social capital are, or what factors influence the benefits accruing to an individual from/the utility of social capital. Broadly, three different perspectives can be distinguished.
In his seminal paper, Granovetter (1973) lays the emphasis on the strength of social ties; i.e. whether ties are weak or strong. The strength of a tie in his approach depends on the amount of time, emotional intensity, the intimacy and the reciprocal services which characterize the tie. Accordingly, acquaintances are usually labeled as being weak ties, while relatives and close friends are strong ties. Granovetter (1973) argues that weak ties are more likely than strong ties to be sources of information about job openings. This argument is based on the fact that one’s close friends tend to know each other and have social networks similar to each other. Therefore, information on jobs held by close friends is often redundant. On the contrary, one’s acquaintances are less likely to know each other and will tend to have different social networks. Thus, the individual’s acquaintances are more likely to have access to information different to that which the individual receives.
Reformulating Granovetter’s strength of weak ties hypothesis, Burt (1992;
1997) argues that what really matters is not the strength (or weakness) of ties but the network position of individuals. The theory of structural holes claims that whether a tie is strong or weak it generates benefits when it is a bridge over a structural hole; that is, when it connects such parts of the social network (clusters) that are otherwise disconnected. In this theory, the benefits of social capital result from the diversity of information and the brokerage opportunities created by the lack of a connection between separate clusters in the social network. Burt (1992) assumes that structural holes have effects on individuals getting better positions or rewards in organizations.
The social resources theory focuses on the resources embedded in one’s social network (Lin et al. 1981). Lin et al. (1981) argue that it is not the weakness of a tie (or its bridging potential) in itself that conveys advantages.
Job searching through social ties will be most successful when the contact is a person of higher status. Whether the job seeker can reach a high status contact depends on both his/her social position (initially family background, but eventually educational and occupational achievements) and his/her use of-weak ties.
6 ZOLTÁN HERMANN–MARIANNA KOPASZ
A number of studies have already tested the earnings effects of social capital. Some of these studies choose human capital theory as a starting point.
This line of research focuses on the relationships between human capital, social capital, and income. For the majority of studies, theories by Bourdieu (1986) and Coleman (1988) serve to provide a framework. In an influential paper, Boxman, De Graaf, and Flap (1991) attempt to determine the relative contribution of human capital and social capital to income generation. More recently, Barros (2006) formulated a similar research question. Buerkle and Guseva (2002) hypothesize that social capital gained while in school has an independent effect on income.
Another stream of research focuses on the impact of job seekers’ social ties on labor market outcomes. These studies have been inspired by Granovetter’s (1973) theory of the “strength of weak ties” and by an extension of this theory by Lin and his collaborators (Lin et al., 1981). The central hypothesis of this research is that the use of weak ties as a job seeking method provides better jobs in terms of higher prestige and/or higher income (e.g. Bridges and Villemez, 1986; Wegener, 1991).
In this paper, we intend to contribute to the latter line of research. However, our investigation differs from the former in some important respects. First, we focus only on the income effects of social capital (i.e. the other labor market effects of social ties are ignored). Second, we will argue that social capital can affect income not only through the job finding method (formal vs. informal) but through other mechanisms as well. In this study, we therefore present three hypotheses. The first two refer to the income effects of social capital, while the third is a comparative hypothesis that specifies in which countries we expect the effect of social capital to be most pronounced.
h1: The more network resources an employee has access to, the higher his/her income will be. To put this simply, social capital has a positive effect on wage income.
To explain why social network resources generate benefits in terms of higher income at least three different mechanisms can be outlined. First, network resources facilitate the flow of information. Social ties – especially with those in a strategic network position and/or with those of high social status – can provide an individual with useful information about job opportunities otherwise unavailable. A related advantage is that the information provided by social connections is richer in content than the information acquired through impersonal mechanisms (Ganovetter, 1995). Second, social ties may exert influence on those persons who play an important role in decisions on hiring
7 THE EFFECTS OF SOCIAL CAPITAL ON WAGE INCOME: A MULTI-COUNTRY ANALYSIS
or promotions (Lin, 1999). Third, having access to social network resources reassures decision-makers (e.g. recruiters) that the individual can provide additional resources beyond his/her personal capabilities which can be useful to the organization. In other words, social network resources may function as certifications of the individual’s “social credentials” (Lin, 1999). In addition, as Flap et al. (1986) point out, social capital not only helps an individual obtain a better job and obtain it fast, but also helps the individual preserve it for a longer time.
Previous empirical research provides evidence for the earnings effects of social capital. In a study on the income attainment of Dutch managers, Boxman et al. (1991) find that social capital has a positive effect on income. They also conclude that social capital and human capital can act as substitutes for each other. In the income attainment process social capital helps at any level of human capital, but human capital does not make a difference at the highest level of social capital (Boxman et al. 1991). Recently, Barros (2006) replicates these findings using a sample of Portuguese cooperative managers.
h2: weak ties have a stronger effect on income than strong ties do.
Granovetter (1973) argues that weak ties are more likely to have access to non-redundant information. Thus, weak ties are more often the sources of information about opportunities. In principle, both strong and weak ties may span a structural hole and thus generate information as well as control benefits (Burt 1992). Yet weak ties are more likely to be a bridge than strong ties. Given that, potentially, there are more bridges among an individual’s weak ties than among his/her strong ties, we can hypothesize that weak ties have greater effects on earnings than strong ties do. In what follows, we use the terminology introduced by Granovetter (1973) as ‘strong’ and ‘weak’ ties can be more easily operationalized than ‘structural holes’.
Previous studies have demonstrated that weak ties are a common source of finding jobs and thereby play an important role in matching workers and jobs (Granovetter 1973). Examining professional, technical, and managerial workers, Granovetter (1974) also found that weak ties lead to better jobs in terms of income than strong ties do. Motivated by Granovetter’s findings, much empirical work has been done to validate the effects of weak ties on income. The results, however, are generally not supportive. Though, Bridges and Villemez (1986), and Marsden and Hurlbert (1988) find that individuals that obtained their jobs through weak ties have higher wages on average, the relationship is insignificant once control variables are introduced. Wegener (1991) finds, however, that weak ties lead to higher status jobs only in the
8 ZOLTÁN HERMANN–MARIANNA KOPASZ
case of individuals who formerly held high status jobs (whereas individuals who formerly held low status jobs do not benefit from weak ties).
Nevertheless, it is important to note that what the above studies estimate is the effect of the job finding method (formal method vs. informal channel - weak ties or strong ties) on income. To re-state this, they test the hypothesis that weak ties offer superior job information that leads to better jobs (Tassier, 2006). These studies focus on ties that were actually used in the (current) job finding process without much attention to the total volume of social capital (Boxman et al., 1991). This approach to measuring the effect of weak ties on income therefore underestimates the effect (Tassier, 2006). Beyond the job- finding process, there are many ways in which social connections can generate benefits in terms of higher income (Boxman et al., 1991). For example, social connections may also have helped one receive his/her previous job – that then launched a successful career trajectory (Buerkle and Guseva, 2002).
Boxman et al. (1991) therefore take a step further when they measure the total volume of social capital (i.e. not only mobilized social capital) in assessing its influence on income. In their previously-mentioned empirical study they find that social capital, measured by the number of memberships in elite clubs and contacts with people in other organizations, has a substantial direct influence on income.
Finally, we note that some authors have recently proposed and tested new hypotheses on the income effects of social ties. Growiec and Growiec (2007) hypothesize that the relationship between the amount of time invested in the building of bridging social capital (i.e. weak ties) and earnings is an inverse U-shaped relationship, while the effect of bonding social capital (i.e. strong ties) on earnings is negative. Through analyzing Polish data they find that bridging social capital (i.e. weak ties), proxied by the number of friends with whom the individual have frequent contact4, has a positive and significant effect on earnings. Interestingly, they find no significant correlation between the number of frequently contacted acquaintances and earnings. According to their results, bonding social capital (i.e. strong ties), proxied by the number of family members with whom the individual has frequent contact, exerts a negative effect on income.
4 We note that the number of friends with whom one has frequent contact is at least as much a proxy for bonding ties as it is for bridging ties. Based on the homophily principle (i.e. that people prefer to interact with others who share the same social characteristics), frequently contacted friends are more likely to represent ‘bonding’ than ‘bridging’ ties.
9 THE EFFECTS OF SOCIAL CAPITAL ON WAGE INCOME: A MULTI-COUNTRY ANALYSIS
h3: network resources in general matter more in post-socialist countries than in countries with no history of state socialism. we therefore expect that the earnings effects of social networks will be most pronounced in post-socialist societies.
This hypothesis rests on a study by Sik (1995) on the scope and role of network capital5 in communist, capitalist and post-communist societies. The study argues that network capital is more widespread under communism than capitalism for two major reasons. The first reason is the cultural legacy, as well as historical and political developments. The other reason is that communist countries are characterized by being under considerable socioeconomic pressure (e.g. permanent shortages of goods, over and under-regulation of the redistributive system, etc.), which provides an environment favorable to the maintenance and further development of network capital. Within the shortage economies of state socialism social connections are a key element of individual and household strategies of survival (see, e.g. Kolankiewicz, 1996). Sik (1995) goes further and argues that networking becomes at least as widespread in post-communism as when under communism due to the great inertia characterizing the networks on the one hand, and the growing uncertainty associated with the transformation process on the other (see also King, 2000).
3. DaTa anD moDel specificaTion
We use data from the 2006 wave of the EU-SILC (Community Statistics on Income and Living Conditions) survey. The data cover 26 countries; the EU- 25 countries (excluding Malta), plus Norway and Iceland. The total number of respondents who were asked to answer the questionnaire module concerning their social ties is 377,462. Our estimation sample is restricted to 155,873 cases, in accordance with the research question and due to data limitations.
Since we analyze the impact of social capital on wage income, we excluded from the sample those who in the previous year: (1) had no wage income; or (2) worked less than 6 months; (3) had more self-employed income than wage income, and those; (4) where data was missing on educational attainment.
The dependent variable in this study is yearly employee gross cash (or near
5 “Network capital” is conceived as being a crucial form of social capital that includes long term altruistic kin relations, balanced reciprocity, lasting and multipurpose patron-client relations, etc. (see Sik, 1995).
10 ZOLTÁN HERMANN–MARIANNA KOPASZ
cash) income in the prior year (more precisely, the natural logarithm of yearly income). Income data do not include social transfers. We have no information on whether income data refer to the main job alone or multiple jobs, but income from self-employment is not included in the dataset.
The econometric specification employed is based on a modified version of the standard Mincerian wage equation. We deviate from the standard specification in using educational attainment dummies instead of years of schooling and in adding social capital and a broad set of control variables and country fixed effects. In order to explore the impact of social capital on wage income, we estimate the following model:
(1)
where W denotes wage income for the previous year, S is educational attainment, E is potential work experience, O, F and R are measures of social capital; membership in organizations, and the intensity of relationships with friends and relatives, respectively, and X is a vector of control variables. α, β, γ and δ are estimated parameters and ε is the residual. C denotes country dummies and η-s are their coefficients. Index j stands for countries, while i denotes individuals. Note that the country fixed effects control for any differences in the level of income and/or social capital between countries.
The identification of the effect of social capital relies solely on within-country variation, though the effect is constrained to be the same for the whole sample (i.e. for all countries).
Besides the pooled model, we also estimate separate regressions for each country in order to explore differences in the effect of social capital variables.
Country regressions follow the same specification as the pooled model (excluding country fixed effects). To check robustness these estimates also reveal whether social capital effects are common in most countries, or present in only a few.
The parameters of main interest are γ o, γ f and γ r. In the semi-log specification the value of these multiplied by one hundred can approximately be interpreted as a percentage change in income. Since social capital is measured using dummy variables (see below), this means that individuals with social capital of a given level on average earn approximately γx100 percent more than individuals in the reference category (i.e. individuals with the lowest level of social capital), ceteris paribus.
In order to test Hypothesis 3 we re-estimated the pooled model supplemented with interaction terms between social capital variables and a post-socialist country dummy:
9 3. DATA AND MODEL SPECIFICATION
We use data from the 2006 wave of the EU-SILC (Community Statistics on Income and Living Conditions) survey. The data cover 26 countries; the EU-25 countries (excluding Malta), plus Norway and Iceland. The total number of respondents who were asked to answer the questionnaire module concerning their social ties is 377,462. Our estimation sample is restricted to 155,873 cases, in accordance with the research question and due to data limitations. Since we analyze the impact of social capital on wage income, we excluded from the sample those who in the previous year: (1) had no wage income; or (2) worked less than 6 months; (3) had more self-employed income than wage income, and those; (4) where data was missing on educational attainment. The dependent variable in this study is yearly employee gross cash (or near cash) income in the prior year (more precisely, the natural logarithm of yearly income). Income data do not include social transfers. We have no information on whether income data refer to the main job alone or multiple jobs, but income from self- employment is not included in the dataset.
The econometric specification employed is based on a modified version of the standard Mincerian wage equation. We deviate from the standard specification in using educational attainment dummies instead of years of schooling and in adding social capital and a broad set of control variables and country fixed effects. In order to explore the impact of social capital on wage income, we estimate the following model:
(1) r ij ij j j j ij
f ij o ij ij ij ij
ij S E E O F R X C
W DE1 E2 E3 2J J J G
¦
K H logwhere W denotes wage income for the previous year, S is educational attainment, E is potential work experience, O, F and R are measures of social capital; membership in organizations, and the intensity of relationships with friends and relatives, respectively, and X
11 THE EFFECTS OF SOCIAL CAPITAL ON WAGE INCOME: A MULTI-COUNTRY ANALYSIS
(2)
where P denotes post-socialist countries and the π-s are the coefficients of the interaction terms.
As wage equations usually produce different results for men and women, all models are estimated separately. Taking into account the SILC sampling procedures, probability weights are used to ensure that the sample represents the target population, with the sum of weights equal for each country and standard errors clustered at the household level (the primary sampling unit in most of the countries) – allowing for a correlation among the residual terms within households.
4. measuremenT of Key VariaBles 4.1 measures of social capital
Ideally, both the potential capacity of social capital (accessed social capital) and actual use of social capital (mobilized social capital) should be measured (Lin, 2008). Here we have to restrict ourselves to measuring only the potential capacity of social capital. To operationalize strong and weak ties one would need multiple indicators. This criterion, however, is very rarely met in a multi-country survey.
Three types of social capital measures are employed in the analysis. The first measure is the intensity of contacts with relatives (this refers not only to the person that the individual is in contact with most often). This appears to be an appropriate proxy for the potential resources from strong ties an individual has access to. Unfortunately, no data is available on the number of relatives with whom the respondents keep contact. Further, we lack any information on other characteristics of the relationships.
Another measure of social capital is the intensity of contacts with friends (here again, not only the person that the respondent contacts most often is considered). Since no additional information on friends is available from the survey we cannot draw a distinction between close friends (confidantes) and remote friends (although close friends should be treated as strong ties and remote friends as weak ties). This proxy thus measures partly strong and partly weak ties and is therefore not an ideal proxy for testing the strength of the weak tie hypothesis.
10
is a vector of control variables. Į, ȕ, Ȗ and į are estimated parameters and İ is the residual. C denotes country dummies and Ș-s are their coefficients. Index j stands for countries, while i denotes individuals. Note that the country fixed effects control for any differences in the level of income and/or social capital between countries. The identification of the effect of social capital relies solely on within-country variation, though the effect is constrained to be the same for the whole sample (i.e. for all countries).
Besides the pooled model, we also estimate separate regressions for each country in order to explore differences in the effect of social capital variables. Country regressions follow the same specification as the pooled model (excluding country fixed effects). To check robustness these estimates also reveal whether social capital effects are common in most countries, or present in only a few.
The parameters of main interest are Ȗo, Ȗf and Ȗr. In the semi-log specification the value of these multiplied by one hundred can approximately be interpreted as a percentage change in income. Since social capital is measured using dummy variables (see below), this means that individuals with social capital of a given level on average earn approximately Ȗx100 percent more than individuals in the reference category (i.e. individuals with the lowest level of social capital), ceteris paribus.
In order to test Hypothesis 3 we re-estimated the pooled model supplemented with interaction terms between social capital variables and a post-socialist country dummy:
(2)
j j j ij ij
j r ij j f ij
j o ij r ij f ij o ij ij ij ij ij
C X
P R P F
P O R F O E
E S W
H K G
S S
S J J J E E E D
¦
2 3 2
log 1
where P denotes post-socialist countries and the ʌ-s are the coefficients of the interaction terms.
12 ZOLTÁN HERMANN–MARIANNA KOPASZ
The ‘intensity of contacts’ variables were coded into six categories in the survey. Since no significant differences were found between the categories of
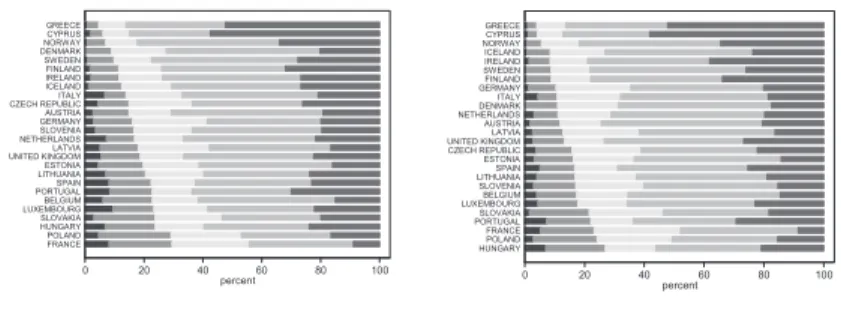
‘once a month’ and ‘once a year at least’, we merged the two categories into one. Thus we use five categories in the model: contact daily, weekly, several times a month, once a month or less frequently, and never (considering ‘once a month or less frequently’ as the reference category)6. Figure 1 and 2 present the distribution of population according to the intensity of contacts with friends and relatives. The figures reveal marked differences among countries.
Contacts with friends and relatives are in general most frequent in Cyprus, Greece and the Scandinavian countries.
Membership in voluntary organizations appears to be a more appropriate proxy for weak ties than intensity of contacts with friends. An empirical study on voluntary organizations (Bekkers et al. 2004) provides evidence that the social networks of those who are members of voluntary organizations have better access to network resources than the social networks of non-members.
Therefore, in the analysis, weak ties are proxied by the number of memberships in different types of voluntary organizations.
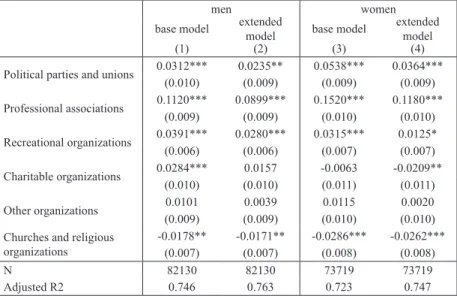
In the SILC survey respondents were asked about memberships in six types of voluntary organizations: political parties or trade unions, professional associations, churches and other religious organizations, recreational groups or organizations and ‘other groups or organizations’. We use the number of memberships in voluntary organizations as a proxy for weak ties. When calculating the number of organization memberships, we omitted churches and other religious organizations since our initial analysis revealed that these types of organizations behave differently to the other types (see in Section 5.1 the detailed results on the different types of organizations). Further, as we cannot safely assume that the relationship between the number of organization memberships and income is linear, the number of organization memberships is operationalized as a set of dummy variables. Since the sample is quite unevenly distributed with respect to the number of organizations in which respondents are affiliated we use four categories in the analysis: no membership (reference category), membership in one, two or three or more types of organizations7. The distribution of the population according to organization membership for each country is displayed in Figure 3. Membership in voluntary organizations is most
6 In the individual country regressions, the categories ’once a month or less frequently’ and
‘never’ are also combined into one due to the small number of respondents reporting ‘never’.
7 In the individual country regressions, ‘two’ and ‘three or more types’ are also combined (into
‘two or more types’) due to the small number of observations within the ‘three or more types’
category.
13 THE EFFECTS OF SOCIAL CAPITAL ON WAGE INCOME: A MULTI-COUNTRY ANALYSIS
common in the Netherlands and the Nordic countries. Post-socialist countries tend to cluster at the bottom of the list, except for Slovenia and Slovakia.25
Figure 1 Frequency of contact with friends
0 20 40 60 80 100
percent FRANCE
POLAND HUNGARY SLOVAKIA LUXEMBOURGPORTUGALLITHUANIABELGIUMESTONIASPAIN UNITED KINGDOMCZECH REPUBLICNETHERLANDSSLOVENIAGERMANYDENMARKSWEDENNORWAYAUSTRIAICELANDIRELANDFINLANDGREECECYPRUSLATVIAITALY
0 20 40 60 80 100
percent HUNGARYPOLANDFRANCE
PORTUGALSLOVAKIA LUXEMBOURGLITHUANIASLOVENIABELGIUMESTONIASPAIN CZECH REPUBLIC UNITED KINGDOMNETHERLANDSGERMANYDENMARKNORWAYAUSTRIASWEDENIRELANDICELANDFINLANDCYPRUSGREECELATVIAITALY
men women
Left to right: never, once a month or less, several times a month, weekly, daily.
Figure 2 Frequency of contact with relatives
0 20 40 60 80 100
percent LATVIA
SLOVENIAESTONIAAUSTRIAPOLAND LITHUANIA LUXEMBOURGPORTUGALHUNGARYFRANCESPAIN UNITED KINGDOMCZECH REPUBLICNETHERLANDSSLOVAKIAGERMANYDENMARKBELGIUMSWEDENNORWAYIRELANDICELANDFINLANDGREECECYPRUSITALY
0 20 40 60 80 100
percent POLANDLATVIA
ESTONIA SLOVENIAAUSTRIA LITHUANIAHUNGARYSLOVAKIA PORTUGALGERMANY LUXEMBOURGFRANCESPAINITALY UNITED KINGDOMIRELAND CZECH REPUBLICNETHERLANDSDENMARKNORWAYBELGIUMSWEDENFINLANDICELANDGREECECYPRUS
men women
Left to right: never, once a month or less, several times a month, weekly, daily.
Figure 3 Membership in different types of voluntary organizations
0 20 40 60 80 100
percent LATVIA
LITHUANIAHUNGARYESTONIAPOLAND PORTUGALGREECEFRANCESPAINITALY CZECH REPUBLICGERMANYSLOVAKIAAUSTRIA UNITED KINGDOMNETHERLANDSLUXEMBOURGDENMARKSLOVENIABELGIUMNORWAYSWEDENFINLANDIRELANDICELANDCYPRUS
0 20 40 60 80 100
percent LITHUANIA
PORTUGALHUNGARYESTONIAPOLANDGREECEFRANCELATVIAITALY CZECH REPUBLICGERMANYSLOVAKIAAUSTRIABELGIUMSPAIN UNITED KINGDOMNETHERLANDSLUXEMBOURGSLOVENIADENMARKNORWAYIRELANDSWEDENICELANDCYPRUSFINLAND
men women
Left to right: no membership, membership in 1 type, 2 types, 3 or more types of organizations (excluding churches and religious organizations).
14 ZOLTÁN HERMANN–MARIANNA KOPASZ
4.2 control variables
According to human capital theory, the most important determinants of earnings are schooling and work experience. Schooling is measured by a set of dummy variables, since using years of schooling often proves to be a restrictive assumption (see e.g. Björklund and Kjellström, 2002), and if social capital is related to educational attainment, this could result in omitted variable bias. Experience is not observed directly in our data. In the absence of this, potential experience is calculated as age minus the country median age of reaching the educational attainment of the respondent.
Additional control variables are also included in the model in order to control for individual heterogeneity possibly correlated with both wages and social capital. To test the hypotheses, we estimated two variants of the wage equations: a base and an extended specification. In the base model, we control for labor market activity in the previous year and working hours (required as the dependent variable is yearly wage income). The base model further includes those demographic characteristics that are possibly related to both labor supply and social capital, such as sex, marital status, number of children, dummies for the country of birth and for citizenship, the size of the settlement in which the individual lives (population of either less than or more than 50000), and dummies indicating the missing values for the right hand side variables.
The second model (extended model) adds to the first dummies for economic sectors and occupation. The occupational dummies follow the classification of ISCO occupational categories into five groups, as suggested by O’Rourke and Sinnott (2001). The effect of these variables on the estimated impact of social capital is somewhat ambiguous. First, if social capital provides access to jobs in occupations or economic sectors with higher than average wages, the impact of social capital is underestimated when these additional control variables are included in the estimates, providing conservative estimates.
Second, if there is a correlation between social capital and occupation and economic sector – beside any casual effect of social capital on the additional control variables – ignoring this can result in either upward or downwardly biased estimates of the impact of social capital on wages. For example, economic sector and occupation dummies can in part take on the unobserved effect of settlement size, due to the different economic characteristics of urban and rural areas. This could be important since the level of our observed social capital variables may well differ among metropolitan, medium-sized and small town and small village environments, but unfortunately we cannot directly control for settlement characteristics beyond distinguishing between settlements with more or less than 50000 inhabitants. Overall, the effect of
15 THE EFFECTS OF SOCIAL CAPITAL ON WAGE INCOME: A MULTI-COUNTRY ANALYSIS
any social capital proxy will be considered robust only if it proves to be significant in both the base and the extended models.
5. resulTs
5.1 results for the pooled sample
The results for the pooled sample are presented in Table 1. Coefficients for social capital variables are generally statistically significant and have the expected signs. The results for men and women are almost identical thus we will not discuss them separately.
Membership in voluntary organizations is positively associated with higher income. However, membership in more than one organization generally does not imply further increases in income compared to membership in only one organization. As expected, the coefficients are smaller in the extended models where the economic sector and broad categories of occupation status are controlled for. Altogether, organizational membership is associated with about a 2 to 6 percent income advantage.
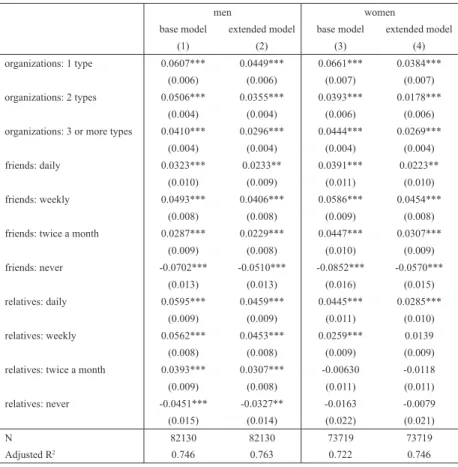
Analysis of the distinct types of organizations reveals a considerable heterogeneity (Table 2). Membership in political parties or trade unions, professional associations, and in recreational groups is associated with significantly higher income. The effect of membership in charitable organizations is not robust and varies by gender: the coefficient is of a positive sign in the male subsample (though significant only in the base model) and negative in the female subsample (though significant only in the extended model). Membership in other organizations did not prove to be statistically significant. By contrast, membership in churches and other religious organizations (not included in the number of organizations variables in the basic model) comes together with lower income.
The cultivation of friendship relationships has a significant and positive effect on income (Table 1). Generally, more frequent contact with friends is associated with higher income (note that the reference category in the model is ‘once a month or less frequently’). However, the effect of daily contact is somewhat smaller than that of weekly contact.
The results for kinship ties is less unambiguous. The income effects of contacts with relatives differ by gender. In the male subsample, all coefficients are significant and of positive sign. In the female subsample, however, the income of respondents with contacts ‘several times a month’ and ‘never’ do not differ from those contacting their relatives monthly.
16 ZOLTÁN HERMANN–MARIANNA KOPASZ
Altogether, the results are in line with H1. Social capital indicators are positively associated with income, when controlling for individual characteristics.
Hypothesis 2 is more difficult to assess. First, the coefficients for the three social capital indicators are similar in magnitude, as opposed to H2. At the same time, the effect of contacts with relatives (a proxy for strong ties) seems to be less robust for the female subsample, which is in accordance with H2.
Table 1 Estimated coefficients for the social capital variables
men women
base model extended model base model extended model
(1) (2) (3) (4)
organizations: 1 type 0.0607*** 0.0449*** 0.0661*** 0.0384***
(0.006) (0.006) (0.007) (0.007)
organizations: 2 types 0.0506*** 0.0355*** 0.0393*** 0.0178***
(0.004) (0.004) (0.006) (0.006)
organizations: 3 or more types 0.0410*** 0.0296*** 0.0444*** 0.0269***
(0.004) (0.004) (0.004) (0.004)
friends: daily 0.0323*** 0.0233** 0.0391*** 0.0223**
(0.010) (0.009) (0.011) (0.010)
friends: weekly 0.0493*** 0.0406*** 0.0586*** 0.0454***
(0.008) (0.008) (0.009) (0.008)
friends: twice a month 0.0287*** 0.0229*** 0.0447*** 0.0307***
(0.009) (0.008) (0.010) (0.009)
friends: never -0.0702*** -0.0510*** -0.0852*** -0.0570***
(0.013) (0.013) (0.016) (0.015)
relatives: daily 0.0595*** 0.0459*** 0.0445*** 0.0285***
(0.009) (0.009) (0.011) (0.010)
relatives: weekly 0.0562*** 0.0453*** 0.0259*** 0.0139
(0.008) (0.008) (0.009) (0.009)
relatives: twice a month 0.0393*** 0.0307*** -0.00630 -0.0118
(0.009) (0.008) (0.011) (0.011)
relatives: never -0.0451*** -0.0327** -0.0163 -0.0079
(0.015) (0.014) (0.022) (0.021)
N 82130 82130 73719 73719
Adjusted R2 0.746 0.763 0.722 0.746
Robust standard errors in parentheses. *** p<0.01, ** p<0.05, * p<0.1
17 THE EFFECTS OF SOCIAL CAPITAL ON WAGE INCOME: A MULTI-COUNTRY ANALYSIS
Table 2 Estimated coefficients for membership in distinct types of organizations
men women
base model extended
model base model extended model
(1) (2) (3) (4)
Political parties and unions 0.0312*** 0.0235** 0.0538*** 0.0364***
(0.010) (0.009) (0.009) (0.009)
Professional associations 0.1120*** 0.0899*** 0.1520*** 0.1180***
(0.009) (0.009) (0.010) (0.010)
Recreational organizations 0.0391*** 0.0280*** 0.0315*** 0.0125*
(0.006) (0.006) (0.007) (0.007)
Charitable organizations 0.0284*** 0.0157 -0.0063 -0.0209**
(0.010) (0.010) (0.011) (0.011)
Other organizations 0.0101 0.0039 0.0115 0.0020
(0.009) (0.009) (0.010) (0.010)
Churches and religious organizations
-0.0178** -0.0171** -0.0286*** -0.0262***
(0.007) (0.007) (0.008) (0.008)
N 82130 82130 73719 73719
Adjusted R2 0.746 0.763 0.723 0.747
Robust standard errors in parentheses. *** p<0.01, ** p<0.05, * p<0.1
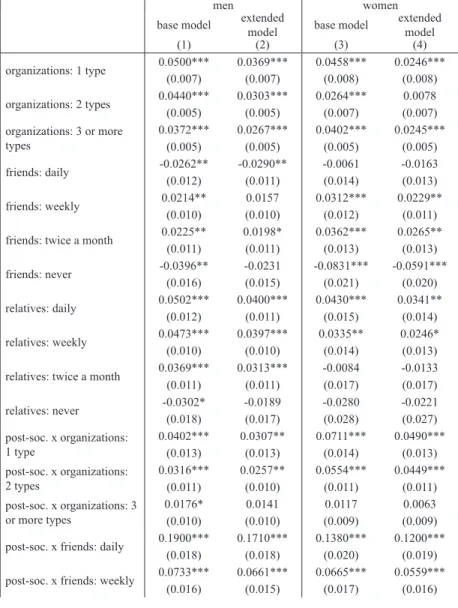
Hypothesis 3 predicts that the effect of social capital is more pronounced in the post-socialist countries than in other EU countries. We tested this hypothesis by adding interaction terms between the social capital variables and the post- socialist status of countries to the model. Estimation results are presented in Table 3. The significance of the interaction terms between the organization membership and the post-socialist country dummies indicates that membership in voluntary organizations has a greater effect on both female and male income in countries with state-socialist past than in the others. However, the organization effect exists for both groups of countries; i.e. results for the full sample are not only driven by post-socialist country status. Regarding the type of organizations, membership in professional associations and recreational organizations turns out to have a larger positive effect on income in post-socialist countries (results available from authors upon request).
The coefficients for ‘contacts with friends’ are also larger for post-socialist countries (Tale 3). Accordingly, friendship relationships tend to generate a higher income advantage in this group of countries. However, this holds true only if contacts occur on a daily or weekly basis.
Regarding kinship ties, no difference can be found in the income effects between the two groups of countries.
18 ZOLTÁN HERMANN–MARIANNA KOPASZ
In summary we can conclude that our findings support H3. Organization membership and friendship ties – the two indicators most likely to increase income – seem to have a stronger impact in post-socialist countries.
Table 3 Estimated coefficients for the social capital variables and interactions with post-socialist status
men women
base model extended
model base model extended model
(1) (2) (3) (4)
organizations: 1 type 0.0500*** 0.0369*** 0.0458*** 0.0246***
(0.007) (0.007) (0.008) (0.008)
organizations: 2 types 0.0440*** 0.0303*** 0.0264*** 0.0078
(0.005) (0.005) (0.007) (0.007)
organizations: 3 or more types
0.0372*** 0.0267*** 0.0402*** 0.0245***
(0.005) (0.005) (0.005) (0.005)
friends: daily -0.0262** -0.0290** -0.0061 -0.0163
(0.012) (0.011) (0.014) (0.013)
friends: weekly 0.0214** 0.0157 0.0312*** 0.0229**
(0.010) (0.010) (0.012) (0.011)
friends: twice a month 0.0225** 0.0198* 0.0362*** 0.0265**
(0.011) (0.011) (0.013) (0.013)
friends: never -0.0396** -0.0231 -0.0831*** -0.0591***
(0.016) (0.015) (0.021) (0.020)
relatives: daily 0.0502*** 0.0400*** 0.0430*** 0.0341**
(0.012) (0.011) (0.015) (0.014)
relatives: weekly 0.0473*** 0.0397*** 0.0335** 0.0246*
(0.010) (0.010) (0.014) (0.013)
relatives: twice a month 0.0369*** 0.0313*** -0.0084 -0.0133
(0.011) (0.011) (0.017) (0.017)
relatives: never -0.0302* -0.0189 -0.0280 -0.0221
(0.018) (0.017) (0.028) (0.027)
post-soc. x organizations:
1 type
0.0402*** 0.0307** 0.0711*** 0.0490***
(0.013) (0.013) (0.014) (0.013)
post-soc. x organizations:
2 types
0.0316*** 0.0257** 0.0554*** 0.0449***
(0.011) (0.010) (0.011) (0.011)
post-soc. x organizations: 3 or more types
0.0176* 0.0141 0.0117 0.0063
(0.010) (0.010) (0.009) (0.009)
post-soc. x friends: daily 0.1900*** 0.1710*** 0.1380*** 0.1200***
(0.018) (0.018) (0.020) (0.019)
post-soc. x friends: weekly 0.0733*** 0.0661*** 0.0665*** 0.0559***
(0.016) (0.015) (0.017) (0.016)
19 THE EFFECTS OF SOCIAL CAPITAL ON WAGE INCOME: A MULTI-COUNTRY ANALYSIS
post-soc. x friends: twice a month
0.0138 0.00607 0.0157 0.0067
(0.018) (0.017) (0.018) (0.017)
post-soc. x friends: never -0.1000*** -0.0917*** -0.0074 0.0038
(0.028) (0.027) (0.031) (0.030)
post-soc. x relatives: daily 0.0195 0.0112 0.00251 -0.0175
(0.019) (0.018) (0.021) (0.020)
post-soc. x relatives:
weekly
0.0182 0.0101 -0.0331* -0.0369**
(0.016) (0.015) (0.019) (0.017)
post-soc. x relatives: twice a month
-0.0005 -0.0069 0.0023 0.0024
(0.017) (0.017) (0.022) (0.021)
post-soc. x relatives: never -0.0332 -0.0305 0.0249 0.0324
(0.031) (0.030) (0.045) (0.042)
N 82130 82130 73719 73719
Adjusted R2 0.747 0.764 0.723 0.747
Robust standard errors in parentheses. *** p<0.01, ** p<0.05, * p<0.1
5.2 results of individual country regressions
In order to explore possible heterogeneity in the effect of social capital variables and to test whether the results for the pooled sample were driven by a few exceptional countries, we repeated the estimations for each country separately. The results are summarized in Table 4.
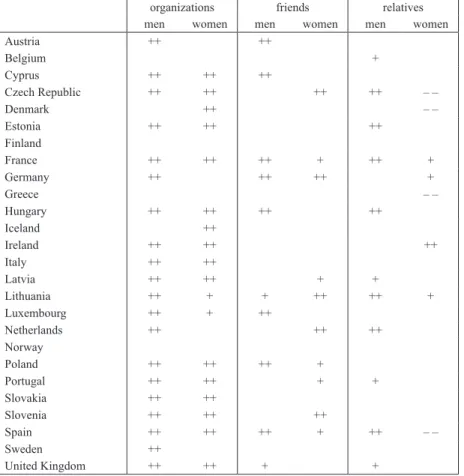
Membership in voluntary organizations has a positive and significant income effect in 22 of the 26 examined countries, though in some countries for males and in others for females only. Organization membership exerts a positive impact on male income in 20 countries, and on female income in 18 countries.
The effect of friendship relationships is positive and significant in 15 countries. The earnings effect of kinship relationships varies substantially by country and gender. Positive coefficients are found for 13 countries; however, in 4 cases the effect is negative for women. Only 3 countries, Finland, Norway, and Greece, show no sign of a positive social capital effect at all. In summary, results of individual country regressions provide strong evidence for H1.
20 ZOLTÁN HERMANN–MARIANNA KOPASZ
Table 4 Estimated coefficients for social capital variables: summary of country results
organizations friends relatives
men women men women men women
Austria ++ ++
Belgium +
Cyprus ++ ++ ++
Czech Republic ++ ++ ++ ++ – –
Denmark ++ – –
Estonia ++ ++ ++
Finland
France ++ ++ ++ + ++ +
Germany ++ ++ ++ +
Greece – –
Hungary ++ ++ ++ ++
Iceland ++
Ireland ++ ++ ++
Italy ++ ++
Latvia ++ ++ + +
Lithuania ++ + + ++ ++ +
Luxembourg ++ + ++
Netherlands ++ ++ ++
Norway
Poland ++ ++ ++ +
Portugal ++ ++ + +
Slovakia ++ ++
Slovenia ++ ++ ++
Spain ++ ++ ++ + ++ – –
Sweden ++
United Kingdom ++ ++ + +
++ / – – : robust positive / negative effect, + / – : less robust positive / negative effect
It is an eye-catching finding that in Scandinavian countries social capital either has no effect at all (Finland, Norway) or only organizational membership has an impact for either the male or the female subsample (Sweden, Iceland, Denmark). A possible explanation is that the labor markets of these countries lay great emphasis on educational qualifications and meritocratic recruitment, thereby leaving little scope for benefits from social connections to appear. An alternative explanation might be found in the high levels of social capital on average in these countries (see Figure 1, 2, and 3). The high average levels may
21 THE EFFECTS OF SOCIAL CAPITAL ON WAGE INCOME: A MULTI-COUNTRY ANALYSIS
suggest that our indicators are less suitable for measuring the most important part of the true variation of social capital in these countries. Note that the results for Greece and Cyprus are also in line with this latter argument.
In order to assess Hypothesis 2, we can compare the number of countries with significant effects for the three indicators. The income effect of weak ties, measured by the number of organization memberships, proved to be significant in the case of 22 countries; and in 16 for both males and females.
The frequency of contacts with friends, a variable somewhat closer to being a proxy for weak ties than for strong ties, has significant and positive income effects in 15 countries. The effect of friendship relationships is significant in both the male and female subsamples for 5 countries.
Strong ties, measured by the intensity of contacts with relatives, have a positive and significant influence on income in fewer countries than weak ties do. Positive income effects for both females and males were found in only two countries (France and Lithuania); the effect is rather ambiguous for females. Hence, the results provide some support for the ‘strength of weak ties’ hypothesis (H2).
Regarding Hypothesis 3, country regressions confirm the results obtained for the pooled sample. The coefficients for organization memberships are significant for both genders in all the post-socialist countries. By contrast, of the 18 remaining countries there are only 7 to which the same applies.
Further, with the exception of Estonia and Slovakia, friendship ties have a significant income effect in at least one gender in all post-socialist countries.
Of the 18 remaining countries, it is in only 9 that the coefficients for ‘contacts with friends’ proved to be significant in at least one gender subsample.
5.3 problems in the estimation of returns to social capital
So far we have shown that social capital is associated with higher income.
However, whether this association can be interpreted as a casual effect is far from evident.
The first problem is that the causality between social capital and income could run both ways. It may be that people with higher incomes tend to have a higher propensity to live more active lives, and to join voluntary groups or organizations. Further, individuals with higher social positions and higher incomes are more likely to become members of certain types of organizations such as professional organizations. If participation in a voluntary organization requires a significant monetary contribution, those who already have high incomes are more liable to join the organization. Beyond budgetary constraints,
22 ZOLTÁN HERMANN–MARIANNA KOPASZ
another problem is the time needed to join an organization. If participation in an organization is rather time consuming, then it is mainly those who spend less time working who would remain members. If membership in voluntary organizations is endogenous in this way, then estimates of organizational memberships can be biased upwards.
A second concern is that the effect of social capital may be due to unobserved heterogeneity. Individuals may have certain unobserved characteristics (e.g.
outstanding social or communication skills) that lead both to more social connections and to higher income. Since we cannot exclude the possibility of the problem of unobserved heterogeneity, the coefficients for social capital variables may be biased upwards.
A third problem arises if social capital is the result of individual investment (in social relations), and if the investment decision is driven by costs and expected returns, analogously to human capital theory (Lin, 1999). If this is the case, those individuals who invest in social capital will expect higher returns and the coefficients for social capital variables should be biased upwards.
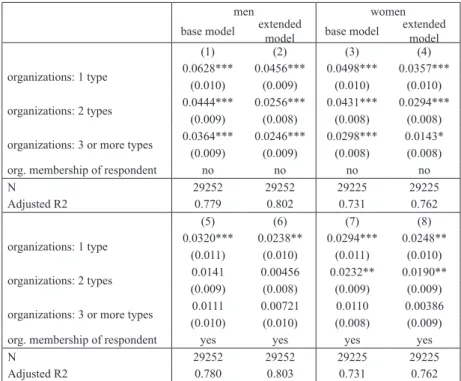
Note that these latter problems are probably more severe for friendship ties, while the first is related to membership in organizations. In neither case can we address the endogeneity problem directly. However, regarding membership in organizations we can rely on some indirect evidence. Since the SILC data contains members from the same household for many countries, we can estimate the effect of the spouse’s (or cohabitating partner’s) organizational membership instead of or alongside the respondent’s own organizational affiliation. It can be argued that the organizational membership of the partner is much less affected by the respondent’s income than his or her own organizational affiliation. At the same time, an individual can be assumed to have – at least partial – access to and utilize his or her spouse’s social connections. Thus the problem of endogeneity may be mitigated (though the spouse’s social capital is not perfectly exogenous either)8. Re-estimating our base model for the pooled sample and substituting the partner’s organizational affiliation for the respondent’s, or adding it to the model while retaining the respondent’s organizational membership variables as well provides further support to our results. When the respondent’s own organizational affiliations
8 Note that this strategy does not work in the case of friendship ties. First, there is greater overlap between a person’s circle of friends and his/her partner’s circle of friends (than between the person’s organizational ties and his/her organizational ties). Second, social skills that might bias the estimated effect of friendship ties can also be assumed to go together within couples to some extent.
23 THE EFFECTS OF SOCIAL CAPITAL ON WAGE INCOME: A MULTI-COUNTRY ANALYSIS
are omitted (Table 5, top panel), the coefficients for the partner’s social capital are very similar to the coefficients for the respondent’s own social capital (for the latter, see Table 1). If the partner’s social capital is additionally included in the model, the effect is somewhat weaker and less precisely estimated, but is always positive and statistically significant for one type of organization and for two types for the female subsample (Table 5, bottom panel). These findings lend additional support to the statement that membership in organizations tends to increase income. However, caution is still required when assessing the observed association between social capital and income, especially regarding friendship ties. A possible reverse causation effect and/
or bias due to endogeneity cast some doubt on the casual interpretation of the estimated association between social capital and wage income.
Table 5 Estimated coefficients for the organizational membership of the partner
men women
base model extended
model base model extended model
(1) (2) (3) (4)
organizations: 1 type 0.0628*** 0.0456*** 0.0498*** 0.0357***
(0.010) (0.009) (0.010) (0.010)
organizations: 2 types 0.0444*** 0.0256*** 0.0431*** 0.0294***
(0.009) (0.008) (0.008) (0.008)
organizations: 3 or more types 0.0364*** 0.0246*** 0.0298*** 0.0143*
(0.009) (0.009) (0.008) (0.008)
org. membership of respondent no no no no
N 29252 29252 29225 29225
Adjusted R2 0.779 0.802 0.731 0.762
(5) (6) (7) (8)
organizations: 1 type 0.0320*** 0.0238** 0.0294*** 0.0248**
(0.011) (0.010) (0.011) (0.010)
organizations: 2 types 0.0141 0.00456 0.0232** 0.0190**
(0.009) (0.008) (0.009) (0.009)
organizations: 3 or more types 0.0111 0.00721 0.0110 0.00386
(0.010) (0.010) (0.008) (0.009)
org. membership of respondent yes yes yes yes
N 29252 29252 29225 29225
Adjusted R2 0.780 0.803 0.731 0.762
Robust standard errors in parentheses. *** p<0.01, ** p<0.05, * p<0.1