THE LONG RUN EFFECTS OF SELF-CONFIDENCE ON THE LABOR MARKET.
A TEST ON HUNGARIAN DATA
1TAMÁS KELLER2
ABSTRACT It is easy to see that highly fatalistic, low-efficacy persons believe that their actions have little outcome. Because a higher level of fatalism lowers an employee’s desired effort level, it may result in lower wages, while the anti- fatalistic attitude translates into more effective work – which in turn may be rewarded with a higher salary. The examined self-confidence scale is very similar to the most widely-used Rotter locus of control scale. People with a high level of self confidence are determined, feel that they have an influence on their future and are optimistic. In this article I examine not only the impact of this variable on wages, but also the human capital impact of self-confidence.
KEYWORDS personality; self-confidence; earnings; human capital; labor market
There is considerable consensus among scholars of inequalities in wages that the main determinant of the earning distribution is human capital (Mincer 1974). However, using human capital variables such as education, cognitive performance and job-specific training and skills, a surprisingly large portion of the variance in earnings remains unexplained (Kertesi – Köllő 1997).
Recently, a new paradigm has emerged in the social sciences where personal characteristics are thought to account for differences in economic success (Bowles et al. 2001a, Bowles et al. 2001b). However, there is other evidence for the importance of non-cognitive skills on the labor market. Looking through the wording used for job advertisements makes obvious the need for
1 I would like to thank for the useful comments to Tamás Bartus, Gábor Kézdi, Álmos Telegdy and István György Tóth. All remaining errors are my own. The research was supported by the grant of Gyula Rézler Foundation.
2 Tamás Keller is a research fellow at TÁRKI Social Research Institute and a Ph.D. candidate at the Doctoral School of Sociology of Corvinus University, Budapest; e-mail: keller@tarki.hu
these skills (strongly motivated, good team-player, good sense of humor, etc.).
Furthermore, surveys among human resource managers highlight the fact that while recruiting labor the importance of the applicant’s non-cognitive skills exceeds the weight of cognitive ones (Zemsky – Iannozzi 1995; Cox 1989). In this paper, I examine the wage impact of non-cognitive personal traits using multivariable statistical models.
PREVIOUS RESEARCH
There is considerable research outlining the correlation between economic success and non-cognitive characteristics which are important to the labor market. Beauty (Hamermesh – Biddle 1993), height (Case et al. 2008) and domestic cleanliness (Duncan – Dunifon 1998) all seem to have a positive impact on wages, while organizational skill and motivation seem to have an impact on social stratification (Titma – Trapido 2002). Because self-control related personal characteristics may predict the ability to work productively, they are in the centre of interest in social and economic research.
According to Bowles (Bowles et al. 2001a) we can suppose that the labor service an employee supplies to a firm is the product of two terms: the number of hours and the level of effort. An employer can prescribe the number of working hours in a contract, but the level of effort cannot be contracted. Employers only can assume that higher wages may induce more effort. Personal characteristics which lead an employee to work harder, keeping everything else constant, may have an impact on wages. It is easy to see that highly fatalistic, low-efficiency people believe that their actions determine outcomes only a little. Because greater fatalism lowers an employee’s desired effort level, it may result in lower wages, while an anti-fatalistic attitude translates into more effective work that in turn may be rewarded with a higher salary.
One of the most widely-used personality variable scales in sociological and economic research is the Rotter locus of control scale3 (Rotter 1966) which
3 The abbreviated, four-item version contains the following questions: (1) What happens to me is my own doing (internal response) / Sometimes I feel that I don’t have enough control over the direction my life is taking (external response). (2) When I make plans, I am almost certain that I can make them work (internal response) / It is not always wise to plan too far ahead, because many things turn out to be a matter or good or bad fortune anyhow (external response). (3) In my case, getting what I want has little or nothing to do with luck (internal response) / Many times we might just as well decide what to do by flipping a coin (external response). (4) It is impossible for me to believe that chance or luck plays an important role in my life (internal response) / Many times I feel that I have little influence over the things that happen to me (external response).
measures the degree of control individuals have over their life. People with external control believe that hard work and effort are not rewarded, while individuals with internal control consider that future success is mostly shaped by their own efforts. Another frequently used measure of personal traits is the self-esteem scale4 developed by Rosenberg (1965) to assess perceptions of self-worth. The scale is measured using 10 questions (each have four response choices) ranging from low to high self-worth statements. In previous research self-control related traits were usually measured with either the Rotter or Rosenberg scale or an equivalent of these scales (Dunifon – Duncan 1998).
Heckman et al. (2006), however, used a vector containing both the Rotter and the Rosenberg items. Almost every piece of research which has analyzed the wage impact of these traits has worked with data sets from the United States (National Longitudinal Survey [NLS] or Panel Survey of Income Dynamics [PSID]), but there is also a piece of research which uses cross-sectional Russian data (Semykina – Linz 2005).5
Since self-control related personal traits like internal/external control, self- confidence or self-worth are probably shaped by successes or failures on the labor market, researchers investigating the earning-impacts of these qualities try to obtain the exogenity of personality on wages. In previous research two econometric techniques had been used to avoid endogenity. The simplest and easiest way is when the wage in time t is explained using a personality variable measured t-1 (Andrisani – Nestel 1976; Andrisani 1977; Dunifon – Duncan 1998) or regressing wages on early childhood-personality versus personality prior to any work experience (Murnane et al. 2001; Osborne 2005a; Heckman et al. 2006). In this later case the personality variable is par excellence exogenous to wage.6 Another econometric technique is to create an instrument that is independent of wages yet highly correlated with adult personality. The great difficulty of this technique is to find appropriate instrumental variables (Goldsmith et al. 1997; Goldsmith et al. 2000). A quite similar technique (used by Osborne – Groves 2005a) is to regress adult personality on exogenous variables and wages from the previous year to remove the influence of past
4 (1) On the whole, I am satisfied with myself; (2*) At times, I think I am no good at all; (3) I feel that I have a number of good qualities, (4) I am able to do things as well as most other people;
(5*) I feel I do not have much to be proud of; (6*) I certainly feel useless at times; (7) I feel that I’m a person of worth, at least on an equal plane with others; (8*) I wish I could have more respect for myself; (9*) All in all, I am inclined to feel that I am a failure; (10) I take a positive attitude toward myself. Items with an asterisk are reverse scored.
5 Because they do not deal with the problem of endogenity the estimated parameters are probably overestimated, but from the data provided by the authors no comparison can be made.
6 A similar technique was used for human capital investment (Coleman – DeLeire 2003).
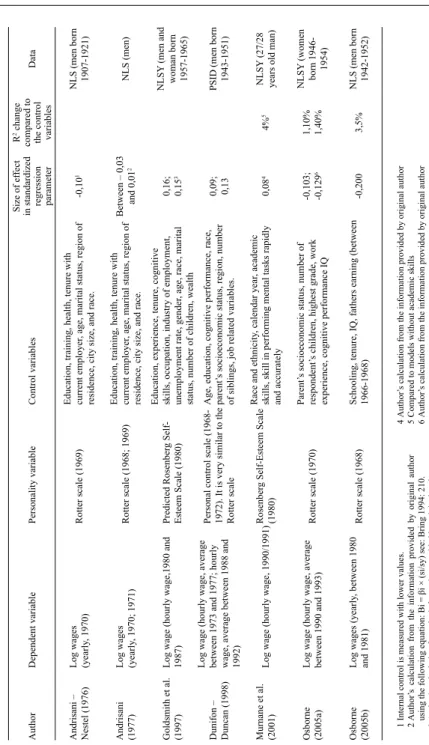
wages on adult personality, and to substitute the exogenous adult personality (the unstandardized residual) in the original OLS equation. As Keller (2010) pointed out, differences in the estimated parameters using the various kinds of econometric techniques are not larger than the 95% confidence interval of the estimated parameters. In Table 1, I have summarized the main findings of previous studies using Rotter or Rosenberg scales. According to the results, the wage impacts of these personal characteristics are low or moderate, but they still have a significant impact on earning, controlling a wide range of variables.
A different research strategy is employed using the Big Five personality variable developed by Costa and McCrae (1995). Including the Big Five personality traits (Extraversion, Agreeableness, Conscientiousness, Emotional stability, and Openness) in a wage equation, the endogenity problem is less serious since these traits are relatively stable during the course of a life (Costa – McCrae 1997). It is quite hard to find the exact relationship between the locus of control related traits (such self-confidence, self worth) and the Big Five personality typology. Conscientiousness versus lack of direction might have a theoretical connection with self-control, since conscientiousness means (in the Big Five model) efficiency, self-discipline and achievement motivation, but – according to my knowledge – there have been no empirical tests to measure the correlation between the Rotter-scale and the Big Five personality traits.
The findings of previous research are not uniform regarding the impact of the Big Five traits on wages. Every piece of research has pointed out the significant positive wage-impact of emotional stability, and many of them emphasize very significant gender differences which might be a consequence of personality differences between men and women. But the impacts of other personality traits on wages vary according to sample and data. Using longitudinal survey data of U.S. high school graduates (Wisconsin Longitudinal Study) Mueller and Plug (2004) pointed out that while men are rewarded for being antagonistic (the inverse of agreeableness) and open, to a lesser extent;
woman enjoy earnings advantages for being more conscientious and open.
Using the same data set and examining both genders Letcher and Niehoff (2004) found that agreeableness is negatively, while conscientiousness and openness are positively, correlated with wages. Analyzing the data of the Dutch DNB Household Survey Nyhus and Pons (2005) found that, among women, agreeableness was associated with a lower wage while man received a premium for autonomy (as tenure increases) and for conscientiousness (at the beginning of the employment relationship). While analyzing the Dutch Family Survey, Gelissen and de Graaf (2006) established only for men that
extraversion is positively, openness is negatively connected with wages using a large set of control variables. Working with the British Household Panel Study, Heineck (2007) found for both genders that agreeableness was penalized while openness to experience was rewarded with higher wages on the labor market.
Besides investigating the wage impact of self-control related traits or the Big Five personality model, other research used personality traits measured with the Guilford and Zimmerman (1976) Temperament Survey (Filer 1981), while Turner and Martinez (1977) analyzed the wage impact of the machiavellian personality. Osborne–Groves (2005a) investigated the wage impact of aggression and withdrawal using the British National Child Development Study.
DATA, MEASUREMENT AND METHODS
In my paper I will use data from the Hungarian Household Panel Study (HHP), which is a longitudinal panel survey carried out by the TÁRKI Social Research Institute, the Budapest University of Economics, the Central Statistical Office, the National Scientific Research Fund (OTKA) and several other Hungarian institutions between 1992 and 1997. During the project, a nationwide sample of 2,600 households was surveyed on a yearly basis.
HHP has a focus on changes in the dynamics of the labor market, income inequalities, the life prospects of the various strata of the population and the changing attitudes of Hungarian population after the political and economic transition of the early 1990s. TÁRKI completed a follow-up research on the Hungarian Household Panel in 2007 supported by the NKTH Jedlik program under the name of the ‘Household Lifecourse Survey Project’ (HLSP). This study is designed to monitor the labor market, income, wealth and opinion changes of the original (1992 HHP research) sample following 15 years since the base survey (and 10 years since the last wave), and succeeded in completing interviews with almost 2,700 individuals. In my research I used a merged data set from HHP and the follow-up research. This means that my dataset covers the period from 1992 to 2007, but from 1998 till 2006 there are no data because data collection was suspended. In HHP the age-limit for the sample was 16 years, so between 1992 and 1997 one can only analyze the data of those persons who are older than this age limit (note; this means that in the matched working file, every person is older than 30 in 2007).
Analyzing wages requires investigating people on the labor market using available earning data. All respondents who were employees, self-employed,
Table 1 Multivariate OLS results: Correlation between self-control related personal traits and earning AuthorDependent variablePersonality variableControl variables Size of effect in standardized regression parameter R2 change compared to the control variables
Data Andrisani – Nestel (1976)Log wages (yearly, 1970)Rotter scale (1969)Education, training, health, tenure with current employer, age, marital status, region of residence, city size, and race.-0,101NLS (men born 1907-1921) Andrisani (1977)Log wages (yearly, 1970; 1971)Rotter scale (1968; 1969)Education, training, health, tenure with current employer, age, marital status, region of residence, city size, and race.
Between – 0,03 and 0,012NLS (men) Goldsmith et al. (1997)Log wage (hourly wage,1980 and 1987)Predicted Rosenberg Self- Esteem Scale (1980)
Education, experience, tenure, cognitive skills, occupation, industry of employment, unemployment rate, gender, age, race, marital status, number of children, wealth 0,16; 0,153
NLSY (men and woman born 1957-1965) Dunifon – Duncan (1998)
Log wage (hourly wage, average between 1973 and 1977; hourly wage, average between 1988 and 1992) Personal control scale (1968- 1972). It is very similar to the Rotter scale Age, education, cognitive performance, race, parent’s socioeconomic status, region, number of siblings, job related variables.
0,09; 0,13PSID (men born 1943-1951) Murnane et al. (2001)Log wage (hourly wage, 1990/1991)Rosenberg Self-Esteem Scale (1980)
Race and ethnicity, calendar year, academic skills, skill in performing mental tasks rapidly and accurately0,0844%5NLSY (27/28 years old man) Osborne (2005a)Log wage (hourly wage, average between 1990 and 1993)Rotter scale (1970)Parent’s socioeconomic status, number of respondent’s children, highest grade, work experience, cognitive performance IQ -0,103; -0,12961,10% 1,40%
NLSY (women born 1946- 1954) Osborne (2005b)Log wages (yearly, between 1980 and 1981)Rotter scale (1968)Schooling, tenure, IQ, fathers earning (between 1966-1968)-0,2003,5%NLS (men born 1942-1952) 1 Internal control is measured with lower values. 2 Author’s calculation from the information provided by original author using the following equation: Bi = βi × (si/sy) see: Bring 1994: 210. 3 Author’s calculation from the information provided by original author
4 Author’s calculation from the information provided by original author 5 Compared to models without academic skills 6 Author’s calculation from the information provided by original author
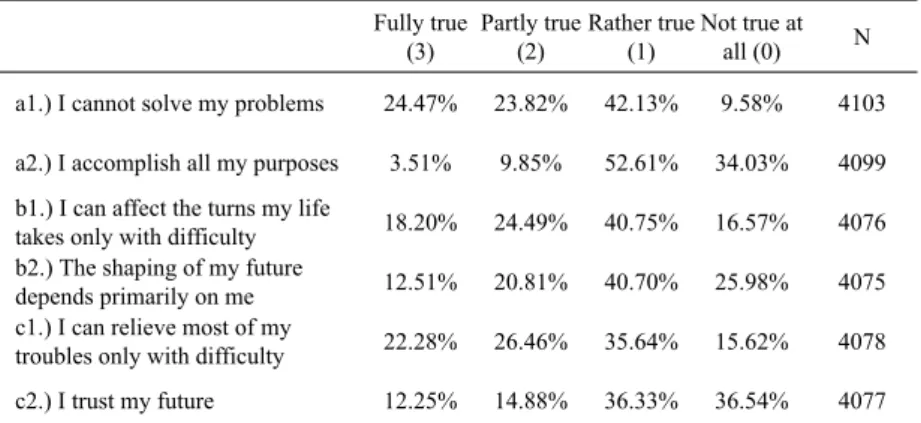
or were employed beside pension, maternity leave or compulsory military service were regarded as active. The sample selection bias was treated with the Heckman (1979) two step procedure.7 Because the Rotter scale is not available for this survey, I created an index8 – which is theoretically and empirically – very similar to the Rotter scale. I named the index self- confidence scale since the questions used to construct the index concerned respondent problem-solving skills, determination, efficacy and optimism. In order to examine the highest period every questions used to construct the self- confidence scale were asked in 1993.
I could test the correlation between the self-confidence scale and the Rotter locus of control scale using the data for 1000 respondents from a national representative sample from Hungary in the spring of 2009. The Pearson- correlation coefficient is -0,38, which is different from zero at a significance level of 0.01. The negative sign of the coefficient indicates that I expect a positive connection between wage and the examined index (the correlation between the original Rotter scale and wage was negative).
Table 2 Items used to construct the self-confidence scale Fully true
(3)
Partly true (2)
Rather true (1)
Not true at
all (0) N
a1.) I cannot solve my problems 24.47% 23.82% 42.13% 9.58% 4103 a2.) I accomplish all my purposes 3.51% 9.85% 52.61% 34.03% 4099 b1.) I can affect the turns my life
takes only with difficulty 18.20% 24.49% 40.75% 16.57% 4076 b2.) The shaping of my future
depends primarily on me 12.51% 20.81% 40.70% 25.98% 4075
c1.) I can relieve most of my
troubles only with difficulty 22.28% 26.46% 35.64% 15.62% 4078
c2.) I trust my future 12.25% 14.88% 36.33% 36.54% 4077
7 Heckman’s lambda is estimated from the logit equation where selection criterion was explained with age, gender, region, education, self-confidence scale, a dummy variable on whether the respondent is unemployed, and another dummy variable showing whether the respondent is retired, and the interaction of these dummies with the self-confidence scale.
8 The index was created from six items (Table 2). The six questions contain three oppositions, between the opposition pairs the correlation is at least -0.3. The following points were matched to answer-categories: fully true: 3; partly true: 2; rather true: 1; not true at all: 0. I used the following equation to calculate the index: self-confidence scale = (a2-a1)+(b2-b1)+(c2-c1) .
SELF-CONFIDENCE AND WAGES
When using personality variables in any wage equation a very serious problem should be solved: personal traits should be endogenous to wages.
Personality may be shaped by success or failure on the labor market. The crucial criterion is to use panel data where we have many observations about one individual. Besides that, there is the possibility to employ various kinds of estimation techniques which aim at controlling the previous labor market effect in the personality variable. There are many different techniques, but as Keller (2010) pointed out, the difference in the slopes of personality variable (calculated with different estimation techniques) are beyond acceptable statistical deviation. So I used the simplest and easiest way: where the wage in time t is explained with personality variable measured t-1:
log10Wi,t1 + ..+ tn = α + β1×Zi,tn + β2×Ci,tn + β3×Hi,tn + β4×Pi,93 + εi,tn, (1) where W contains all received benefits from the first job during the examined income period (from t1 to tn). I took into consideration the sum of yearly income(s), paid overtime(s) and contribution(s) to food, car, travel and rent. Z is a vector of demographic variables (gender, age, age square, region, marital status), C is a vector containing some correction variables (Heckman sample selection bias and a dummy variable showing whether the personality variable was imputed9), H is a vector of human capital variables (education and a dummy variable for working part-time), and vector P is the self confidence scale. P is measured in 1993, and the other variables are measured at the end of the examined income period (tn), so t1 ≥ 1993. I investigated six models:
from 1993 to 1997 there were five models, and one for the year 2007.
The results – presented in Table A1 – show that personal characteristics such as self-confidence have a positive significant impact on wages using multivariable statistical models. This means that people who are determined and are able to control their futures earn, ceteris paribus, more. The t-statistics show that the estimated parameters of the self-confidence scale are different from zero at the level of 1% in case of five out of the six models, and we obtained a parameter statistically different from zero at 10% with our last model (in the income period 1993-200710).
9 The missing value from the self-confidence scale (1993) was imputed from later surveys (1996 and 1997), but the imputed index were only used in the last model, which examines the income period 1993-2007.
10 Compared to the previous models the numbers of observations included in this model were restricted, due to the long earning period.
The size of the effect of the self-confidence scale can be read out from the unstandardized regression parameters (ß). In log-level models (where the dependent variable is in logarithmic form and the independent variables are not legitimized) ß means the percentage change in the dependent variable when one of the independent variables changes one unit, holding any other differences constant.11 In Figure 1 the unstandardized regression parameters are expressed using a 95% confidence interval. Since the confidence intervals meet we cannot identify a significant decline in the size of parameter. The decline in slope parameter was examined more deeply using pooled OLS, but no significant differences between the estimated parameters occurred.
Comparing my results with those of the previous research (in standardized regression coefficient: see Table 1) my results are approximately in the same interval, but the lack of inclusion of cognitive skills and abilities (these data were not available in HHP nor in HLSP) in my models should be remembered.
Figure 1 The size of effect of one unit change in the self-confidence scale on wages
1.12% 1.09%
0.90% 0.87%
0.66%
0.47%
-0.2%
0.0%
0.2%
0.4%
0.6%
0.8%
1.0%
1.2%
1.4%
1.6%
1.8%
(1993)
(1993- 1994)
(1993- 1995)
(1993- 1996)
(1993- 1997)
(1993- 2007)
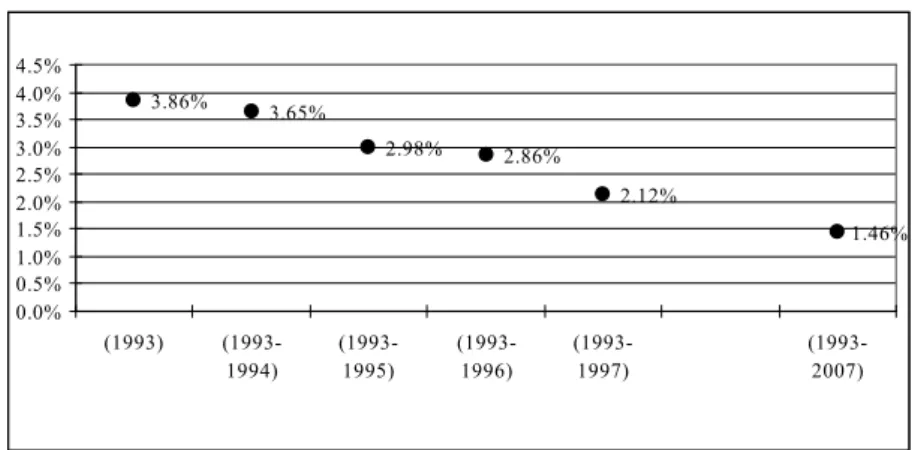
In the case of the self-confidence scale it is fairly difficult to interpret what the one unit of change means, because one cannot be sure whether it is a large or a small change. However, I regarded one standard deviation change in the self-confidence scale to be large enough. In Figure 2 instead of ß coefficients I represented ßx which is ßx×σx where σx is the standard deviation belonging the
11 %Δy=(100×ß)×Δx
self-confidence scale. One standard deviation in the examined index means a 3% to 1,5% change in earnings – holding other differences constant. The size of effect seems to be small but we should not forget that a very broad number of control variables were included in the estimations; and I regarded only the direct effect, and worked with net-wages.
Figure 2 The size of effect of one standard deviation change in the self-confidence scale on wages
3.86% 3.65%
2.98% 2.86%
2.12%
1.46%
0.0%
0.5%
1.0%
1.5%
2.0%
2.5%
3.0%
3.5%
4.0%
4.5%
(1993) (1993- 1994)
(1993- 1995)
(1993- 1996)
(1993- 1997)
(1993- 2007)
Note: ßx = ßx×σx where ßx is the unstandardized regression parameter of the self-control scale and σx the standard deviation of self-control scale
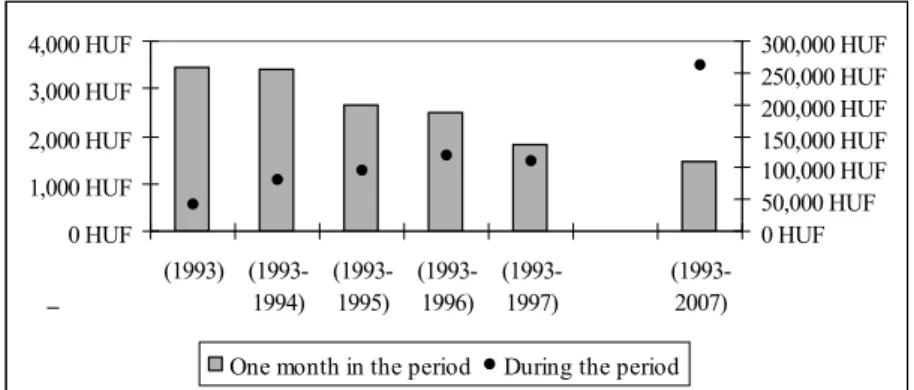
In Figure 3, I expressed the size of the effect of one standard deviation change in the self-confidence scale in the case of the average net-salary.12 I inflated all prices to a 2008 level.13 On the left hand scale the impact of self- confidence is depicted on a one-month basis during the examined income period, while on the right hand scale the aggregated monthly impact is shown in the whole length of period. According to the results, in the case of an average net salary (99,903 HUF14), the monthly impact of self confidence is between 1500-3500 HUF. Between 1993 and 2007 the aggregated wage impact of self-confidence equals with nearly 250,000 HUF15. The results are
12 Source: http://portal.ksh.hu/pls/ksh/docs/hun/xstadat/xstadat_eves/tabl2_01_41i.html (downloaded: May 26, 2009).
13 Source of CPI: http://portal.ksh.hu/pls/ksh/docs/hun/xstadat/xstadat_eves/tabl3_06_01i.html (downloaded: May 26, 2009).
14 The average net salary between 1993 and 2007 on the price level 2008.
15 99,903 HUF × 1.46% × 180 (the number of months in the examined income period).
in absolute terms low, but I believe the importance of the findings lies not in the magnitude but in the existence of the impact. We also have to consider that the results are computed for net salary.
Figure 3 The size of effect on an average net salary in 2008 prices (calculating with one standard deviation change in the self-confidence scale)
0 HUF 1,000 HUF 2,000 HUF 3,000 HUF 4,000 HUF
(1993) (1993- 1994)
(1993- 1995)
(1993- 1996)
(1993- 1997)
(1993- 2007)
0 HUF 50,000 HUF 100,000 HUF 150,000 HUF 200,000 HUF 250,000 HUF 300,000 HUF
One month in the period During the period Note: ß × average net earning according to Hungarian Central Statistical Office
SELF-CONFIDENCE AND HUMAN CAPITAL
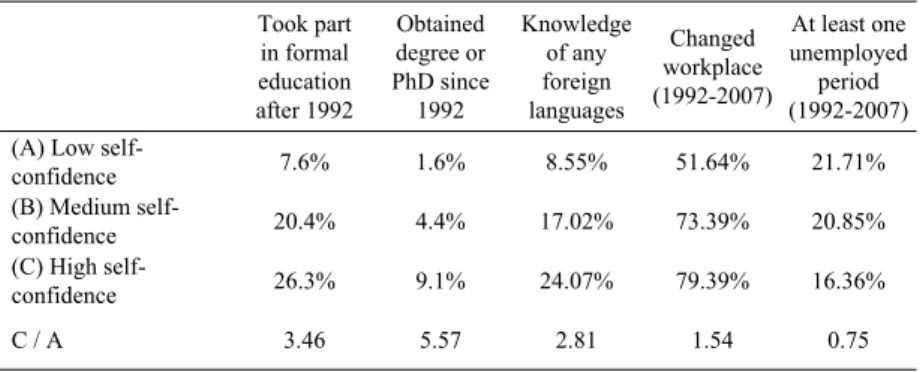
In this chapter I will examine the connection between the self-confidence scale and human capital investment. The point of my research is to analyze the human capital investment of people with different self-confidence levels. I created three categories from the self-confidence scale: people with high self-confidence (the upper 20%), people with medium self confidence and people with low self- confidence (the bottom 20%). My results are shown in Table 3.
In the first column of Table 3, the ratio of people who took part in formal education after 1992 is shown, broken down into the three categories of the self-confidence scale. People with high self confidence are 3.5 times more likely to learn after 1992 than people with low self-confidence. However, the ratio between the two groups is 5.5 if we concentrate only on degrees or PhDs obtained. Regarding the foreign language knowledge of the three groups we also can observe significant differences. People with high self-confidence are 3 times more likely to speak at least one language at conversational level. We can conclude that self-confidence is a good explanatory of learning propensity.
There are significant differences in human capital between the three groups and it is not surprising that people with high self-confidence performed much
better on the labor market (they were 3 times more mobile on the labor market and were less liable to be unemployed) than people without this skill.
Table 3 Self-confidence and human capital investment Took part
in formal education after 1992
Obtained degree or PhD since
1992
Knowledge of any foreign languages
Changed workplace (1992-2007)
At least one unemployed
period (1992-2007) (A) Low self-
confidence 7.6% 1.6% 8.55% 51.64% 21.71%
(B) Medium self-
confidence 20.4% 4.4% 17.02% 73.39% 20.85%
(C) High self-
confidence 26.3% 9.1% 24.07% 79.39% 16.36%
C / A 3.46 5.57 2.81 1.54 0.75
The differences in the three categories are of course not only the impact of self-confidence because I did not control for other differences between people. Using logistic regression I controlled for a set of other variables and I have summarized the changes in odds ratio in Table 416. For the easier understanding I calculated in percentages the impact of a one unit change in explanatory variable (the second row in the table). Except for obtaining a degree we can see the significant impact of self-confidence in every case.
The largest effect of self-confidence can be observed in taking part in formal education and in workplace-mobility.
Table 4 Self-confidence and some indicators of human capital investment, regression results
Took part in formal education after 1992
Obtained degree or PhD since
1992
Knowledge of any foreign
languages
Changed workplace (1992-2007)
At lest one unemployed period (1992-
2007)
Exp (b) 1.126*** 1.092 1.082*** 1.106*** 0.918***
100 × [Exp (b) – 1] 12.6%*** 9.2% 8.2%*** 10.6%*** -9.2%***
Note: the coefficients are significantly different from zero at least: *** 0.01; ** 0.05; * 0.1 level.
All models are significantly different from zero at 0.001 level.
The full regression results are shown in Table A2.
16 My dependent variables had two categories.” Besides self-confidence I controlled for demographic variables and family background. Regression results are shown in Table A2.
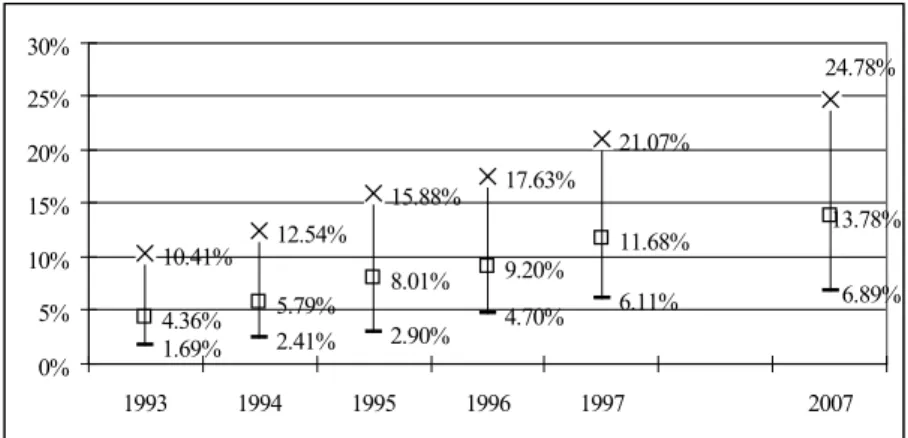
One channel for leaving the labor market is early-age retirement.17 In Figure 4 I have indicated the ratio of people who retired before the age of 55. One can see that among those with low self confidence the ratio of early-age retired persons is not only larger but also increases more steeply than among people with high self-confidence. In one of my previous works (Keller 2008: 142) I demonstrated with a large set of control variables that early-age retirement is more frequent among people with low self-confidence.
Figure 4 Share of persons retired before the age of 55 according to self-confidence
10.41% 12.54%
15.88% 17.63%
21.07%
4.36% 5.79% 8.01% 9.20%
11.68% 13.78%
1.69% 2.41% 2.90% 4.70% 6.11% 6.89%
24.78%
0%
5%
10%
15%
20%
25%
30%
1993 1994 1995 1996 1997 2007
Low self-confidence Medium self-confidence High self-confidence
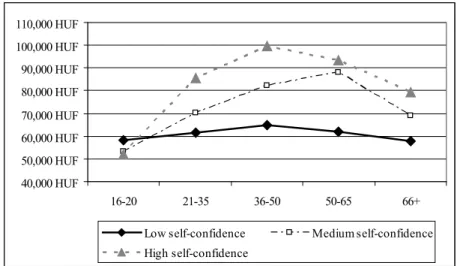
From the previous findings it is unambiguous that self-confidence has not only an effect on human capital investment but also influences the number of working-years. Working at a workplace increases work experience which is a special form of human capital (Mincer 1962). So it is not surprising that between people with different levels of self-confidence the slope of the age- earning profile is different, and the steepest profile belongs to those with high self-confidence.
17 Those persons who were younger than 55 when they retired, since between 1992 and 1997 the age limit for retirement was 55 years for the women and 60 years for the men.
Figure 5 Age-earning profile of people with varying levels of self-confidence
40,000 HUF 50,000 HUF 60,000 HUF 70,000 HUF 80,000 HUF 90,000 HUF 100,000 HUF 110,000 HUF
16-20 21-35 36-50 50-65 66+
Low self-confidence Medium self-confidence High self-confidence
Note: The 1993 monthly net income is converted to 2008 prices
THE INDIRECT EFFECT OF SELF-CONFIDENCE ON WAGES
Because human capital and self-confidence are correlated, besides the direct effect of self-confidence on wages we should consider indirect effects mediated by human capital. According to Alwin and Hauser (1975: 39) the total effect between two variables is a zero-order correlation coefficient.
The decline in this coefficient when introducing a new control variable to the equation can be understood as the indirect effect mediated by the new explanatory variable. Figure 6 represents the ratio of indirect effect (in the percentage of total effect) mediated by schooling.18 As we can see, the ratio shows a growing tendency which indicates the growing importance of human capital in the transmission of the indirect effects of self-confidence on wages.
Foreign language knowledge also mediates a considerable amount of indirect effect (5-15%) but controlling for schooling loses its significance.
18 Schooling was measured with four dummy coded variables: at least elementary school, vocational school, secondary school, degree. Reference category: at least elementary school.
Figure 6 Share of indirect effect (in the percentage of total effect) mediated by schooling
36.5% 36.4%
41.2%
40.0%
44.5%
45.7%
30%
32%
34%
36%
38%
40%
42%
44%
46%
48%
1993 1994 1995 1996 1997 2007
CONCLUSION
In my paper I made evident the impact of personal characteristics on wages using multivariate statistical models and working with a Hungarian panel of data. In line with previous researches I found low but statistically significant correlation between self-confidence and wage including a wide set of control variables. The direction of the correlation is in line with that hypothesized, and shows – in line with previous research – that those people who are more determined and who are able to control their futures earn, ceteris paribus, more. However, I took some further steps forward in the research, since I took into consideration the indirect effects of self-confidence on wages, mediated by human capital. The real importance of my findings is that I have estimated the labor market importance of a non-materialistic, non-cognitive skill.
REFERENCES
Alwin, Duane F.–Robert M. Hauser (1975), “The Decomposition of Effects in Path Analysis”, American Sociological Review Vol. 40, No. 1, pp. 37-47.
Andrisani, Paul J. – Gilbert Nestel (1976), “Internal-External Control as Contributor to and Outcome of Work Experience”, Journal of Applied Psychology Vol. 61, No.
2, pp. 156-165.
Andrisani, Paul J. (1977), “Internal-External Attitudes, Personal Initiative, and the Labor Market Experience of Black and White Men”, Journal of Human Resources Vol. 12, No. 2, pp. 308-338.
Bowles, Samuel – Herbert Gintis – Melissa Osborne (2001a), “The Determinants of Earnings:
A Behavioral Approach”, Journal of Economic Literature Vol. 39, No. 4, pp. 1137-1176.
Bowles, Samuel – Herbert Gintis – Melissa Osborne (2001b), “Incentive-Enhancing Preferences: Personality, Behavior, and Earning”, The American Economic Review Vol. 91, No. 2, pp. 155-158.
Bring, Johan (1994), “How to Standardize Regression Coefficients”, The American Statistician Vol. 48, No. 3, pp. 209-213.
Case, Anne – Christina Paxon – Mahnaz Islam (2008), “Making Sense of the Labor Market Height Premium: Evidence from the British Household Panel Survey”, NBER Working Paper No. 14007
Coleman, Margo – Thomas DeLeire (2003), “An Economic Model of Locus of Control and the Human Capital Investment Decision”, Human Resources Vol. 37, pp. 701-721.
Costa, Paul T. – Robert R. McCrae (1995), “Domains and facets: Hierarchical personality assessment using the Revised NEO Personality Inventory”, Journal of Personality Assessment Vol. 64, No. 1, pp. 21-50.
Cox, Joe A. (1989), “A Look Behind Corporate Doors”, Personnel Administrator Vol.
34, No. 3, pp. 56-59.
Dunifon, Rachel – Greg J. Duncan (1998), “Long-Run Effects of Motivation on Labor- Market Success”, Social Psychology Quarterly Vol. 61, No. 1, pp. 33-48.
Duncan, Greg J. – Morgan, James N. (1981), “Sense of Efficacy and Subsequent Change in Earnings – A Replication”, The Journal of Human Resources Vol. 16, No. 4, pp. 649-657.
Duncan, Greg J. – Rachel Dunifon (1998), “Soft-skills and Long-Run Market Success”
Research in Labor Economics Vol. 17, pp. 123–149.
Elek Péter – Péter András Szabó (2008), A fiktív minimálbéresek vizsgálata a bértarifa felvétel segítségével [Examination of individuals reported on fictive minimum wage by means of the wage tariff survay], Paper submitted to the Labor-economic Conference in Szirák [Sziráki Munkatudományi konferencia], www.econ.core.hu/
file/download/szirak2008/fiktivminber_szirak.pdf
Filer, Randall Keith (1981), “The influence of affective human capital on the wage equation” in: Polachek, Solomon W. ed., Research in Labor Economics, JAI Press Inc. Vol. 4, pp. 367–416.
Gelissen, John – Paul M. de Graaf (2006), “Personality, Social Background, and Occupational Career Success”, Social Science Research Vol. 35, No. 3, pp. 702-726.
Goldsmith, Arthur H. – Jonathan R. Veum – William Darity (1997), “The Impact of Psychological and Human Capital on Wages”, Economic Inquiry Vol. 35, No. 4, pp. 815-829.
Goldsmith, Arthur H. – Jonathan R. Veum – William Darity (1997), “Working Hard for the Money? Efficiency Wages and Worker Effort”, Journal of Economic Psychology Vol. 21, No. 4, pp. 351-385.
Guilford, Joan S. – Wayne S. Zimmerman – J. P. Guilford (1976), The Guilford – Zimmerman Temperament Survey Handbook. Twenty-five Years of Research and Application, San Diego, CA: EDITS
Hamermesh, Daniel, S. – E. Biddle Jeff (1993), “Beauty on the Labor Market”, NBER Working Paper No. 4518.
Heckman, James J. (1979), “Sample Selection Bias as a Specification Error”, Econometrica, Vol. 47, No. 1, pp. 153-161.
Heckman, James J. – Jora Stixrud – Sergio Urzua (2006), The Effects of Cognitive and Noncognitive Abilities of Labor Market Outcomes and Social Behavior, NBER Working Paper 12006, http://ideas.repec.org/p/nbr/nberwo/12006.html
Heineck, Guido (2007), Does it pay to be nice? Personality and earnings in the UK. LASER Discussion Papers, Paper No. 3 www.laser.uni-erlangen.de/papers/paper/6.pdf Keller, Tamás (2008), “Optimizmus és depresszió: objektív helyzet és szubjektív
állapot [Optimism and depression – objective situation and subjective well- being]”, in: Kolosi, Tamás – István György Tóth eds., Újratervezés – Életutak és alkalmazkodás a rendszerváltás évtizedeiben [Redesign – life roads and adaption in the decades of regime change], Tárki, Budapest, pp. 135-145.
Keller, Tamás (2010), “Az önbizalom kereseti hatása [Self-confidence and Earning Inequalities]”, Közgazdasági Szemle Vol. 57, No. 3, pp. 241-260.
Kertesi, Gábor – János Köllő (1997), “Reálbérek és kereseti egyenlőtlenségek [Real earnings and income inequalities]”, Közgazdasági Szemle Vol. 44, No. June- August, pp. 612-634.
Letcher, Lloyd – Brian Niehoff (2004), Psychological Capital and Wages: A Behavioral Economic Approach. Paper submitted to be considered for presentation at the Midwest Academy of Management in May 2004 in Minneapolis, MN http://cobacourses.creighton.edu/MAM/2004/papers/Letcher,Niehoff.doc Mincer, Jacob (1974), School, Experience and Earning, New York, NBER
Mincer, Jacob (1962), “On-the-Job Training: Costs, Returns, and Some Implications”, The Journal of Political Economy Vol. 70, No. 2, pp. 50-79.
Mueller, Gerrit – Erik Plug (2004), Estimating the Effect of Personality on Male- Female Earnings, IZA Discussion Paper, No. 1254 http://www.tinbergen.nl/
discussionpapers/04087.pdf
Murnane, Richard J. – John B. Willett – Jay M. Braatz – Yves Duhaldeborde (2001), “Do Different Dimension of Male High School Students’ Skills Predict Labor Market Success a Decade Later? Evidence from the NLSY”, Economic of Education Review Vol. 20, pp. 311-320.
Nyhus, Ellen K. – Empar Pons (2005), “The Effects of Personality on Earnings”, Journal of Economic Psychology Vol. 26, pp. 363–384.
Osborne Groves, Melissa (2005a), “How Important is your Personality? Labor Market Returns to Personality for Woman in the US and UK”, Journal of Economic Psychology Vol. 26, pp. 827-840.
Osborne Groves, Melissa (2005b), “Personality and the Intergenerational Transmission of Economic Status”, in: Bowles, Samuel – Herbert Gintis – Melissa Osborne Groves eds., Unequal Chances, New York, Princeton University Press and Russell Sage Foundation, pp. 208-231.
Rosenberg, Morris (1965), Society and the Adolescent Self-Image, Princeton, Princeton University Press
Rotter, Julian (1966), “Generalized expectancies for internal versus external control of reinforcements”, Psychological Monographs Vol. 80, No. 1, pp. 1-28.
Semykina, Anastasia – Susan Linz (2005), “Gender Differences in Personality and Earnings: Evidence from Russia”, William Davidson Institute Working Paper, Number 791, April 2005, http://deepblue.lib.umich.edu/bitstream/2027.42/40177/3/
wp791.pdf
Titma, Mikk – Denis Trapido (2002), “Prediction of Success in Post-Communist Societies: Evidence from Latvia and Estonia”, Society and Economy Vol. 24, No.
3, pp. 297-331.
Turner, Charles F. – Martinez, Daniel C. (1977), “Socioeconomic Achievement and the Machiavellian Personality”, Sociometry Vol. 40, No. 4, pp. 325-336.
Wooldridge, Jeffrey M. (2003), Introductory Econometrics - a Modern Approach (edition 2), South-Western
Zemsky, Robert – Maria Ianozzi (1995), A Reality Check: Findings from the EQW National Employer Survey, Washington, Office of Educational Research and Improvement
Table A1 Regression results on wages (1993)(1993-1994)(1993-1995)(1993-1996)(1993-1997)(1993-2007) Constant4.47()***5.34()***5.62()***5.72()***5.93()***5.99()*** Male0.11(0.15)***0.11(0.22)***0.12(0.26)***0.11(0.25)***0.11(0.29)***0.14(0.39)*** Age0.06(1.79)***0.03(1.35)***0.03(1.15)***0.03(1.16)***0.02(0.97)***0.02(0.89)* Age square0(-1.68)***0(-1.22)***0(-1.02)***0(-1.03)***0(-0.84)***0(-0.77) Unmarried/single0.01(0.01)-0.02(-0.02)-0.03(-0.05)**0(0)0(0)0.01(0.02) Divorced-0.03(-0.02)0(0)0.01(0.01)0.01(0.01)-0.01(-0.01)0.02(0.04) Widow0.06(0.03)0.06(0.04)**0.06(0.05)**0.04(0.03)0.02(0.02)0.07(0.09)* Town-0.02(-0.02)0.01(0.01)0(0)0.01(0.02)-0.01(-0.02)-0.01(-0.03) Country seat0.01(0.01)-0.01(-0.01)0(0)0(0)0(-0.01)0.03(0.06) Budapest0.1(0.1)***0.09(0.14)***0.09(0.16)***0.09(0.19)***0.1(0.22)***0.11(0.25)*** Heckman’s lambda-0.33(-0.22)***-0.19(-0.15)***-0.09(-0.07)***-0.06(-0.06)**-0.11(-0.11)***0.06(0.06) Working part-time-0.3(-0.12)***-0.26(-0.15)***-0.25(-0.15)***-0.17(-0.11)***-0.12(-0.08)***-0.1(-0.15)*** Vocational school0.08(0.1)***0.06(0.1)***0.07(0.14)***0.09(0.21)***0.08(0.18)***0.04(0.12)* Secondary school0.15(0.19)***0.13(0.24)***0.14(0.28)***0.15(0.32)***0.13(0.31)***0.1(0.28)*** Degree0.29(0.28)***0.28(0.43)***0.29(0.5)***0.28(0.52)***0.25(0.51)***0.23(0.5)*** Self-confidence0.01(0.1)***0.01(0.15)***0.01(0.13)***0.01(0.13)***0.01(0.11)***0(0.08)* Self-confidence imputed-0.03 R20.340.420.450.430.450.54 Weighted N1934151412961113966239 3.86%3.65%2.98%2.86%2.12%1.46% Zero order correlation (self-confidence and wage)0.21***0.24***0.23***0.26***0.25***0.26*** Dependent variable: the sum of yearly income(s), paid overtime(s) and contribution(s) to meal, car, travel and rent during the indicated income period. The table contains unstandardized regression coefficient [ß] and in parenthesis: standardized regression coefficients [B]. Coefficients with *** are different from zero at the significance-level of 0.01, coefficients with ** are different from zero at the significance-level of 0.05, coefficients with * are different from zero at the significance-level of 0.1. All models are significant at 0.001 level. Omitted categories: female, village, married, at least elementary school.
Table A2 Regression results on Human capital variables Took part in formal education after 1992Obtained degree or PhD since 1992 The knowledge of any foreign languages
Changed workplace (1992-2007)
At lest one unemployed period (1992-2007) Male0,415***0,7280,8471,679***1,474** Age0,834***0,930,863***1,409***1,168*** Age (square)1,0010,9991,002***0,995***0,997*** Town1,0241,6980,515***1,2971,391 Country seat1,551,8960,492**2,211**2,001** Budapest0,9320,6281,21,701*0,738 Education1,131**1,319***1,272***1,186***0,936 Father’s education1,0531,126*1,092***1,0510,915** Mother’s education1,154***1,244***1,069*1,0461,057 Self-confidence1,126***1,0921,082***1,106***0,918*** Constant1,5270,001***0,076***0,003***0,144** -2 Log likelihood539,321255,993818,476737,436824,789 Cox & Snell R Square0,3080,1710,1750,4750,140 Weighted N11391141113811411142 Coefficients with *** are different from zero at the significance-level of 0.01, coefficients with ** are different from zero at the significance-level of 0.05, coefficients with * are different from zero at the significance-level of 0.1. All models are significant at 0.001 level. Omitted categories: female, village, married Education is measured with the number of years belonging to the highest level of completed education