Marine and Petroleum Geology 127 (2021) 104955
Available online 5 February 2021
0264-8172/© 2021 The Author(s). Published by Elsevier Ltd. This is an open access article under the CC BY license (http://creativecommons.org/licenses/by/4.0/).
Research paper
Source rock potential, crude oil characteristics and oil-to-source rock correlation in a Central Paratethys sub-basin, the Hungarian Palaeogene Basin (Pannonian basin)
S ´ andor K ¨ orm ¨ os
a,b,*, Reinhard F. Sachsenhofer
b, Achim Bechtel
b, Bal ´ azs G ´ eza Radovics
c, Katalin Milota
c, F ´ elix Schubert
aaUniversity of Szeged, Department of Mineralogy, Geochemistry and Petrology, Egyetem u. 2, H-6722, Szeged, Hungary
bMontanuniversit¨at Leoben, Chair in Petroleum Geology, Peter-Tunner-str. 5, A-8700, Leoben, Austria
cMOL Plc., Okt´ober huszonharmadika u. 18, H-1117, Budapest, Hungary
A R T I C L E I N F O Keywords:
Central Paratethys Hungarian Palaeogene Basin Crude oil
Source rocks
Oil-to-source rock correlation Compound-specific isotope
A B S T R A C T
Eocene and Lower Oligocene rocks are potential source rocks for crude oil accumulations in the Hungarian Palaeogene Basin. To enhance the understanding of the hydrocarbon system, this study (i) assesses the petroleum potential of Palaeogene formations, (ii) characterises the source rock facies of the accumulated oils, and (iii) provides an oil-to-source correlation. Rock-Eval data of samples from three boreholes (W–1, W–9 and W–12) show that most Palaeogene formations are mature at depths exceeding 2.1–2.5 km. The coal-bearing Kosd Formation includes good to excellent gas- (and oil-) prone source rocks. The overlying Buda Marl Formation is typically organic matter-lean but contains oil-prone rocks with up to 2.3 wt% TOC and a fair petroleum potential in borehole W–9. The Tard Clay Formation in W–12 reaches up to 1.9 wt% TOC and shows HI values up to 440 mg HC/g TOC, characterising the deposits as good petroleum source rocks. Based on low TOC contents, the Kiscell Clay Formation is not considered a source rock. Molecular parameters of 12 crude oil samples indicate a shaly source rock deposited in a marine/brackish environment. Salinity stratification, causing the development of oxygen-depleted conditions, is likely. The organic matter is dominated by aquatic biomass, including algae, dinoflagellates and chemoautotrophic bacteria. Minor angiosperm-dominated organic matter was transported into the basin from the shoreline. Specific V-shaped compound-specific carbon isotope patterns of n-alkanes observed in crude oils and extracts from the Tard Clay prove the dominant source rock. Minor differences be- tween biomarker ratios are related to vertical and lateral facies variations within the Tard Clay Formation. The accumulated oils are slightly more mature than the Tard Clay in borehole W–12.
1. Introduction
During the Palaeogene, the closure of the Mesozoic Tethyan basin and subsequent basin isolation caused the birth of the Paratethys Sea (Schulz et al., 2005). The process resulted in water masses with varying salinity and redox conditions favouring the accumulation of organic matter-rich rocks (Popov et al., 2001, 2004; R¨ogl, 1999; Sachsenhofer et al., 2018a, 2018b). The Paratethys basin system has been subdivided into three parts because of diachronous geotectonic events: (i) the Western Paratethys, formed by the Rhˆone Basin and Alpine Foreland Basin, west of Munich, (ii) the Central Paratethys, composed by the remaining Alpine Foreland Basin, Carpathian Basin and Hungarian
Palaeogene Basin and (iii) the larger Eastern Paratethys (Popov et al., 2004).
The Neogene Pannonian Basin formed part of the Central Paratethys and is underlain by Eocene and Oligocene sediments of the Hungarian Palaeogene Basin (Fig. 1; Tari et al., 1993). Fine-grained, organic matter-rich sediments within the Eocene and Oligocene succession were recognized as potential source rocks (e.g. Badics and Veto, 2012; ˝ Bechtel et al., 2012; Brukner-Wein et al., 1990; K¨orm¨os et al., 2020; Milota et al., 1995). Whereas it is widely accepted that the Lower Oligocene Tard Clay Formation provides the most important source rocks (Fig. 2; Bechtel et al., 2012; Brukner-Wein et al., 1990; Hertelendi and Vet˝o, 1991;
Milota et al., 1995), the Middle Eocene Kosd Formation (K¨orm¨os et al.,
* Corresponding author. University of Szeged, Department of Mineralogy, Geochemistry and Petrology, Egyetem u. 2, H-6722, Szeged, Hungary.
E-mail address: sandor.kormos@geo.u-szeged.hu (S. K¨ormos). ¨
Contents lists available at ScienceDirect
Marine and Petroleum Geology
journal homepage: www.elsevier.com/locate/marpetgeo
https://doi.org/10.1016/j.marpetgeo.2021.104955
Received 31 October 2020; Received in revised form 21 January 2021; Accepted 31 January 2021
2020), Late Eocene Buda Marl Formation (Sachsenhofer et al., 2018a, 2018b) and Late Oligocene Kiscell Clay Formation (Milota et al., 1995) were also considered as potential source rocks (Fig. 2). Nevertheless, comprehensive organic geochemical studies have only been performed on sediments of the Tard Clay and Kosd formations (Bechtel et al., 2012;
K¨ormos et al., 2020), whereas in-depth investigations are still missing ¨ for the Buda Marl and Kiscell Clay formations. Furthermore, detailed analysis of crude oils and thorough oil-to-source rock correlation are also absent.
This study focuses on the central-southern part of the Hungarian Palaeogene Basin. The study aims are to advance the understanding of the petroleum system by (i) characterising the maturity and source rock potential of the Upper Eocene (Kosd and Buda Marl formations) and Lower Oligocene (Tard Clay and Kiscell Clay formations) succession, (ii) determining the source rock facies of crude oils produced in several oil fields in the Hungarian Palaeogene Basin, and (iii) correlating these crude oils to a specific source rock formation.
Maturity and source rock potential of the Palaeogene succession are
assessed using numerous Rock-Eval data from deep boreholes W–1, W–9 and W–12 (for location see Fig. 1b). Biomarker data of 12 crude oil samples are applied to reconstruct the depositional environment of their source rocks. Oil-to-source rock correlation is based on biomarker and compound-specific isotope data from oil samples, which are compared with new source rock data and source rock data published by Bechtel et al. (2012) and K¨orm¨os et al. (2020), who discussed the origin of the source organic matter, established on biomarker parameters, in the Tard Clay and Kosd formations, respectively.
2. Geological setting
The study area is located in the southern part of the central Hun- garian Palaeogene Basin (Fig. 1), which overlies a basement constructed of the Mid-Hungarian Zone (Kov´acs and Haas, 2010). The Hungarian Palaeogene Basin is interpreted as a retro-arc flexural foreland basin, where the depositional facies migrated towards the ENE according to the present position (Fig. 2; Tari et al., 1993; Kov´aˇc et al., 2016). The
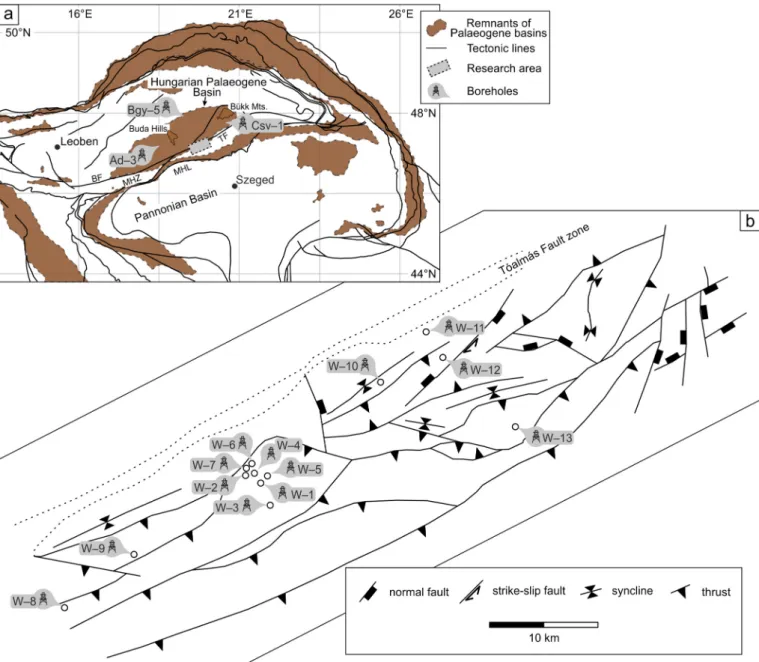
Fig. 1. Regional setting of a) the Hungarian Palaeogene Basin and b) the study area (modified after Kov´aˇc et al., 2016; Ozsv´art et al., 2016; Palotai, 2013; Schmid et al., 2008). BF – Balaton Fault, MHZ – Mid-Hungarian Zone, MHL – Mid-Hungarian Line, TF – Toalm´ ´as Fault, Ad–3 – Alcsútdoboz–3, Bgy–5 – Balassagyarmat–5, Csv–1 – Cser´epv´aralja–1, W–1 to W–13 are studied boreholes.
tectonic evolution has been related to normal faulting and strike-slip regimes (Palotai, 2013 and references therein). The term Palaeogene Basin comprises all sedimentary sequences, forming a single cycle from the Eocene to the Early Ottnangian (Fig. 2; Sztan´o and Tari, 1993).
The Alpine Orogeny resulted in the exhumation of the Mesozoic strata during the Late Cretaceous. Subaerial exposure caused continental denudation until the Late Eocene (Haas and Kov´acs, 2012). The Palae- ogene sediments unconformably overlie the Mesozoic basement. The sedimentary succession starts with a terrigenous basal conglomerate, breccia and variegated clay (Bauer et al., 2016; Bauer and M.Toth, ´ 2017). The Kosd Formation reflects a continuous upward transition to a lagoonal environment (Gidai, 1978; Less, 2005), showing the first sign of the Priabonian transgression (B´aldi and B´aldi-Beke, 1985). The upper part of the Kosd Formation is coal-bearing and includes pelitic sediments with varying carbonate content (Gidai, 1978; Less, 2005; K¨orm¨os et al., 2020). The Kosd Formation is overlain by the shelf deposits of the Sz´epv¨olgy Limestone Formation (K´azm´er, 1985). Continued subsidence caused the deposition of the Buda Marl Formation across the Eocene-Oligocene transition, which contains marl and calcareous marl, allodapic limestones and calcareous turbidites deposited in low-oxic environments (Less, 2005; Nagymarosy and B´aldi-Beke, 1988; Ozsv´art et al., 2016).
The Buda Marl Formation is overlain by the Tard Clay Formation.
This formation accumulated in a euxinic basin, which was filled from the west (according to the present position; Fodor et al., 1994) by a pro- grading siliciclastic delta. Hence, the Tard Clay Formation is missing in the west of the Buda Hills. The Tard Clay Formation includes laminated
and non-laminated shale and sandstone (Brukner-Wein et al., 1990). The degree of lamination varies considerably within the formation but is often the highest in its middle part, representing the nannozone NP23 (Nagymarosy, 1983), where dark grey siltstone alternates with white coccolith layers. These intervals are characterised by high TOC contents (max. 5 wt% TOC; Brukner-Wein et al., 1990) and represent oxygen-depleted conditions (B´aldi, 1984; Bechtel et al., 2012). The overlying Kiscell Clay Formation is accumulated in a deep bathyal, well-oxygenated depositional environment (Baldi and B´ ´aldi-Beke, 1985), comprising intercalated siltstones and turbiditic sandstone bodies (Less, 2005; Milota et al., 1995).
The Palaeogene succession is terminated by interfingering heteropic sediments, including, from west (Buda Hills) to east (Bükk Mts.) the shallow sublittoral T¨or¨okb´alint Sandstone Formation, the deep sub- littoral–shallow bathyal Sz´ecs´eny Schlier Formation and the deep sub- littoral Eger Formation (Kercsm´ar et al., 2015). The littoral–sublittoral Budafok Formation covers the T¨orokb¨ ´alint Sandstone, which is laterally intercalating with the upper part of the Sz´ecs´eny Schlier Formation (Sztan´o and Tari, 1993). The latter grades eastwards into the shallow marine P´eterv´as´ara Sandstone Formation, composed of several coast parallel facies units (Sztano and Tari, 1993). Gradual uplift in late ´ Eggenburgian time resulted in subaerial exposure and the deposition of the Zagyvap´atfalva Formation in a coastal plain setting. The Gyulakeszi Rhyolite Tuff covers the eroded surface of the Palaeogene to Eggen- burgian formations (Nagymarosy, 2013). The sedimentary sequence of the Hungarian Palaeogene Basin is covered by thick Neogene sediments.
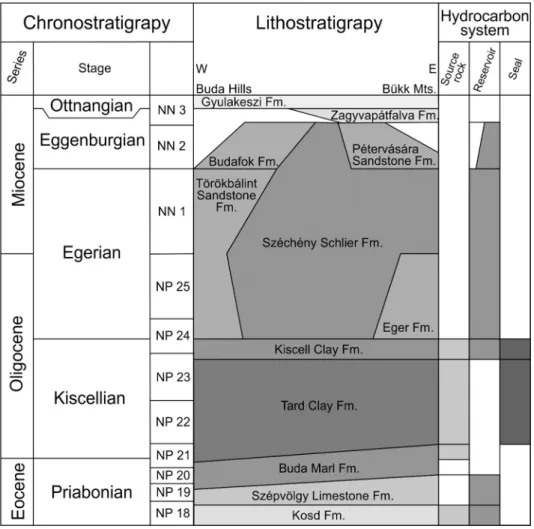
Fig. 2. Simplified lithostratigraphy of the sedimentary succession in the Hungarian Palaeogene Basin and elements of the hydrocarbon system in the study area (after Kercsm´ar et al., 2015; Less, 2015 oral communication; Tari et al., 1993). The nannoplankton zonation is based on Less (2005), Ozsv´art et al. (2016) and Tari et al. (1993).
2.1. Source potential of the Palaeogene sediments
Whereas the Tard Clay Formation is the most widely accepted po- tential source rock in the Hungarian Palaeogene Basin, organic matter rich intervals in the Buda Marl and Kiscell Clay formations were also considered (Badics and Veto, 2012; Sachsenhofer et al., 2018a, 2018b). ˝ Recently, K¨orm¨os et al. (2020) investigated the hydrocarbon potential of the coal-bearing Kosd Formation.
The Eocene Kosd Formation includes an up to 36-m-thick coal ho- rizon. The coaly layers accumulated in a marine delta and are inter- calating with siltstone containing miliolid foraminifers. The high volatile bituminous coal and coaly shale are characterised by HI values between 200 and 300 mg HC/g TOC in the deep well W–1. The coal measure is gas- and oil-prone and have reached the rank threshold for the first gas generation (Korm¨ ¨os et al., 2020).
The TOC contents of the Buda Marl Formation are generally below 1 wt% (max. 2.3 wt%), and HI values (<150 mg HC/g TOC) fall within the range of type III and type IV kerogen (Bechtel et al., 2012; Sachsenhofer et al., 2018a, 2018b).
The non-to weakly-laminated lower section of the Tard Clay For- mation contains TOC contents up to 5 wt% (Brukner-Wein et al., 1990) but with low HI values (<185 mg HC/g TOC; Bechtel et al., 2012).
Higher HI values (up to 440 mg HC/g TOC) occur in the strongly-laminated middle part of the formation, deposited in a brackish environment during the Solenovian Event (Bechtel et al., 2012; Bru- kner-Wein et al., 1990; Hertelendi and Vet˝o, 1991). The upper part of the Tard Clay is characterised by gradually declining TOC and HI values (down to 0.5 wt% TOC and 75 mg HC/g TOC, respectively) with rising salinity in the water column (Bechtel et al., 2012).
The Kiscell Clay is characterised by low TOC and HI values (<1 wt%
and <200 mg HC/g TOC, respectively; Milota et al., 1995) but published data are scarce.
2.2. Hydrocarbon reservoirs and traps in the study area
Hydrocarbons were detected in the fractured and weathered Meso- zoic basement rocks in the research area. The basal conglomerate and breccia and the sandstone sequence of the Kosd Formation also form reservoirs and host substantial amounts of hydrocarbons. The karstified Sz´epv¨olgy Limestone and turbidite sandstone bodies within the Kiscell Clay Formation and the clastic sediments of the Miocene formations also serve as targets of exploration activities (Bauer and M.T´oth, 2017;
Dolton, 2006). Various structural, stratigraphic and combination trap types were discovered within the study area. Compactional anticlines occur over basement highs. Fault-closed features, associated roll-overs and closures in flower structures are also common (Kokai, 1994;
Dolton, 2006).
3. Samples and analytical methods 3.1. Samples
This study is based on rock and oil samples from boreholes W–1 to W–13, drilled by MOL Plc. during the last decades (for location see Fig. 1b). Twenty-four drill core samples, representing the Kosd Forma- tion and Tard Clay Formation were sampled from wells W–1 and W–12.
Drill cores are complemented by 196 cuttings, washed and wet samples, containing Palaeogene sediments from boreholes W–1, W–9, and W–12 provided by MOL Plc. The wells were drilled using water-based mud and were selected because of the systematically performed lag-time checks for accurate depth readings for taking drill cuttings. Intervals containing lost circulation materials and mud additives (e.g. nutshells, lignite) were avoided whenever it was possible, otherwise handpicking of solid con- taminants and cavings was achieved before analysis. Moreover, sections with observed crude oil indications on the shale shakers were not considered for sampling. The organic geochemical data of core samples
from the Kosd Formation were described recently by K¨orm¨os et al.
(2020).
Crude oil samples were obtained from Triassic, Eocene and Oligo- cene reservoirs from W–1 to W–3, W–8 and W–10 to W–13 wells. MOL Plc provided additional results for oil from boreholes W–4 to W–7. The reservoirs are characterised by hydrostatic pressure (Boncz, 2004, 2013;
Kiss, 1999). Table 1 lists the age and lithology of the reservoir rocks and depth of the oil-water contact.
The study is also supplemented by results acquired during investi- gating the Tard Clay Formation by Bechtel et al. (2012) at Alcsútdoboz–3, Cser´epv´aralja–1 and Balassagyarmat–5 (Ad–3, Csv–1 and Bgy–5, respectively; for location see Fig. 1a).
3.2. Organic geochemical analyses
The total organic carbon (TOC) contents and Rock-Eval parameters of cutting and core samples were determined in the laboratories of MOL and Montanuniversit¨at Leoben, respectively. An ELTRA Helios CS-580A analyser was used to obtain the TOC contents on duplicates of powdered core samples, pre-treated by H3PO4, by combustion. The TOC contents of cutting samples were determined by Rock-Eval pyrolysis on dupli- cates of pulverized samples. The TOC contents achieved by pyrolysis of bulk rocks (Rock-Eval 6) and by combustion of samples, pre-treated by acid (ELTRA), agree very well (cf. Behar et al., 2001). Rock-Eval 6 in- struments (Lafargue et al., 1998) were employed to quantify the free and generated hydrocarbons (S1 and S2 peaks, respectively) in both labo- ratories. The temperature at the maximum hydrocarbon generation (Tmax [◦C]) was detected and applied as a maturity indicator. Derived Rock-Eval parameters include the hydrogen index (HI =S2 ×100/TOC [mg HC/g TOC]), the production index (PI = S1/(S1 + S2) [—];
Espitali´e et al., 1977) and the petroleum potential (PP =S1 +S2 [mg HC/g rock]).
Aliquots of powdered rock samples, 10 g each, were extracted using dichloromethane solvent at 75 ◦C and 110 bar over 1 h utilizing a Dionex ASE 350 accelerated solvent extractor. The elemental sulphur content of the solution was removed by adding copper. The extracts were concentrated to 1 ml solution by a Zymark TurboVap 500 closed cell concentrator. The crude oil samples, 50 mg each, and the concentrated extracts were diluted by a mixture of hexane–dichloromethane (80:1) Table 1
Age, lithology and depth of the oil-water contact for reservoirs of studied oil samples (after Boncz, 2004, 2013 and Kiss, 1999).
Well
name Age Lithology Oil-water
contact [m; MD]
W–1 Eocene Sandstone, polymict
conglomerate 2469
W–2 Eocene and
Triassic Sandstone, polymict
conglomerate and limestone 2513
W–3 Eocene Sandstone, polymict
conglomerate 2490
W–4 Eocene and
Triassic Sandstone, polymict
conglomerate and limestone 2453
W–5 Eocene Sandstone, polymict
conglomerate 2495
W–6 Eocene Sandstone, polymict
conglomerate 2510
W–7 Eocene Sandstone, polymict
conglomerate 2449
W–8 Eocene Limestone breccia 1722
W–10 Eocene and
Triassic Fractured- and karstified
limestone 1780
W–11 Jurassic Limestone 2491
W–12 Oligocene and
Eocene Fractured siltstone and biogenic
limestone 2316
W–13 Triassic Fractured limestone 2249
MD – measured depth.
solution and insoluble asphaltenes were precipitated, and separated by centrifugation. Hexane diluted and dissolved the maltenes, which were injected into a Margot K¨ohnen-Willsch medium-pressure liquid chro- matography instrument to separate the NSO (containing nitrogen, sulphur and oxygen), saturated and aromatic compounds (Radke et al., 1980b). The saturated and aromatic compounds were concentrated and internal standards were added (deuterated n-tetracosane and 1, 1′-binaphthyl, respectively). The normal and branched–cyclic alkanes were further separated for compound-specific isotope analyses using an improved 5 Å molecular sieve method (Grice et al., 2008). The isotope fractionation of compounds seems unlikely based on the low-temperature-controlled chemical reactions during sample preparation.
The saturated hydrocarbon fractions were analysed using a Thermo Scientific TraceGC gas chromatograph attached to a flame ionisation detector, installed with an HP-PONA fused silica capillary column (50 m, i.d. 0.2 mm; 0.5 μm film thickness). The samples were injected in split mode at 270 ◦C. The oven temperature was programmed to an initial 5 min period at 32 ◦C, followed by 2.5 ◦C/min heating rate to 310 ◦C and hold for 30 min. Helium was used as the carrier gas. The flame ionisation detector was operated at 320 ◦C with 350 and 35 ml/min flow rates of air and hydrogen, respectively. Data were processed using an Xcalibur data system. Individual compounds were identified based on retention time. The concentration of n-alkanes and acyclic isoprenoids, as well as the corresponding concentration ratios, are based on peak area inte- gration compared to the internal standard.
A gas chromatograph coupled to a ThermoFisher ISQ mass spec- trometer equipped with a DB-5MS fused silica capillary column (60 m, i.
d. 0.25 mm; 0.25 μm film thickness) was used to analyse the saturated and aromatic hydrocarbon fractions. The oven temperature was pro- grammed to an initial 70 ◦C and raised to 300 ◦C at 4 ◦C/min rate, fol- lowed by an isothermal period of 15 min. The carrier gas was helium.
The samples were injected through an injector at 275 ◦C in splitless mode. Electron ionisation of the molecular species was achieved over a scan range of 50–600 m/z with a total scan time of 500 msec during the analyses. Data were processed using an Xcalibur data system. Individual compounds were identified in the total ion current (TIC) chromatogram based on retention time and fragment ions of m/z 191, 217, 218, 231, and 259 were chosen for recognition of hopanoids and steranes (Ensminger et al., 1978; Summons et al., 1987; Wingert and Pomerantz, 1986), as well as the mass spectra were compared with published data.
The 4-methylsteranes were distinguished on the diagnostic ion, m/z 231 mass chromatograms, and 24–n–propylcholestanes were determined according to the registered mass spectra (Moldowan et al., 1990). Ab- solute concentrations and relative percentages of different compound groups were estimated using peak areas of internal standards in the TIC chromatograms, or by integrating peak areas in convenient mass chro- matograms employing response factors to quantify the total ion abundance.
Stable carbon isotope measurements of n-alkanes were performed on selected samples, including crude oils and rock extracts from drill cores, using a Trace GC instrument coupled to a ThermoFisher DELTA-V IR mass spectrometer via a GC isolink combustion interface. CO2 was injected during each analysis as monitoring gas. The GC column and temperature programme used were the same as above. The saturated and aromatic hydrocarbon fractions of selected crude oils and rock ex- tracts from drill cuttings were placed into tinfoil boats for the bulk carbon isotope analyses and combusted in an oxygen atmosphere using an elemental analyser (Flash EA 1112) at 1020 ◦C. The evolving CO2 was separated by column chromatography and analysed online using a DELTA-V IR-MS. The 13C/12C isotope ratios of CO2 were compared with the monitoring gas. Stable isotope ratios are expressed relative to the Vienna Pee Dee Belemnite (V-PDB) standard in delta notation (δ13C = [(δ13C/δ12C)sample/(δ13C/δ12C)standard − 1]; Coplen, 2011). Delta nota- tion is reported in parts per thousand or per mil (‰). The analytical error during the measurements was better than 0.2‰.
4. Results
4.1. Bulk geochemical parameters of source rocks
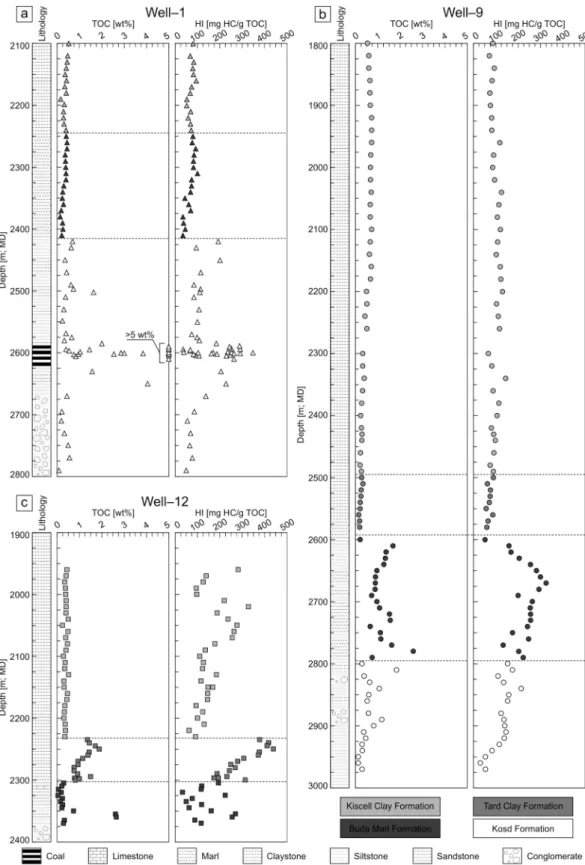
Several wells, including W–1, W–9 and W–12, penetrated the po- tential source rocks, which were sampled for hydrocarbon generation potential assessment (Fig. 3). Rock-Eval data are compiled in Appen- dices A (W–1), B (W–9) and C (W–12). The assignment of the sediments to stratigraphic units follows the internal reports of MOL Plc.
The Kosd Formation was penetrated by wells W–1 and W–9. TOC contents in samples from the Kosd Formation vary widely from 0.10 to 78.39 wt%, reflecting the presence of different lithotypes, including organic matter-lean siltstone, claystone, coaly shale and coal. The Tmax and HI values range from 431 to 451 ◦C and from 31 to 348 mg HC/g TOC, respectively (Fig. 4a). The PP varies between 0.05 and 209.64 mg HC/g rock and averages at 52.09 mg HC/g rock in high TOC (>2 wt%) intervals.
The sediments of Buda Marl Formation in wells W–1, W–9 and W–12 are characterised by TOC contents ranging from 0.04 to 2.65 wt% (avg.
0.73 wt%). The Tmax values range from 430 to 444 ◦C and the HI varies from 33 to 325 mg HC/g TOC (Fig. 4b). The PP reaches a maximum of 10.55 mg HC/g rock in well W–9 and averages at 4.78 mg HC/g rock at intervals where the TOC content is greater than 1 wt%.
Significant differences exist between organic matter contents and HI values of the Tard Clay Formation in the western well W–9 (0.15–0.30 wt% TOC; 65–104 mg HC/g TOC) and the eastern well W–12 (0.80–1.89 wt% TOC; 189–439 mg HC/g TOC). The Tmax values range from 434 to 441 ◦C (Fig. 4c). The PP is between 1.94 and 9.31 mg HC/g rock in well W–12 and averages at 6.14 mg HC/g rock in the upper high TOC (>1 wt
%) interval.
The TOC contents of the Kiscell Clay Formation in wells W–1, W–9 and W–12 range from 0.16 to 0.71 wt% (avg. 0.45 wt%). The Tmax values vary from 419 to 439 ◦C and the HI values are between 55 and 327 mg HC/g TOC (Fig. 4d). The PP is generally below 1 mg HC/g rock (max. 1.44 mg HC/g rock).
4.2. Crude oils
Crude oil samples from different hydrocarbon accumulations in the study area were analysed. Reservoir rocks include Mesozoic fractured carbonates, Eocene karstified carbonates, Eocene and Oligocene clastic reservoirs (Table 1). Eight samples were analysed in this study (W–1o to W–3o and W–8o to W–13o; Table 2), whereas MOL Plc provided data of the samples W–4o to W–7o (Table 2).
4.2.1. Molecular composition
The saturated hydrocarbons dominate in the oil samples, except in W–3o and W–11o. In the latter, the polar fractions prevail over the hydrocarbons (Table 2). The NSO compounds also appear in greater proportion in W–1o, W–8o, W–12o and W–13o samples, whereas the aromatic and asphaltene fractions remain constant in most samples (Table 2).
4.2.1.1. Straight-chain alkanes and isoprenoids. The n-alkanes dominate the aliphatic fraction of the crude oils (Fig. 5a). Short-chain n-alkanes (n- C15–19) are typically slightly more abundant than mid-chain n-alkanes (n-C21–25), but mid-chain n-alkanes predominate in samples W–8o, W–10o and W–13o (Table 2). Long-chain n-alkanes (n-C27–31) are also abundant in samples W–8o, W–10o and W–13o (Table 2). No distinct odd-over-even carbon number preference exists; the CPI values are close to one (max. 1.12; Table 2). Acyclic isoprenoids (C13–20) are consider- ably abundant (Fig. 5a). Pristane dominates over phytane (Fig. 5a;
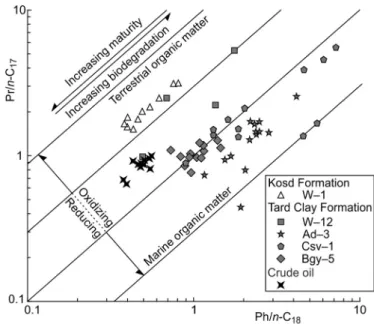
Table 2). The Pr/n-C17 (0.82–1.01) and Ph/n-C18 (0.43–0.56) ratios are similar in most oils but significantly lower in samples W–12o and W–13o (0.64–0.68 and 0.38–0.39, respectively; Fig. 6; Table 2).
4.2.1.2. Steroids. The C27–C29 5α,14β,17β (H) and 5α,14α,17α(H) ster- ane isomers are present in the crude oils (Fig. 7a). Normalised values of ααα(20R) steranes are provided on a ternary diagram (Huang and Meinshein, 1979), used to assess the depositional facies of organic matter (Fig. 8). The C28 and C29 homologues show a slight prevalence and are present in similar percentages (C28/C29: avg. 0.98; Fig. 8;
Table 2). The 24-n-propylcholestane and C28–C30 homologues of the
4–methylsteranes are also identified in significant amounts (Fig. 7a).
Diasteranes occur in lower concentration than the regular steranes (Fig. 7a) but show similar carbon number distribution. The values of the C27 diasteranes relative to the C27 regular steranes (C27 diaS/(diaS + regS)) vary from 0.19 to 0.49 (avg. 0.28; Table 2). Pregnanes are also present in the samples and the C21–C22 homologues show prominent peaks in most oil samples (Fig. 7a). The ratio of pregnanes to regular Fig. 3.Organic geochemical depth logs of the a) W–1, b) W–9 and c) W–12 wells based on Appendices A, B and C. The simplified lithologies presented according to the description of drill cuttings for each well. MD – measured depth.
steranes (C21–22/C27–29) reaches a maximum of 0.23 (avg. 0.13; Table 2).
The stereoisomer ratios of αααC29 steranes range from 0.50 to 0.56 (avg.
0.52) and the ratios of αββ/(αββ+ααα) isomers vary from 0.62 to 0.80 (avg. 0.72; Table 2).
4.2.1.3. Terpenoids. The occurrence of C27 to C35 17α,21β(H)–type hopanes dominates the hopanoids pattern with the absence of C28
hopanes. The predominant hopanoid in most samples is 17α,21β–C30
hopane (H; Fig. 7b). The 17α,21β(H)–type homohopanes show an
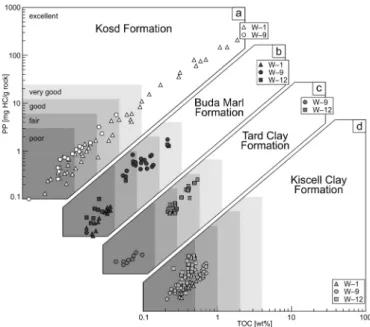
exponentially decreasing pattern in peak height with increasing carbon numbers (Fig. 7b). The 18α(H)–oleanane (Ol) is also present in consid- erable concentration (Fig. 7b). A series of C19– to C29– tricyclic terpanes (TT) appears. Whereas C22TT and C27TT are absent, a slight dominance of C23TT occurs (Fig. 7b), also reflected by low C19/C23TT, C20/C23TT, C21/C23TT and C24/C23TT ratios (avg. 0.55, 0.59, 0.83, 0.68, respec- tively; Table 3). The C24 tetracyclic terpane (TeT) and degraded TeT (10β(H)–des–A–oleanane and 10β(H)–des–A–lupane) are also identified in the samples (Fig. 7b). Gammacerane is present in low concentrations Fig. 4. Hydrocarbon generation potential assessment of a) Kosd Formation, b) Buda Marl Formation, c) Tard Clay Formation and d) Kiscell Clay Formation. Results presented for Csv–1, Ad–3 and Bgy–5 boreholes are taken form Bechtel et al. (2012). The hatched columns of the frequency diagram in Fig. 4d represent kerogen types without recorded Tmax values.
Table 2
Percentage of extracted fractions and concentration ratios of selected compounds and compound groups within the hydrocarbon fractions of the crude oil samples.
ID a b c d e f g h i j k l m n o p q r s t u
# [wt%] [‰; V-PDB] [%] [%]
W–1o 55 16 26 3 n.d. n.d. 36 33 17 1.06 0.96 0.54 1.79 23 42 35 1.20 0.16 0.22 0.51 0.74
W–2o 72 13 10 4 n.d. n.d. 35 33 16 1.05 0.89 0.48 1.83 26 40 34 1.18 0.23 0.26 0.56 0.74
W–3o 19 4 74 4 n.d. n.d. 35 33 17 1.00 0.88 0.50 1.78 24 40 36 1.11 0.20 0.23 0.52 0.75
W–4o 77 10 7 6 −27.7 −26.3 36 31 18 1.03 0.86 0.47 2.01 29 33 38 0.87 n.d. 0.24 0.52 0.68
W–5o 79 11 3 7 −27.8 −26.6 36 31 18 1.02 0.86 0.48 1.96 30 34 36 0.94 n.d. 0.22 0.53 0.69
W–6o 79 11 3 8 −27.4 −26.5 36 31 18 1.03 0.84 0.48 1.96 29 33 38 0.87 n.d. 0.24 0.54 0.69
W–7o 80 11 2 8 −27.7 −26.6 36 31 18 1.05 0.93 0.51 2.04 29 33 38 0.87 n.d. 0.22 0.53 0.69
W–8o 45 14 34 7 n.d. n.d. 27 34 27 1.05 0.82 0.55 1.66 35 30 35 0.86 0.02 0.36 0.52 0.80
W–10o 70 12 11 7 n.d. n.d. 18 34 35 1.12 0.92 0.43 2.19 27 32 40 0.80 0.04 0.42 0.51 0.62
W–11o 28 12 58 3 n.d. n.d. 35 33 17 1.01 1.01 0.56 1.77 23 40 36 1.11 0.16 0.19 0.50 0.71
W–12o 60 10 26 4 n.d. n.d. 39 31 15 1.06 0.68 0.38 1.91 24 38 38 1.00 0.11 0.31 0.56 0.67
W–13o 56 10 32 3 n.d. n.d. 27 33 28 1.06 0.64 0.39 1.68 34 32 35 0.91 0.10 0.49 0.51 0.77
a – saturated hydrocarbons, b – aromatic hydrocarbons, c – polar compounds, d – asphaltenes, e − δ13C saturated hydrocarbons, f – δ13C aromatic hydrocarbons, g – n- C15–19/n-C15–33, h – n-C21–25/n-C15–33, i – n-C27–31/n-C15–33, j – CPI (Bray and Evans, 1961), k – Pr/n-C17, l – Ph/n-C18, m – Pr/Ph, n – ααα(20R) C27 steranes/Σ ααα(20R) regular steranes, o – ααα(20R) C28 steranes/Σ ααα(20R) regular steranes, p – ααα(20R) C29 steranes/Σ ααα(20R) regular steranes, q – C28/C29 ααα(20R) steranes, r – C21–22/C27–29 steranes, s – C27 diaS/(diaS +regS), t – 20S/(20S +20R) ααα C29 sterane, u – αββ/(αββ+ααα) C29 sterane.
(Fig. 7b). The source-related biomarker ratios are similar in most of the analysed crude oils (Table 3). The stereoisomer ratio 22S/(22S +22R) of 17α,21β(H)–C32 hopanes varies from 0.55 to 0.61 (avg. 0.58; Table 3).
4.2.1.4. Aromatic hydrocarbons. The aromatic hydrocarbon fractions of the crude oils are characterised by the occurrence of naphthalene, phenanthrene, dibenzothiophene and their alkylated counterparts (Fig. 7b). Benzonaphthothiophenes are also present at a higher con- centration in the samples (Fig. 7b).
Vitrinite reflectance values based on the methylphenanthrene index (MPI 1; Radke et al., 1982a; 1982b) vary between 0.75 and 0.96% Rc(MPI 1) (avg. 0.84% Rc(MPI 1); Table 3; Radke and Welte, 1983). The diben- zothiophene/phenanthrene ratios (DBT/P; Hughes et al., 1995) range from 0.22 to 1.27 (avg. 0.66; Fig. 9; Table 3).
4.2.2. Stable carbon isotope data
The stable carbon isotope composition (δ13C) of the saturated hy- drocarbon fractions in crude oils W–4o to W–7o ranges from − 27.8‰ to
− 27.4‰. The δ13C values of the aromatic hydrocarbon fractions vary from − 26.6‰ to − 26.3‰ (Fig. 10a; Table 2).
Compound-specific δ13C data of n-alkanes are plotted versus chain length in Fig. 10b. Short-chain n-alkanes show a trend towards lower values (enrichment in 12C) with increasing chain length (Table 4).
Minima occur at n-C21, except in W–6o and W–8o, where the minima occur at n-C20. The mid-chain n-alkanes (n-C21–27) show an increasing trend. In contrast, long-chain n-alkanes (n-C27+) exhibit slightly decreasing δ13C values with an increase at n-C30 (Fig. 10b; Table 4).
5. Discussion
The study (i) assesses the petroleum potential of Upper Eocene to Lower Oligocene sediments in the Hungarian Palaeogene Basin, (ii) characterises the facies of the source rocks of the accumulated oils and (iii) correlate the accumulated oils to a specific source rock formation.
Therefore, a detailed biomarker-based interpretation of the source rocks is beyond the scope of the discussion. Nevertheless, Table 5 summarises source and maturity related biomarker parameters, calculated for the Kosd and Tard Clay formations.
5.1. Hydrocarbon generation potential of the Eocene to Lower Oligocene succession
The TOC contents and Rock-Eval parameters are used to assess the remaining hydrocarbon generation potential of the investigated sam- ples. The Kosd Formation was encountered at W–1 well with a thickness of 376 m, which includes a 36-m-thick coal measure (Korm¨ ¨os et al., 2020). In the W–9 well, the Kosd Formation is ~200 m thick. The HI reaches 350 mg HC/g TOC (Appendix A); however, HI values greater than 250 mg HC/g TOC are rare. The HI values of the drill cuttings suggest the presence of kerogen type IV to II/III (Peters, 1986), with a dominance of the type III kerogen (Fig. 4a). The HI values increase with increasing TOC content (Fig. 3; Appendices A and B), correlating with a previous study (K¨orm¨os et al., 2020). Tmax values are higher in W–1 well (avg. 445 ◦C at 2400–2800 m) than in the W–9 well (avg. 437 ◦C at Fig. 5. Gas chromatograms (total ion current) of the (a) saturated and (b) ar-
omatic hydrocarbon fractions. n-Alkanes are labelled according to the carbon number. MN – methylnapthalenes, DMN – dimethylnapthalenes, TMN – tri- methylnapthalenes, TeMN – tetramethylnapthalenes, P – phenanthrene, MP – methylphenanthrenen, DMP – dimethyphenanthrene, TMP – trimethylphe- nanthrene, DBT – dibenzothiophene, MDBT – methyldibenzothiophene, DMDBT – dimethyldibenzothiophene, BNT – benzonaphthothiophene, Std. – standard (deuterated n-tetracosane and 1,1′–binaphthyl, respectively).
Fig. 6.Cross plot of phytane/n-C18 vs. pristane/n-C17 of source rock and crude oil samples (after Connan and Cassou, 1980). Results representing W–1, Ad–3, Csv–1 and Bgy–5 wells are taken from K¨orm¨os et al. (2020) and Bechtel et al. (2012).
2800–3000 m). Nevertheless, oil window maturity (Bordenave et al., 1993) is reached in both wells. The high TOC contents and HI values point to a gas-and-oil-generating source with a very good and excellent petroleum potential (avg. 16.05 mg HC/g rock; Fig. 11a; Appendices A and B; Peters and Cassa, 1994).
The Buda Marl Formation was studied in wells W–1, W–9 and W–12.
The thickness of the formation reaches a maximum of 190 m at W–9, which is thicker than reported before (e.g. Less, 2005). Bechtel et al.
(2012) and Sachsenhofer et al. (2018a, 2018b) demonstrated that the uppermost part of the Buda Marl Formation, ~20 m thick, contains a maximum of 2.3 wt% TOC and HI values below 150 mg HC/g TOC at well Ad–3. Based on the obtained HI values, the kerogen type varies between type IV and II/III (Fig. 4b; Peters, 1986), whereas kerogen type III prevails. The Tmax values indicate oil window maturity in all wells (avg. 440 ◦C; Bordenave et al., 1993). Sediments with HI values exceeding 200 mg HC/g TOC occur in wells W–9 and W–12 and contain an average TOC of 1.25 wt%. These intervals within the Buda Marl Formation, which could reach a thickness of 100 m, are classified as fair oil source rocks with an average petroleum potential of 3.97 mg HC/g rock (Fig. 11b; Appendix B; Peters and Cassa, 1994).
The Tard Clay Formation is a well-known and exhaustively studied
potential source rock (e.g. Badics and Vet˝o, 2012; Bechtel et al., 2012;
Brukner-Wein et al., 1990; Milota et al., 1995). It was studied in wells W–9 and W–12. In W–12, the Tard Clay Formation is ~70 m thick. TOC contents (0.8–1.9 wt%) and HI values (190–440 mg HC/g TOC) increase upwards. The prevalence of kerogen type II and II/III (Figs. 3 and 4c;
Appendix C) agrees with previously published data from this formation (e.g. Badics and Veto, 2012; Bechtel et al., 2012; Brukner-Wein et al., ˝ 1990). The sharp decrease of TOC contents and HI values at the top of the Tard Clay Formation (Fig. 3) suggests an unconformity. Therefore, the uppermost part of the formation could be missing. In contrast to W–12, Tard Clay Formation in well W–9 (or its time-equivalent) is organic matter-lean (avg. 0.23 wt%) and contains type III kerogen. The Tmax values indicate oil window maturity in both wells (avg. 437 ◦C;
Bordenave et al., 1993). The Tard Clay Formation in W–12 is charac- terised as a fair oil source with a good petroleum potential in the upper 30 m (avg. 6.47 mg HC/g rock; Fig. 11c; Appendix C; Peters and Cassa, 1994).
Based on Milota et al. (1995), the Kiscell Clay Formation could reach a thickness of 500 m and some pelitic beds within the formation have been evaluated as a fair quality source. In the studied wells, the for- mation is up to 690 m thick (W–9; Fig. 3; Appendix B). The TOC content Fig. 7.Representative mass chromatograms of the a) steranes (m/z 217) and b) terpanes (m/z 191). TT – tricyclic terpane, TeT – tetracyclic terpane, HH – homohopanes, Std. – standard (deuterated n-tetracosane).
remains below 0.7 wt% (Appendices A, B and C). The HI values reveal the predominance of type III kerogen (Fig. 4d; Peters, 1986). Surpris- ingly, and despite low TOC contents (max. 0.51 wt%), type II/III and II kerogens occur in well W–12 between 1960 m and 2070 m depth (Appendix C). The Tmax values indicate that the organic matter is marginally matured in all wells (avg. 432 ◦C; Bordenave et al., 1993).
The petroleum potential classifies the Kiscell Clay Formation as poor source rock (avg. 0.56 mg HC/g rock; Fig. 11d; Appendices A, B and C;
Peters and Cassa, 1994).
Overall, the reviewed formations show significant variations in thickness, TOC contents and HI values. However, apart from the Kiscell Clay Formation, all formations include intervals that are capable of hydrocarbon generation.
5.2. Depositional facies of the source organic matter of oil samples The low- and intermediate-molecular weight n-alkanes are present in a high and relatively constant proportion in most of the crude oils, except in W–8o, W–10o and W–13o (Fig. 5a; Table 2), representing
shallow reservoirs (oil-water contact between 1722 and 2249 m depth;
Table 1). The short-chain n-alkanes (n-C15–19) were identified in algae and microorganisms (Cranwell, 1977; Cranwell et al., 1987). The δ13C-values of short-chain n-alkanes (Fig. 10b; Table 4) agree with carbon isotope values often found in freshwater algae (e.g. Lamb et al., 2006). Aquatic autotroph organisms utilise dissolved CO2[AQ] or HCO3−
as the inorganic carbon source and rather take CO2[AQ] until the source is exhausted, which leads to 12C enrichment (Lamb et al., 2006; Meyers, 1997). The concentration of CO2[AQ] in the water mass is the function of pH and temperature, therefore, marine organisms are characterised by heavier carbon isotope composition (Lamb et al., 2006). Nevertheless, the enzymatically mediated biological processes of bacteria are likely to lower the δ13C composition of the biomass (Cloern et al., 2002), espe- cially in oxygen-depleted conditions (Teece et al., 1999). The degrada- tion of organic constituents of marine algae may produce similar carbon isotope composition than in the studied samples (Meyers, 1997). The mid-chain n-alkanes (n-C21–25) were reported to predominate in extracts from aquatic macrophytes and Sphagnum (Bingham et al., 2010;
Dehmer, 1995; Ficken et al., 2000; Nott et al., 2000). The carbon isotope composition of mid-chain n-alkanes does not differ greatly from the short-chain homologues (Fig. 10b; Table 4) and corresponds well to the δ13C-values of C3 plants (e.g. Meyers, 1997). Submerged macrophytes behave like algae in the process of inorganic carbon fixation (Lamb Fig. 8.Ternary plot of ααα(20R) regular steranes (after Huang and Meinshein,
1979). The normalised abundance of the regular steranes in the Tard Clay and Kosd formations from wells Ad–3, Csv–1 and W–1 are taken from Bechtel et al.
(2012) and K¨orm¨os et al. (2020).
Table 3
Source- and maturity-related biomarker and non-biomarker ratios of crude oil samples.
ID a b c d e f g h i j k l m n o p
# [%]
W–1o 0.56 0.57 0.83 0.57 0.93 0.07 0.30 0.46 0.25 0.68 0.09 0.31 0.57 0.51 0.81 0.75
W–2o 0.60 0.68 0.81 0.61 0.80 0.09 0.30 0.40 0.29 0.75 0.09 0.32 0.55 0.56 0.87 0.72
W–3o 0.58 0.65 0.86 0.76 0.88 0.08 0.31 0.45 0.23 0.71 0.08 0.34 0.56 0.52 0.84 0.68
W–4o n.d. n.d. n.d. 0.54 0.84 0.12 0.39 0.45 0.29 0.86 0.11 0.31 0.59 0.52 0.87 0.59
W–5o n.d. n.d. n.d. 0.58 0.95 0.09 0.40 0.46 0.33 0.88 0.12 0.32 0.60 0.53 0.86 0.58
W–6o n.d. n.d. n.d. 0.57 0.95 0.09 0.40 0.45 0.30 0.87 0.12 0.31 0.61 0.54 0.87 0.59
W–7o n.d. n.d. n.d. 0.45 1.06 0.10 0.40 0.46 0.33 0.88 0.12 0.32 0.60 0.53 0.75 0.57
W–8o 0.31 0.66 0.79 0.89 1.02 0.04 0.19 0.43 0.31 0.64 0.10 0.39 0.60 0.50 0.82 0.59
W–10o 0.65 0.77 0.72 0.86 0.77 0.04 0.19 0.49 0.31 0.90 0.10 0.41 0.58 0.49 0.87 0.55
W–11o 0.68 0.74 0.96 0.59 0.94 0.08 0.17 0.40 0.24 0.64 0.08 0.22 0.55 0.50 0.76 1.27
W–12o 0.54 0.43 0.77 0.59 0.78 0.05 0.24 0.41 0.26 0.78 0.09 0.33 0.58 0.56 0.77 0.22
W–13o 0.48 0.21 0.87 1.09 0.84 0.04 0.21 0.54 0.35 0.88 0.10 0.32 0.59 0.62 0.96 0.83
a – C19/C23TT, b – C20/C23TT, c – C21/C23TT, d – C24/C23TT, e − C26/C25TT, f – C23TT/17α,21β–C30 hopane (C23 TT/H), g – Ol/(Ol +H); h – 17α,21β–C30 norhopane/
17α,21β–C30 hopane (NH/H), i – 17α,21β–C31 (22R) homohopane/17α,21β–C30 hopane (C31(R)/H), j – 17α,21β–C35 (22S) homohopane/17α,21β–C34 (22S) homo- hopane (C35(S)/C34(S)), k – 17α,21β–C35 homohopane/17α,21β–C31–35 homohopane (C35/C31–35), l – steranes/hopanes, m – 22S/(22S +22R) 17α,21β–C32 homo- hopane, n – 17α–C27 trisnorhopane/(17α–C27 trisnorhopane+18α–C27 trisnorneohopane (Ts/(Ts +Tm)), o – %Rc(MPI 1) (Radke and Welte, 1983), p – DBT/P (Hughes et al., 1995).
Fig. 9. Cross plot of pristane/phytane vs. dibenzothiophenes/phenanthrene ratios of the studied samples (after Hughes et al., 1995). The ratios in the Kosd Formation from well W–1 is taken from Korm¨ ¨os et al. (2020). Pr – pristane, Ph – phytane, DBT – dibenzothiophenes, P – phenanthrene.
et al., 2006; Meyers, 1997), and species, photosynthesizing according to the C3 pathway, were noticed before (e.g. Ficken et al., 1998; Mortillaro et al., 2016). The high-molecular weight n-alkanes (n-C27–31) were derived from plant-waxes (Eglinton and Hamilton, 1967) and reached a maximum of 35% of the total n-alkanes in sample W–10o (Table 2). The δ13C-values are comparable with the typical carbon isotope values of C3 plants (e.g. Meyers, 1997). Terrestrial plants employ atmospheric CO2
during photosynthesis (Lamb et al., 2006; Meyers, 1997) but the biosynthesis and maturation-induced fractionations of carbon isotopes vary among plant types (Diefendorf et al., 2011, 2015; Lockheart et al., 1997) and are comparable with the observed values.
The V-shape character of the compound-specific stable carbon isotope in the range of short- and mid-chain n-alkanes (Fig. 10b; Table 4) Fig. 10. Stable carbon isotope composition of the a) saturated and aromatic hydrocarbon fraction of the Tard Clay and crude oil samples. The δ13C values of the Tard Clay from Ad–3, Csv–1 and Bgy–5 wells are taken from Bechtel et al.
(2012). The marine and terrigenous lines are based on Sofer (1984). (b) Compound-specific isotope of n-alkanes in the studied samples. The grey shaded areas represent δ13C values of the Tard Clay (Bechtel et al., 2012) and Kosd Formation (K¨orm¨os et al., 2020). Mean values of four samples are presented for Kosd Formation from W–1 well.
Table 4 Compound-specific stable carbon isotope of investigated oil samples. ID n-C15 n-C16 n-C17 n-C18 n-C19 n-C20 n-C21 n-C22 n-C23 n-C24 n-C25 n-C26 n-C27 n-C28 n-C29 n-C30 n-C31 # [‰; V-PDB] W–1o −28.8 −28.9 −28.9 −29.1 −29.6 −30.3 −30.9 −30.4 −29.7 −29.3 −29.1 −29.2 −28.8 −29.0 −29.6 −29.2 −29.2 W–2o −28.7 −29.0 −29.1 −29.3 −29.4 −30.0 −31.2 −30.4 −30.0 −29.4 −29.5 −29.2 −28.9 −28.9 −29.4 −29.7 −29.6 W–3o n.d. −28.9 −29.2 −29.0 −29.8 −30.4 −31.1 −30.3 −29.7 −29.4 −29.1 −29.0 −29.1 −29.3 −29.5 −29.8 n.d. W–5o −28.6 −28.7 −29.4 −29.6 −30.3 −30.3 −30.2 −29.7 −29.6 −28.8 −28.5 −28.5 −28.7 −28.5 −28.9 −28.4 −28.1 W–6o −28.8 −28.8 −29.4 −29.7 −30.2 −30.6 −30.5 −29.9 −29.9 −28.7 −28.6 −28.8 −28.7 −28.8 −28.5 −28.3 −28.4 W–8o −27.7 −28.1 −28.9 −29.4 −30.1 −29.8 −30.4 −29.3 −28.9 −28.4 −28.1 −28.1 −28.3 −28.3 −28.4 −28.6 −27.6 W–10o −29.0 −29.2 −29.8 −29.9 −30.0 −30.0 −30.4 −29.5 −29.9 −29.6 −29.1 −29.2 −29.3 −29.6 −29.5 −29.3 −29.0 W–11o −28.7 −28.8 −29.2 −29.4 −30.2 −30.6 −31.2 −30.4 −30.1 −29.9 −29.6 −29.2 −29.0 −29.4 −29.3 −29.6 −29.3 W–12o n.d. −28.8 −29.1 −29.4 −29.7 −30.2 −30.7 −30.1 −30.2 −29.6 −29.1 −28.9 −29.1 −29.3 −29.4 n.d. n.d. W–13o −28.5 −28.7 −30.0 −30.4 −30.6 −30.0 −31.2 −30.6 −30.4 −29.3 −28.8 −28.9 −28.9 −29.0 −28.8 −28.6 −28.5

![Table 4 Compound-specific stable carbon isotope of investigated oil samples. ID n-C 15 n-C16 n-C17 n-C18 n-C19 n-C20 n-C21 n-C22 n-C23 n-C24 n-C25 n-C26 n-C27 n-C28 n-C29 n-C30 n-C31 # [‰; V-PDB] W–1o −28.8 −28.9 −28.9 −29.1 −29.6 −30.3 −30.9 −30.4 −2](https://thumb-eu.123doks.com/thumbv2/9dokorg/966984.57457/11.892.575.751.81.1125/table-compound-specific-stable-carbon-isotope-investigated-samples.webp)