Biplot Analysis of Line × Tester Data of Maize (Zea mays L.) Inbred Lines under Stress and Nonstress Environments
B. Badu-Apraku*1 and R.O. Akinwale2
1International Institute of Tropical Agriculture, P.M.B. 5320, Ibadan, Nigeria
2Obafemi Awolowo University, Ile-Ife, Nigeria (Received 25 September 2018; Accepted 30 April 2019)
The GGE biplot tool has potential for determining combining ability effects, identifying distinct heterotic groups and efficient testers in a line × tester study. However, its use for such analysis has not been adequately explored. The objectives of this study were to (i) assess combining ability of extra-early maturing lines (80–85 days to physiological maturity) and testers for grain yield (ii) classify lines into heterotic groups and (iii) identify most efficient testers using GGE biplot. Sixty-three lines crossed to four testers were evaluated under Striga-infested, drought and nonstress environments for 2 years in Nigeria. Results of GGE biplot analyses of combining ability and heterotic patterns of yield of lines, grouping and identification of testers were close to those of the conventional line × tester method. Testers TZEEI 13, TZEEI 21 and TZEEI 29 were highly efficient in grouping lines under stress environments while testers TZEEI 21 and TZEEI 29 were best under nonstress environ- ments. The GGE biplot identified tester TZEEI 13, TZEEI 21 and TZEEI 29 as most efficient across stress environments and TZEEI 21 and TZEEI 29 across nonstress environments.
Keywords: GGE biplot, combining ability, drought, ideal tester, Striga hermonthica
Introduction
Genotype main effect plus genotype × environment interaction (GGE) biplot software has been described as a veritable statistical tool for graphical analysis of any set of data that may be cast into a 2-way table. The statistical software was primarily designed to analyze a multi-environment data by partitioning the genotype effect and the genotype × environ- ment interaction into the first two principal axes (PC1 and PC2) to examine the interrela- tionships among rows (testers) and columns (entries) based on environment-centered principal component analysis (PCA) (Yan and Hunt 2002).
Maize scientists at the International Institute of Tropical Agriculture (IITA), Ibadan, Nigeria have developed a large number of new extra-early-maturing inbred lines with genes for tolerance to multiple stresses. To maximize the yield potential of these new in- breds in hybrid combinations, there is need to classify them into distinct heterotic groups and determine the combining ability of the lines to facilitate planned crosses. Several testers have been identified in the extra-early maize germplasm through several combin-
*Corresponding author E-mail: b.badu-apraku@cgiar.org
ing ability studies conducted by IITA scientists (Badu-Apraku et al. 2011a, b, 2015;
Badu-Apraku and Fakorede 2017). However, there is limited information on the effec- tiveness of these testers in classifying extra-early maize lines into heterotic groups. Fur- thermore, there is a need to refine the established heterotic groups of the extra-early tropical inbred lines developed in IITA and national maize programs of WCA in an effort to enhance the gains from selection for multiple stress tolerance in the extra-early matu- rity group. The data set used in the present paper has been analyzed and published using the conventional line × tester analysis method (Amegbor et al. 2017). However, it is used in the present study to demonstrate the efficiency of GGE biplot in analyzing a line × test- er data.
The objectives of this study were to (i) assess the combining ability of a set of newly developed multiple stress tolerant extra-early maize inbred lines across multiple stress and non-stress environments using GGE biplot; (ii) compare the heterotic groups of the inbreds using conventional line × tester mating design and GGE biplot methods; and (iii) determine the efficiency of testers in classifying the inbred lines into heterotic groups.
Materials and Methods
Sixty-three new extra-early inbred lines derived from crosses between the wild maize, Zea diploperrennis and elite inbreds from the IITA Maize Improvement Programme were crossed to four extra-early elite testers (TZEEI 13, TZEEI 14, TZEEI 21 and TZEEI 29) identified from previous heterotic grouping study (Badu-Apraku et al. 2013) to obtain 252 F1 hybrids. The 252 single-cross hybrids plus four hybrid checks were evaluated under stress and non-stress environments. Under each environment, the experiment con- sisted of single-row plots, with spacing of 0.75 m between rows and 0.40 m within rows.
The single-row plots were 3 m long for all experiments and were laid out as 16 × 9 lattice design. Three seeds were sown per hill and seedlings were thinned to two at two weeks after planting (WAP) to give a final plant density of 66,666 plants ha–1.
The stress environments comprised four evaluations in all; two evaluations under man- aged drought stress during the dry seasons of 2013/2014 and 2014/2015 at Ikenne (lat.
6’87°N, long. 3’7°E, elevation of 60 m above sea level and 1500 mm annual rainfall).
Here, drought was induced by withdrawing the irrigation water 21 days after planting (DAP) until maturity such that flowering and grain filling periods of the plants coincided with drought. The remaining two evaluations were conducted under artificial Striga-in- fested environments at Mokwa and Abuja (9’16°N, 7’20°E, 300 altitude, 1500 mm rain- fall) in the southern Guinea savanna of Nigeria in 2013 and 2014. Infestation with Striga was done according to the method of Kim (1991) and Kim and Winslow (1991). Ferti- lizer was applied at the rate of 30 kg ha–1 each of N, P, and K as NPK 15–15–15. Weeds other than Striga plants were controlled through hand weeding.
Under nonstress environments, the hybrids were evaluated under four optimal growing conditions during the major growing season of 2014 at Ikenne, Mokwa, Ile-Ife (7°28’ N, 4°33’E, and 244 m above sea level, 1200 mm annual rainfall) and Bagauda (12°00’N 8°22’E, elevation 580 m, 800 mm annual rainfall). Fertilizer was applied at the rate of 60
kg ha–1 each of N, P and K (15–15–15) at 2–3 weeks after planting (WAP) and an addi- tional 60 kg ha–1 of urea was top-dressed at 4 to 5 WAP. The trials were kept weed-free with the application of pre- and post-emergence herbicides, primextra and paraquat each at 5 l/ha and subsequently, by hand weeding.
Data were collected under both stress and nonstress environments on days to 50% silk- ing (DS) and anthesis (DA) as the number of days from planting to when 50% of the plants had extruded silks and shed pollen, respectively. Anthesis-silking interval (ASI) was cal- culated as the difference between DS and DA. Plant aspect (PASP) was rated on a scale of 1–9, where 1 = excellent plant architecture and 9 = poor plants. Number of ears per plant (EPP) was obtained by dividing the total number of ears per plot by the number of plants harvested. Ear aspect (EASP) was recorded on a scale of 1–9 where 1 = clean, uniform, large, and well-filled ears while 9 = ears with undesirable features such as diseases, small ears, and ears with poorly filled grains. In addition, stay-green characteristic (STGR) was scored for the drought-stress experiments at 70 DAP on a scale of 1 to 9, where 1 = almost all leaves green and 9 = virtually all leaves dead. Host plant damage syndrome rating (Kim 1991) and number of emerged Striga plants were recorded at 8 and 10 WAP in the Striga- infested plots at Mokwa, and Abuja. Striga damage was scored per plot on a scale of 1–9 where 1 = no damage, indicating normal plant growth, and 9 = complete collapse or death of the maize plants (Kim 1991). In the drought-stress experiments, harvested ears from each plot were shelled and grain moisture was determined using Kett grain moisture tester PM-450. Grain yield (kg ha–1) was computed from the shelled grain weight (kg/plot) at 15% moisture content of each entry, assuming a shelling percentage of 80%.
Statistical analysis
Analysis of variance (ANOVA) of data combined across four environments under each research condition i.e., stress and nonstress environments, was performed to determine significant effects of genotype and genotype-by-environment (G × E) interaction using PROC GLM procedure in Statistical Analysis System (SAS) (SAS Institute 2011). The environment, replication within environment and incomplete block within replication-by- environment were defined as random effects, while genotypes were considered as fixed effects and their adjusted means and standard errors were estimated. Adjusted mean yield data from ANOVA of the line × tester study were subjected to genotype main effect plus genotype-by-environment interaction (GGE) biplot analysis to graphically visualize the combining ability of the lines in hybrid combinations, classify the inbred lines into heter- otic groups and assess the efficiency of testers used in the study (Akinwale et al. 2014).
The analysis was done using the GGE biplot windows application that fully automates biplot analysis. For the GGE biplot model, data were not transformed (Transform = 0), not standardized (Scale = 0) and were environment-centered (Centering = 2). Striga count data were subjected to logarithm (y + 1) transformation before analysis. The effi- ciency of GGE biplot grouping method was assessed using the method proposed by Fan et al. (2009) as modified by Badu-Apraku et al. (2015).
Results
Analysis of variance across environments for stress and nonstress conditions
Results of the analysis of variance revealed significant mean squares for genotypes, envi- ronments, and genotype × environment interactions for grain yield and other agronomic traits of the hybrids under stress and nonstress environments (Tables 1 and 2). This justi- fied the use of GGE biplot for the genetic analysis. Grain yield of hybrids ranged between 1782 kg/ha for TZdEEI 100 × TZEEI 21 and 4445 kg/ha for TZdEEI 50 × TZEEI 13 with an average of 3077 kg/ha under multiple stress environments. Under nonstress environ- ments, grain yield varied from 3105 kg/ha for TZdEEI 96 × TZEEI 21 and 5633 kg/ha for TZdEEI 72 × TZEEI 13 with an average of 4300 kg/ha (Table 3). The percent reduction in yield due to the multiple stresses was 28.3%. Line × tester analysis showed significant mean squares for evaluation environments, general combining ability (GCA) for both line and tester, and line × tester (SCA) for most traits (Tables 1 and 2). Similarly, mean squares for line × environment, tester × environment for grain yield and most agronomic traits across research environments were significant.
Under stress environments, tester TZEEI 14 had the highest GCA effects (218.16) for grain yield, followed by TZEEI 29 (1.02), TZEEI 13 (33.6) while tester TZEEI 21 (–168.99) had the lowest GCA. Under nonstress environments on the other hand, TZEEI 29 had the highest GCA effect (107.64) followed by TZEEI 13 (53.05), TZEEI 14 (–45.26) and TZEEI 21 (–125.82) (Table 4). The total number of lines classified into heterotic groups under stress environments were 29 while 39 lines were grouped under nonstress environments (Table 4). Under stress environments, tester TZEEI 21 classified the largest number of lines (9) while TZEEI 13 grouped the largest number of lines (13) under non- stress environments (Table 4). Breeding efficiency was 73% under stress environments and 93% under nonstress environments.
Biplot analysis of the line × tester data Identification of heterotic groups and best hybrids
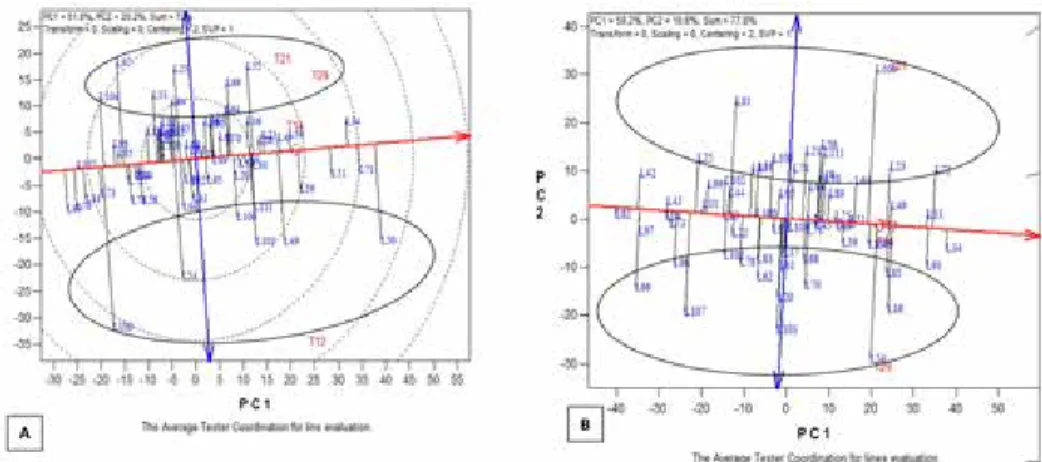
The biplot model of the analysis of the line × tester data explained 68.5% (47.4% for PC1 and 21.1% for PC2) of the total variation in yield of the testcross hybrids across stress environments and 77.6% (58.2% for PC1 and 19.6% for PC2) across nonstress environ- ments (Figs 1–4). The polygon view of the biplot analysis of a line × tester data reveals visually the pattern of interaction between the lines and testers used with a view to iden- tify the best mating partner for each of the testers and the best hybrids under each study environment. In the polygon view of the GGE biplot (Fig. 1), the vertex inbred in a sector is adjudged the best mating partner for the tester(s) that fell into its sector. Lines located close to the origin of the biplot were less responsive to the different testers relative to other lines within the respective groups. Similarly, vertex inbreds, which had no testers in their respective sectors were not responsive, indicating that they did not combine well with any of the testers. The biplot display in Figure 1 revealed that under stress environ-
Table 1. Combined analysis of variance of grain yield and other agronomic traits of extra-early maize testcrosses evaluated at four locations in Nigeria under stress environments in 2013 and 2014 SourceDFGrain yield, kg/ha Ears per plant
Days to silkASIEar aspectDFPlant aspectLeaf death scoreDFStriga damage rating
10 WAP
Number of emerged Striga count 10 WAP Block (Rep*Env†)1202617098**0.03**13.8**6.3**1.59**601.31**1.41**22.29*6571.74** Rep (Env)48815471**0.10**27.1**7.23.08**21.9521.90**602.75**804.47** Env3260666819**2.42**3811.8**236.7**37.74**119.53**702.88**16.06**1647.00** Entry2511509508**0.02**14.7**5.8**1.17** 2511.27**0.79**2511.36**349.28** Line623073649**0.03**25.3**8.5**1.91**622.32**0.76**622.90**610.46** Tester312081273**0.10**59.6**20.5**15.34**313.58**11.99**35.54**1060.45** Line*Tester186747084**0.029.8**4.7*0.64**1860.690.61**1860.76**235.48* ENV*Entry752931755**0.02**8.698*4.70.75** 7520.860.522510.75**261.24** ENV*Line1861359723**0.02**10.9**4.41.14**620.970.48620.81*400.97** ENV*Tester96248887**0.04**25.2**10.7**4.15**30.731.2035.29**287.50 ENV*Line*Tester557692023**0.027.74.70.56**1850.830.531860.66215.32 Error8775843720.017.74.40.494380.740.474410.55184.58 *,** Significant at 0.05 and 0.01 level of probability, respectively. † Env – Environment. ASI = Anthesis-silking interval.
ments, line TZdEEI 34 (represented in the biplot by L34) was the best mating partner for testers TZEEI 14, TZEEI 21 and TZEEI 29 while line TZdEEI 50 was the best for tester TZEEI 13. Thus, the best hybrids under stress environments were TZdEEI 34 × TZEEI 21, TZdEEI 34 × TZEEI 14, TZdEEI 34 × TZEEI 29 and TZdEEI 50 × TZEEI 13. Across
Table 2. Combined analysis of variance for grain yield and other agronomic traits of extra-early maize testcrosses evaluated at four sites in Nigeria under nonstress environments in 2013 and 2014
Source DF Grain yield,
kg/ha Ears per
plant Days to silk ASI DF Ear aspect Plant aspect Block (Rep*Env†) 121 1998465** 0.01** 5.43** 0.46 121 0.28** 0.32**
Rep (Env) 4 39533600** 0.09** 23.64** 0.50 4 2.54** 1.73**
Env 3 212204825** 1.20** 3764.31** 53.94** 3 295.36** 1.60**
Entry 251 1629081** 0.02** 7.01** 0.74** 251 0.34** 0.31**
Line 62 3461966** 0.03** 13.50** 1.49** 62 0.42** 0.70**
Tester 3 3546272** 0.17** 84.04** 0.91 3 6.26** 0.19
Line*Tester 186 944297** 0.02** 3.40** 0.46 186 0.21** 0.17**
Env*Entry 753 929266** 0.01** 2.78** 0.53** 753 0.23** 0.17**
Env*Line 186 1419374** 0.01** 3.84** 0.73** 186 0.37** 0.21**
Env*Tester 9 6775700** 0.07** 13.35** 1.02** 9 2.15** 1.30**
Env*Line*Tester 558 654826** 0.01** 2.24** 0.44 558 0.14 0.14
Error 882 521269 0.01 1.78 0.40 881 0.15 0.13
*,** Significant at 0.05 and 0.01 level of probability, respectively.
† Environment.
ASI = Anthesis-silking interval.
Table 3. Summary statistics of grain yield and other agronomic traits of maize testcross hybrids evaluated under stress and nonstress environments between 2013 and 2014
Statistic Grain yield
kg/ha Days to silk ASI Ear aspect Ears per
plant Plant aspect Leaf death score Stress environments
Mean 3079 53.7 1.8 4.8 0.9 5.5 3.7
Minimum 1782 47.3 –1.8 3.6 0.7 4.0 2.5
Maximum 4445 64.5 12.9 5.6 1.0 8.3 5.0
Standard deviation 460 1.4 0.9 0.4 0.1 0.6 0.5
Non-stress environments
Mean 4300 52.6 0.6 3.4 1.0 2.9
Minimum 3105 49.8 0.0 2.8 0.8 2.3
Maximum 5633 54.9 2.0 3.9 1.1 3.4
Standard deviation 468 1.0 0.3 0.2 0.1 0.2
ASI = Anthesis-silking interval.
nonstress environments, line TZdEEI 106 was the vertex inbred for tester TZEEI 21; line TZdEEI 34 was the vertex inbred for testers TZEEI 13 and TZEEI 14; while line TZdEEI 54 was the vertex inbred for tester TZEEI 29. Thus, the best hybrids under nonstress en- vironments were TZdEEI 106 × TZEEI 21, TZdEEI 34 × TZEEI 13, TZdEEI 34 × TZEEI 14, and TZdEEI 54 × TZEEI 29.
Combining ability and heterotic groups under stress and nonstress environments Heterotic groups were identified using the average tester ordination view of the GGE bi- plot. In the biplot display, the axis of the average environment coordinate (AEC) abscissa,
Table 4. Means general combining ability (GCA) for grain yield of each tester across lines and number of lines classified by each tester and efficiency of GGE biplot as a heterotic grouping method
Tester
Stress Nonstress
Mean grain yield (kg ha–1)
GCA effect for grain
yield
Number of lines classified
Mean grain yield (kg ha–1)
GCA effect for grain
yield
Number of lines classified
TZEEI 13 3028 –51.99 7 4355 53.05 13
TZEEI 14 3298 218.16 6 4257 –45.26 7
TZEEI 21 2911 –168.99 9 4176 –125.82 10
TZEEI 29 3081 1.02 7 4409 107.64 9
LSD (0.05) 81.06 100.44 51.84 110.49
Number of lines
not classified 34 24
Total number of lines 63 63
Breeding efficiency 73 93
Figure 1. A polygon view of GGE biplot analysis of line × tester data showing the best mating partners for the different testers across (A) stress and (B) nonstress environments
or “average environment axis” is the single-arrowed line that passes through the biplot origin and the “average environment,” which is at the center of the small circle. In the GGE biplot view (Fig. 2), the ATC abscissa (single-arrowed horizontal line) approxi- mated the average general combining ability (GCA) effects of entries. Points located above this line indicated positive GCA effects while those below the line had negative GCA effects. The average-tester coordination ATC ordinate (double-arrowed vertical line) and the ATC abscissa divided the biplot into four right-angled triangles. The top right triangle contained points with high positive GCA while the top left contained low positive GCA. Similarly, the bottom right triangle contained high negative GCA effects while the bottom left triangle contained low negative GCA effects. Values for the entries increased as the concentric cycles became larger. The projections from each entry onto the horizontal line indicated the deviation from the average effect, which was an indica- tion of the specific combining ability (SCA). From the biplot display in Figure 2A, two
Figure 2. Vector view of the GGE biplot showing the performance of the inbred lines (GCA) across the four testers across (A) stress and (B) nonstress environments
Figure 3. Vector view of the GGE biplot showing the best lines based on GCA effects across (A) multiple stress and (B) nonstress environments
distinct heterotic groups could be identified among the lines under stress environments.
Group 1 comprised TZdEEI 25, TZdEEI 33, TZdEEI 55, TZdEEI 64, TZdEEI 69, TZ- dEEI 84, TZdEEI 97, and TZdEEI 104, while group 2 consisted of TZdEEI 49, TZdEEI 50, TZdEEI 54, TZdEEI 100, TZdEEI 106, and TZdEEI 111. Under nonstress environ- ments, two heterotic groups were identified (Fig. 2B). Group 1 comprised TZdEEI 21, TZdEEI 23, TZdEEI 25, TZdEEI 56, TZdEEI 58, TZdEEI 71, TZdEEI 72, TZdEEI 74, TZdEEI 81, TZdEEI 106, TZdEEI 108, and TZdEEI 111, while group 2 was made up of TZdEEI 16, TZdEEI 17, TZdEEI 54, TZdEEI 56, TZdEEI 61, TZdEEI 62, TZdEEI 66, TZdEEI 68, TZdEEI 70, TZdEEI 78, TZdEEI 83, TZdEEI 85, TZdEEI 96, TZdEEI 103, TZdEEI 105, and TZdEEI 107. Ranking of the lines based on GCA effects identified TZdEEI 34, TZdEEI 71, and TZdEEI 51 as lines with good GCA under stress environ- ments (Fig. 3A) and TZdEEI 33, TZdEEI 34, TZdEEI49, TZdEEI 72, and TZdEEI 91 under nonstress environments (Fig. 3B).
Efficiency of testers for general combining ability and efficiency of heterotic grouping methods
The efficiency of a tester is assessed by the average tester ordination view of the GGE biplot (Akinwale et al. 2014). The efficiency is assessed by the angle between a testers’
vector relative to the average tester axis and the length of the testers’ vector. In the biplot display, the cosine of the angle between any two tester vectors approximate the correla- tion coefficient between the testers. The smaller the angle between any two testers, the more closely related the testers were in classifying inbreds into heterotic groups. A right angle (90°) indicated no relationship while an obtuse angle (>90°) indicated negative cor- relation. In addition, in the biplot display, the rays connecting the tester label to the biplot origin were described as tester vectors and the vector length of a tester approximated the standard deviation, which measured the magnitude (discriminating power) of its ability to
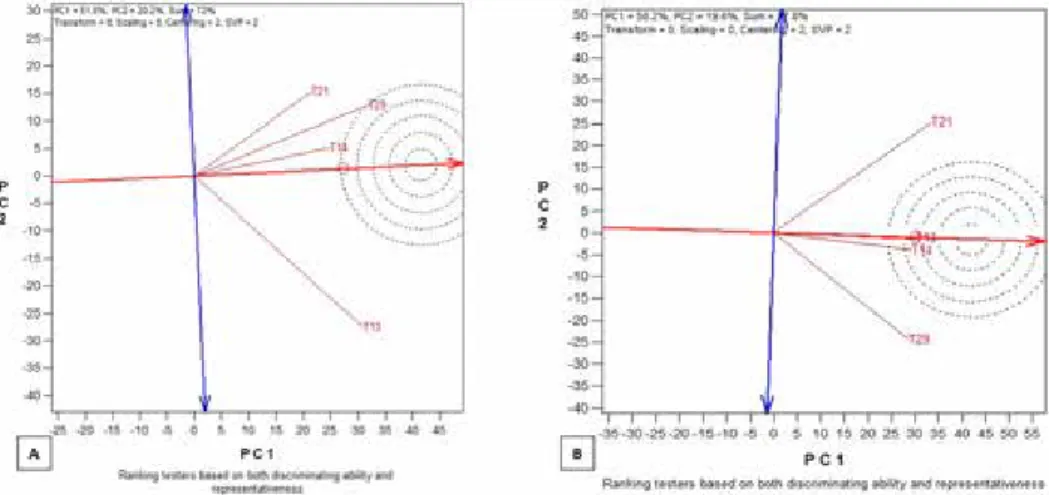
Figure 4. A vector view of the GGE biplot showing the ideal testers based on the discriminating power and representativeness of the testers across (A) multiple stress and (B) nonstress environments
assess the GCA of an inbred line. Based on the method of Yan et al. (2010), testers with shorter vectors were not strongly correlated with those with longer vectors and they were probably not strongly correlated with one another either.
In this study under stress environments, testers TZEEI 14, TZEEI 21 and TZEEI 29 had acute angles among their vectors, indicating that they had high positive correlations between them under stress environments (Fig. 1A). On the contrary, the vector of TZEEI 13 had approximately right angle 90° with TZEEI 21 and TZEEI 29, indicating that there was no relationship between TZEEI 13 and other testers and thus, TZEEI 13 represented a different heterotic group (Fig. 4A). Under nonstress environments, testers TZEEI 13 and TZEEI 14 had a small acute angle between their vectors, indicating that the two test- ers classified the lines similarly. TZEEI 21 and TZEEI 29 had an angle close to 90°, indi- cating that the two testers represented different heterotic groups and did not classify the lines the same way (Fig. 4B). Furthermore, based on the vector length of testers, the test- ers could be ranked in descending order of their discriminating power under stress envi- ronments as follows: TZEEI 13 > TZEEI 29 > TZEEI 21 > TZEEI 14 (Fig. 4A). The rank- ing based on discriminating ability of the testers under nonstress environments is as fol- lows: TZEEI 21 > TZEEI 29 > TZEEI 13 > TZEEI 14.
An ideal tester should have the longest vector of all testers (i.e., be most discriminat- ing) and have zero projection onto the ATC ordinate (i.e., be most representative of test- ers). Such a tester should be in the center of the concentric circles (Figs 4A and B). Thus, the closer a tester’s marker was to the ideal tester, the better it was. In this study, an ideal tester could not be identified under stress environment. However, testers TZEEI 13 and TZEEI 14 were the closest to the ideal tester under nonstress environments (Fig. 4B).
Results of the comparison of the efficiency of the heterotic grouping methods revealed that breeding efficiencies using GGE biplot were 73 and 93% under stress and nonstress environments, respectively (Table 4).
Discussion
Results of the analysis of variance showed wide genetic variability for grain yield and other measured traits of the hybrids, indicating that promising hybrids could be identified under stress and nonstress environments for release and commercialization. Similarly, significant genetic variability for grain yield of lines and testers was observed under both stress and nonstress environments, indicating that these traits could be improved through hybridization under both research environments. The significant differences in the mean squares for GCA among lines and testers as well as for SCA for grain yield indicated that the lines were genetically diverse enough to be classified into groups and that the testers were capable of identifying clear heterotic groups among the inbred lines under both stress and nonstress environments. The percentage reduction in grain yield of the hybrids when the yield under stress and nonstress environments was compared implied that the stress was sufficient to facilitate the study of the genetics of tolerance to the stresses and to identify stress tolerant genotypes.
The five lines with significant positive GCA effects for grain yield identified under stress and nonstress environments could serve as invaluable sources of beneficial alleles for introgressing genes for grain yield improvement into existing maize populations in the IITA maize programs as well as other tropical maize populations. Inbred TZdEEI 34 was identified among the 10 top ranking lines under both research environments indicating that it is a good combiner under both environments.
An important objective of this study was to assess the usefulness of GGE biplot in the analysis of line × tester data. When the results of this study were compared with the re- sults of the conventional method used by Amegbor et al. (2017), the GGE biplot used in this study ranked the inbreds based on GCA effects of the parents similarly as the conven- tional method under stress environments. Inbreds identified as possessing significant GCA effects under nonstress environments were also identified by the GGE biplot except TZdEEI 49, which was identified by GGE biplot but not the conventional analysis. Rank- ing of the four testers based on GCA effects suggested that TZEEI 14 was the best tester under stress environments while TZEEI 29 was the best under nonstress environments.
With respect to the number of lines classified by each tester, TZEEI 21 classified the larg- est number of lines under stress environments while TZEEI 13 identified the largest num- ber of lines under nonstress environments (Table 4). For breeding purposes, a useful tester must have a good GCA, no matter which heterotic group it belongs to. This quality of a good tester helps to identify potentially high yielding hybrids and inbreds with good breeding values. Specific combining ability effect is also important in classifying inbreds into heterotic groups and in selection and breeding for superior hybrids but doesn’t make an inbred an efficient tester. However, considering the large number of newly developed inbred lines in tropical maize breeding programmes in recent years, it is expedient that a good tester should not only possess good GCA effects but should also have the ability to discriminate among lines and classify a good number of inbreds. Otherwise, many of the newly developed lines would become useless and efforts and funds expended to develop them would be wasted. In the present study, the ability of the testers to classify lines into heterotic groups was independent of their GCA effects. Tester TZEEI 21 that classified the largest number of lines had the poorest GCA effect (–168.99). Similarly, under non- stress environments, the same TZEEI 21 that had the poorest GCA effect (–125.8) classi- fied 10 lines, which was larger than the number of lines classified by TZEEI 29, which had the highest GCA effects. It could therefore be inferred from this result that the effi- ciency of a tester in a line × tester study is not a function of the GCA effect of the tester.
Perhaps, the SCA effect could be more important in selecting efficient testers than the GCA effect. However, this information cannot be verified in the present study since the testers were not crossed among themselves.
From the results of the GGE biplot, the smaller percentage of total variation explained by the PC1 and PC2 across stress environments compared with nonstress environments indicated that genetic interactions among the lines, testers and the environments were more complex than those of the nonstress environments. The results of the GGE biplot revealed two groups under each research environment.
The implication of the high positive correlations among TZEEI 14, TZEEI 21 and TZEEI 29 is that the three testers identified the same heterotic group and therefore using only one of the three testers would have given the same results without sacrificing preci- sion. The short vector of TZEEI 14 is an indication that it had low discrimination power and thus did not provide as much information about the lines as the other two testers.
Thus, the use of TZEEI 14 as a tester should be discontinued.
The efficiency of a heterotic grouping method was measured by its ability to show that vigorous hybrids were products of crosses between parents from different heterotic groups and less vigorous hybrids were products from crosses between inbreds from with- in the same heterotic group. Based on this, values for efficiencies obtained for GGE biplot analysis method (73% under stress environments and 93% under nonstress environments) were far higher than the values reported by Amegbor et al. (2017) under stress (average of 34% and 39.4% for SCA-yield methods and HSGCA methods, respectively) and non- stress environments (34% and 38.9% for SCA-yield methods and HSGCA methods, re- spectively). However, similar trends were obtained in the results as efficiency value under nonstress was greater than that of the stress environments. Although, it was easier to identify heterotic groups based on interaction of testers with the lines using GGE biplot than the conventional line × tester method, the major disadvantage using this method was that, the GGE biplot was able to classify a fewer number of lines than the conventional method. In general, this challenge is a peculiar problem of line × tester method and unfor- tunately in this study, the GGE biplot method could not address it. This result could have invariably rendered many of the newly developed inbreds in WCA useless for hybrid development. However, to a large extent, the use of Ward’s minimum variance cluster analysis for data computed from Heterotic Group’s Specific and General Combining Ability effects (HSGCA) and General Combining Abilities of Multiple Traits (HGCAMT) methods have helped overcome this challenge.
Conclusions
It may be concluded that both additive and non-additive gene actions were significant in this study. However, the additive gene effect was more important than the non-additive for grain yield, so it was possible to classify the inbred lines into heterotic groups by the testers used. The results obtained from the GGE biplot on the combining ability and pat- terns of grouping of the lines were in close correspondence with that of the conventional line × tester method, thus validating the GGE biplot as a veritable statistical tool for eval- uating line × tester data. Moreover, grouping based on the GGE biplot was more efficient under both stress and nonstress environments and the results provided additional informa- tion on the lines and tester performance based on the discriminating power of the testers, which is not readily obtainable in the conventional line × tester analysis. The inbred TZdEEI 34 was identified as outstanding in terms of GCA effect under both stress and nonstress environments. Testers TZEEI 13, TZEEI 21 and TZEEI 29 were found to be very efficient across stress environments based on their discriminating power while test- ers TZEEI 21 and TZEEI 29 were the best across nonstress environments.
Acknowledgement
The authors are grateful for the financial support of the Stress Tolerant Maize for Africa (STMA) project and IITA for this research. We also appreciate the contribution of the staff of the Maize Improvement Program of IITA particularly Dr Abidemi Talabi, Mr Abiodun Adeoti and the technical staff.
References
Akinwale, R.O., Fakorede, M.A.B., Badu-Apraku, B., Oluwaranti, A. 2014. Assessing the usefulness of GGE Biplot as a statistical tool for plant breeders and agronomists. Cereal Res. Comm. 42:534–546.
Amegbor, I.K., Badu-Apraku, B., Annor, B. 2017. Combining ability and heterotic patterns of extra-early maturing white maize inbreds with genes from Zea diploperennis under multiple environments. Euphytica 213:24.
Badu-Apraku, B., Fakorede, M.A.B. 2017. Advances in Genetic Enhancement of Early and Extra-Early Maize for Sub-Saharan Africa. Springer.
Badu-Apraku, B., Oyekunle, M., Akinwale,R.O., Lum, A.F. 2011a. Combining ability and heterotic groups of early-maturing tropical white maize inbred lines under stress and nonstress environments. Agron J.
103:544–557.
Badu-Apraku, B., Lum, A.F., Oyekunle, M., Akinwale, R.O. 2011b. Biplot analysis of diallel crosses of early maturing tropical yellow maize inbreds in stress and nonstress environments. Crop Sci. 51:173–188.
Badu-Apraku, B., Oyekunle, M., Akinwale, R.O., Aderounmu, M. 2013. Combining ability and genetic diver- sity of extra-early white maize inbreds under stress and nonstress environments. Crop Sci. 53:9–26.
Badu-Apraku, B., Annor, B., Oyekunle, M., Akinwale, R.O., Fakorede, M.A.B., Talabi, A.O., Akaogu, I.C., Melaku, G., Fasanmade, Y. 2015. Grouping of early maturing quality protein maize inbreds based on SNP markers and combing ability under multiple stress. Field Crop Res. 183:169–183.
Barata, C., Carena, M. 2006. Classification of North Dakota maize inbred lines into heterotic groups based on molecular and testcross data. Euphytica 151:339–349.
Bertoia, L., Lopez, C., Burak, R. 2006. Biplot analysis of forage combining ability in maize landraces. Crop Sci. 46:1346–1353.
Dehghani, H., Feyzian, E., Jalali, M., Rezai, A., Dane, F. 2012. Use of GGE biplot methodology for genetic analysis of yield and related traits in melon (Cucumis melo L.) Can. J. Plant Sci. 92:77–85.
Fan, X.M., Zhang, Y.M., Yao, W.H., Chen, H.M., Tan, J.C.X., Xu, X.L., Han, L.M., Luo, Kang, M.S. 2009.
Classifying maize inbred lines into heterotic groups using a factorial mating design. Agron J. 101:106–112.
Hamoud, H.M.E. 2014. Use of biplot approach for genetic analysis of yield and related traits in cotton (Gossypium barbadense). J. Plant Breed. Crop Sci. 6:41–47.
SAS Institute Inc. 2011. Base SAS® 9.3 Procedures Guide. Cary, NC: SAS Institute Inc.
Yan, W., Hunt, L.A. 2002. Biplot analysis of diallel data. Crop Sci. 42:21–30.
Yan, W., Fregeau-Reid, J., Pageau, D., Martin, R., Mitchell-Fetch, J., Etienne, M., Rowsell, J., Scott, P., Price, M., de Haan, B., Cummiskey, A., Lajeunesse, J., Durand, J., Sparry, E. 2010. Identifying essential test loca- tions for oat breeding in Eastern Canada. Crop Sci. 50:505–515.