COMPARISON OF THE RESPONSES TO NaCl STRESS OF THREE TOMATO INTROGRESSION LINES
Fedia Rebah,1,2 Chayma Ouhibi,1 * K. H. Alamer,3 Najoua Msilini,1 Mouhiba Ben Nasri,1 Rebecca Stevens2 and Houneida Attia1,3
1Unité de Physiologie et Biochimie de la Réponse des Plantes aux Contraintes Abiotiques, Département de Biologie, Faculté des Sciences de Tunis, Université Tunis El Manar,
1068 Tunis, Tunisie
2INRA, UR1052, Génétique et Amélioration des Fruits et Légumes, F-84143 Montfavet, France
3Biology Department, Faculty of Science, Taif University, Kingdom of Saudi Arabia (Received: April 19, 2018; accepted: July 5, 2018)
We aimed to examine the response of three tomato introgression lines (IL925.3, IL925.5 and IL925.6) to NaCl stress. These lines originated from a cross between M82 (Solanum lycopersicum) and the wild salt- tolerant tomato Solanum pennellii, each line containing a different fragment of the S.pennellii genome.
Salt-sensitive phenotypes related to plant growth and physiology, and the response of antioxidants, pig- ments and antioxidant enzymes were measured. In general, salt stress decreased the fresh weight of leaves, leaf area and leaf number and an increase of Na+ accumulation in aerial parts was observed, which caused a reduction in the absorption of K+ and Ca2+. Salt stress also induced a decrease in chlorophyll, carotenoids and lipid peroxidation (MDA) and an increase in anthocyanins and reduced ascorbate, although some differences were seen between the lines, for example for carotenoid levels. Guaiacol per- oxidase, catalase and glutathione reductase activity enhanced in aerial parts of the lines, but again some differences were seen between the three lines. It is concluded that IL925.5 might be the most sensitive line to salt stress as its dry weight loss was the greatest in response to salt and this line showed the high- est Na+ ion accumulation in leaves.
Keywords: Antioxidant enzymes – ascorbate – introgression lines – salinity – tomatoes – variability
INTRODUCTION
Tomato has an important place in the human diet since it is consumed throughout the year and worldwide. It is therefore important for plant breeders. According to Sharifova et al. [60] the cultivated tomato (Solanum lycopersicum L.) is economi- cally one of the most important plants grown in the Solanaceae family. The species of cultivated tomato has been widely studied in terms of genetics, genomics and reproduction [24]. A large phenotypic variability of tomato exists, for example fruits vary widely in shape and size [10, 29]. The diversity of wild tomato has been enriched by a wide range of ecological conditions that the species grows under. This wide variation was also seen at morphological, physiological, sexual and molecular levels [49]. Currently, more than 83,000 tomato accessions are stored in seed banks around
* Corresponding author; e-mail address: chayma.ouhibi@gmail.com
the world, which makes tomato the highest ranked vegetable species collected (FAO, 2010). Also included among selection criteria, was the improved content of beneficial components for health such as antioxidants (lycopene, vitamin C). This can be achieved through specific mutations such as hp [37] or with the introgression of genes from wild relatives. In order to obtain lines adapted to unfavorable conditions with better quality and better resistance to pathogens, efforts have been made to select new varieties of tomato and a range of varieties has been created using conventional selec- tion methods. In this context the work of Eshed and Zamir [20] was of interest as they created a population of introgression lines using M82 (Solanum lycopersicum) crossed with Solanum pennellii. The wild species (S. pennellii) was a source of genetic variability for many characters, and was used to introgress regions into the genome of the cultivated species, thereby obtaining a population of introgression lines (ILs) containing a small fragment of the wild species in the genetic background of M82 [22]. The objectives included improving plant resistance to biotic and abiotic stresses.
Salinity is a major environmental stress and the major limitation on agricultural production [67]. According to Bolarin et al. [11], tomato is moderately sensitive to salt stress at all stages of development (germination, yield, vegetative growth and reproduction). Tolerance of tomato to salinity is a multigenic trait [23]. However Solanum pennellii is more tolerant to salt stress and maintains dry weight and yield [57, 64, 65]. Plants respond to salt stress by physiological, biochemical and genetic responses [69]. Saeed et al. [55] studied the variability in the response to salt in nine tomato accessions: root elongation data showed six accessions (LA2661, CLN2498A, CLN1621L, BL1176, 6233 and 17870) that were considered tolerant to salinity and three others (17902, LO2875 and LO4360) as being non-tolerant to salinity. The study of the ionic status showed that six tomato accessions considered tolerant had Na+ exclusion capacity. In response to abiotic stress the plant produces enzymatic and non-enzymatic antioxidant molecules in order to repair oxidative damage and remove damaged molecules. Following exposure to salt stress S. pennellii has better foliar and root enzymatic antioxidant activity compared to L. esculentum [39, 40]. Frary et al. [26], showed that, under salt stress, the wild species S. pennellii revealed greater induction of all antioxidants except peroxidase. The S. pennellii introgression lines (IL) showed diverse responses to salinity and proved very useful for the identification of QTL. These results show that the antioxidant profiles, salt-induced antioxidant responses and growth responses of S. lycopersicum, S. pennellii and the ILs were complex. Although it was generally observed that salt stress resulted in higher levels of antioxidant compounds and enzymes in the wild species, a direct correlation between antioxidant levels and salinity tolerance was more difficult to prove [26].
The aim of this work was to make a comparative study of the variability of three tomato introgression lines that were genetically different, each carrying a different fragment of the chromosome 9 of S. pennellii in the genetic background of S. lyco- persicum M82 [27]. This region has previously been associated with improved response to stress and increased antioxidant content [61, 63, 26].
MATERIAL AND METHODS Plant material and culture conditions
Three tomato introgression lines (IL925.3, IL925.5 and IL925.6) [21] were first sterilized in 10% (v/v) H2O2 for 20 min, then thoroughly washed with distilled water and germinated on moistened filter paper at 25 °C in the dark for 8 days. Uniform seedlings were transferred to pots containing 1 L of aerated, four-fold diluted nutritive solution of Hoagland and Arnon [31], with one plant per pot. The solution contained 0.25 mM MgSO4, 0.125 mM KH2PO4, 0.625 mM Ca(NO3)2, 0.625 mM KNO3, 0.5 µM MnSO4, 0.25 µM ZnSO4, 5 µM H3BO3, 0.025 µM (NH4)Mo7O24, and 1.5 µM FeEDTA. It was renewed weekly. The photoperiod was 16 h with 150 mol m–2 s–1 PAR at the plant level. The day/night temperature and relative humidity regimes were 22/18 °C and 60/80%, respectively.
Plant morphology, growth and ion accumulation
At 32 days of age, the tomato plants of the three lines were divided into 2 batches:
the first one was the control and for the second one 100 mM NaCl was added to the nutrient solution. Eight days later, five plants per treatment were harvested (final harvest). Fresh weights (FW) were determined immediately. The morphological parameters were also determined (number of leaves, stem length), leaf areas were measured on each plant using a scanner and Optimas® software. The samples were then oven-dried for 48 h at 70 °C to determine the dry weight. Specific leaf area (SLA), degree of succulence and degree of sclerophylly were also determined and were calculated as follows:
SLA = leaf area/dry mass [9].
Degree of succulence = water mass/leaf area [15].
Degree of sclerophylly = dry mass/leaf area. [68]
Ions Na+, K+ and Ca2+ were extracted from 25 mg samples of dried tissues with 0.5% HNO3 for 48 h, filtered, and assayed by flame photometry (Eppendorf) using butane-air flame for K+ and Na+, and acetylene-air flame for Ca2+.
Chlorophyll and carotenoid contents
For each treatment, five plants were used and individually treated. Young fresh leaves (fifth leaf stage) of each plant were separately incubated in the dark for 72 h at 4 °C in acetone 80% (v/v). Absorbance of each of the acetone extracts was measured at 470, 646, and 663 nm with a DU 640 Beckman spectrophotometer. Concentrations of chlorophyll a, chlorophyll b, total chlorophylls, and total carotenoids were calculated using the equations proposed by Lichtenthaler [36].
Leaf anthocyanin concentration
Anthocyanin concentrations in leaves were determined according to the method of Murray and Hackett [43]. Leaf discs were excised and placed in HCl, H2O, MeOH (1v, 3v, 16v) for 72 hours at 4 °C. Anthocyanin concentrations were measured at 530 and 653 nm.
Lipid peroxidation
Lipid peroxidation was determined using the thiobarbituric acid (TBA) reaction to measure the tissue content in MDA [70]. The extraction of MDA was performed by grinding 0.3 g of tissue with 3 mL of cold 0.1% trichloroacetic acid (TCA). The homogenate was then centrifuged at 10 000 g for 15 min at 4 °C. The MDA content was measured according to the method of Heath and Packer [30]. A 2 mL aliquot of the supernatant was added to 2 mL of 0.5% 2-thiobarbituric acid (TBA) in 20% TCA.
The mixture was heated at 95 °C for 30 min, cooled in an ice bath and centrifuged at 10,000 g for 15 min. Absorbance of the supernatant at 532 nm was corrected for non- specific absorbance by subtracting the absorbance at 600 nm, and the MDA concen- tration was estimated using 155/mM/cm as the extinction coefficient. Five different plants were used as replicates.
Protein extraction and enzymatic assays
Fresh powder (0.5 g) was extracted by adding 50 mM potassium phosphate buffer (pH 7), 5% Polyvinylpyrrolidone, 5% glycerol, 1 mM dithiothreitol and 1 mM EDTA. The homogenate was centrifuged at 13,000 g at 4 °C for 20 min. The soluble protein content was determined according to the method of Bradford [12], using the Bio-Rad protein assay reagent (Bio-Rad, Foster City, CA) and bovine serum albumin as a standard.
The guaiacol peroxidase (GPX), catalase (CAT) and glutathione reductase GR assays were measured using the same extraction procedure. For 0.5 g of aerial parts, 1 mL of phosphate buffer (50 mM, pH 7.5), which contained 5% polyvinylpolypyr- rolidone (PVPP), 5% glycerol, 1 mM DTT and 1 mM EDTA was used as the extrac- tion buffer. The solution was then centrifuged at 13,000 g for 20 min at 4 °C.
For the measurement of guaiacol peroxidase (GPX) activity, the reaction mixture contained 50 mM phosphate buffer (pH 7), 9 mM guaiacol, 12 mM H2O2, and 60 µL of supernatant. GPX activity was determined by the increase in absorbance at 470 nm due to guaiacol oxidation (extinction coefficient = 26.6 mM–1 cm–1) [44].
The CAT activity was estimated according to the method of Chance and Maehly [13]. The reaction mixture consisted of 40 µL of enzyme extract, 25 mM phosphate buffer (pH 7) and 30 mM H2O2. The depletion of H2O2 was determined by measuring the change in the absorbance at 240 nm using a UV-visible spectrophotometer. One
unit of CAT was defined as the amount of enzyme needed to reduce 1 mol H2O2 in 1 min. The specific activity was expressed as units per gram of fresh weight.
The glutathione reductase (GR) activity was determined by following the oxida- tion of NADPH at 340 nm (extinction coefficient 6.2 mM cm–1) as described by Rao [52] One mL assay mixture contained 100 mM potassium phosphate buffer (pH 7.8), 2 mM EDTA, 0.2 mM NADPH, 0.5 mM GSSG, and the leaf extract. The assays were initiated by the addition of NADPH at 25 °C. Corrections were made for any GSSG oxidation in the absence of NADPH.
Ascorbic acid
The ascorbic acid contents were measured according to the method described by Stevens et al. [62]. One g (1 g) of powder was homogenized with 600 mL of ice-cold 6% trichloroacetic acid (TCA). Samples were centrifuged for 15 min at 25,000 g at 4 °C. Twenty µL (20 µL) of the supernatant was used in each assay. Two assays were carried out on each sample, one to measure the total ascorbate, including the addition of 5 mM dithiothreitol (DTT), and one to quantify the reduced ascorbate form and this by using 0.4 mM phosphate buffer (pH 7.4) (omission of DTT from the assay).
The samples were incubated at 37 °C for 20 min. Thereafter N-ethyl malemide was added for measuring total ascorbate, or 0.4 mM phosphate buffer (pH 7.4) to measure reduced ascorbate. Once added and mixed we followed the reaction of the color rea- gent which contains 85% orthophosphoric acid (H3PO4), 4.6% TCA, 0.6% Ferric chloride (FeCl3), 2.4% dipyridyl in 70% ethanol. After incubation at 37 °C for 40 min, the absorbance was read at 550 nm.
Statistical analysis
All data were initially analyzed to check if they followed a normal distribution using the Tukey and Fisher test, then two-way ANOVA were carried out using XlStat.
Means (± standard error) were separated and ranked using the Fisher post hoc test (P = 0.05).
RESULTS
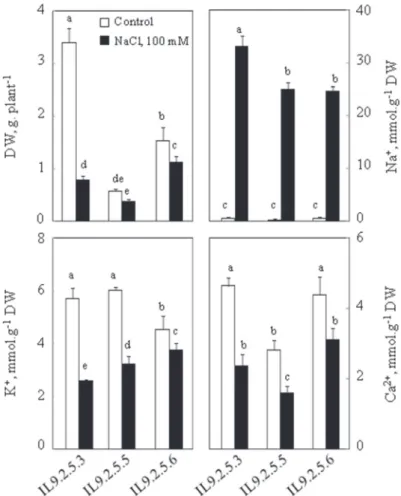
For this study we chose to work on the aerial part of the plant. Salt stress negatively affected all of the growth parameters measured in aerial parts in the three introgres- sion lines of tomato, but in a different way from one line to another. Analysis of variability revealed significant differences in dry weights of the different introgres- sion lines of tomato. Dry weight was strongly affected by salinity treatments (Fig. 1), in whole plants it was significantly lower under salinity. Indeed, the reduction was 77%, 36% and 26% in IL925.3, IL925.5 and IL925.6, respectively. Under control
conditions, the difference between the three lines for the number of leaves was only significant for IL925.5 which has a lower number of leaves than the other two lines.
Under saline conditions, IL925.3 presents a number of leaves similar to IL925.5 under control conditions. Plant leaf number was reduced by 20%, 21% and 35%
respectively in IL925.3, IL925.5 and IL925.6 under salinity (Table 1). For stem length, Table 1 shows that IL925.5 has the shortest length relative to the other lines under control conditions. This parameter was affected by salinity treatments; the reduction was respectively by 30%, 18% and 20% in IL925.3, IL925.5 and IL925.6, but the difference between the three lines was not significant (Table 1). In the absence of NaCl in the medium, IL925.3 has the highest leaf area followed by IL925.6;
IL925.5 presents the lowest leaf area compared to the other two lines. The salt treat- ment decreased the total leaf surface area by 64%, 22% and 40%, respectively, in IL925.3, IL925.5 and IL925.6. However, the leaf expansion of IL925.5 was not greatly affected by the presence of NaCl as compared to the other lines (Table 1).
Under control conditions leaf thickness in IL925.5 was significantly higher than in IL925.3 and IL925.6, and following treatment with 100 mM NaCl, increased leaf thickness was noted in also three lines but it was statistically more pronounced in IL925. The degree of leaf sclerophylly in control conditions was highest in IL925.3.
Salt treatment results in regression of the leaf sclerophylly except for IL925.6 where salinity causes a significant increase compared to the control. The degree of succu- lence was higher in control conditions for IL925.5, followed by IL925.6 and finally IL925.3, while under salt conditions a significant increase was observed in both lines IL925.3 and IL925.6 except for IL925.5 where there was no significant difference between the two conditions. In plants grown in saline condition, the lines IL925.5 and IL925.6 presented the lowest foliar concentrations of Na+, while IL925.3 registered
Table 1
Morphology parameters: stem length, leaf number, number of stem shoots, total leaf area and individual leaf area of tomato. Thirty two-days-old plants grown in nutritive solution, at this age 100 mM NaCl was added to the nutrient solution (S). Control plants (C) had no salt added. Plants were harvested after 8 days.
Mean of five plants and confidence interval for P = 0.05. Mean values with the same letter in each panel were not significantly different at P = 0.05 (ANOVA and mean comparison with fisher post hoc test)
Parameters IL9.2.5.3 IL9.2.5.5 IL9.2.5.6
C S C S C S
Stem length, cm 27±1a 19±0cd 22±1b 18±1d 25±1a 20±1bc
Leaf number 30±1a 24±1b 24±1b 19±1c 29±2a 19±1c
Number of stem shoots 7±0ab 6±0bc 6±1bc 5±1c 8±1a 5±1c
Total leaf area, cm2 plant–1 22±3a 8±0cd 9±1c 7±1d 15±2b 9±1cd Individual leaf area, cm2
leave–1 3.1±0.4a 1.4±0.1d 1.5±0.1cd 1.3±0d 1.9±0.1b 1.7±0.2bc Leaf thickness, cm 0.2±0e 0.9±0.1bc 1.1±0.1b 1.8±0.1a 0.4±0.1d 0.7±0.1c Leaf sclerophylly, mg cm–2 155±6a 97±6c 65±5d 54±5e 104±5c 126±4b Leaf succulence, mg cm–2 511±56c 744±9ab 649±51b 661±89b 630±40bc 836±63a
the highest concentrations (33 mmol ∙ g–1 MS). K+ concentrations in leaves were sig- nificantly different in IL925.6 which presented the lowest concentration of K+ in control conditions. Under salt treatment, K+ was reduced in the three lines but the most dramatic regression has been observed in IL925.3 and IL925.5. Indeed, the reductions were 54% and 50%, respectively in IL925.3 and IL925.5. However, the accumulation of K+ in IL925.6 decreased by 17%. Under salinity, there was a decrease in the accumulation of Ca2+: by 49%, 43%, and 29%, respectively in IL925.3, IL925.5 and IL925.6 (Fig. 1).
Under control conditions total chlorophyll content was similar in IL925.3 and IL925.5 while IL925.6 has a lower content. Total chlorophylls were affected by salt
Fig. 1. Dry weights (DW), Na+, K+ and Ca2+ contents of aerial parts of plants. Thirty two-day-old plants grown in nutritive solution, at this age 100 mM NaCl was added to the nutrient solution (S). Control plants (C) had no salt added. Plants were harvested after 8 days. Mean of five plants per treatment and confidence interval for P = 0.05. Mean values with the same letter in each panel were not significantly
different at P = 0.05 (ANOVA and mean comparison with Tukey and Fisher test)
in the three introgression lines (Table 2). The total chlorophyll content of leaves was reduced in saline conditions. The reduction was more pronounced in IL925.5 and IL925.6 compared to IL925.3. Indeed the reduction was by 37%, 83% and 85% in IL925.3, IL925.5 and IL925.6, respectively. Concerning carotenoid content, the IL925.5 line had the highest values and IL925.3 line the lowest under control condi- tions. However, in the presence of NaCl treatment, IL925.3 had the highest carote- noid content. Under salinity, the carotenoid content in the three lines was affected.
Indeed, we noted an increase in this pigment by 46% in IL925.3, in contrast to what was noted in IL925.6 and IL925.5. In fact, under salinity, we recorded a decrease in the content of carotenoids by 85% in IL925.5 and IL925.6 (Table 2). IL925.3 and IL925.5 lines have a similar level of anthocyanins under control conditions while IL925.6 was the line that presents a significant difference. Under salinity conditions, the anthocyanin concentration was affected. Indeed, we have noted an increase in IL925.3 and IL925.6 (16 and 62%), while this content decreased in IL925.5 (40%) (Table 2).
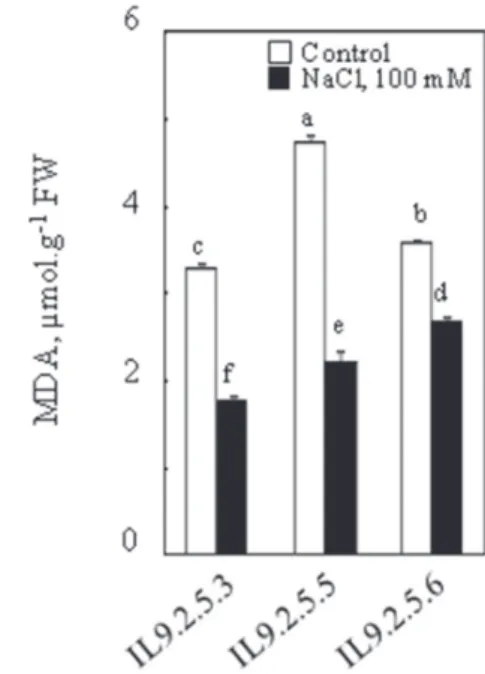
The malondialdehyde (MDA), which is a degradation product of lipid peroxida- tion, has shown a decline in the three introgression lines in the presence of 100 mM NaCl. Indeed, we noted a significant reduction in MDA by 46%, 56% and 26%, respectively, in IL925.3, IL925.5 and IL925.6 (Fig. 2).
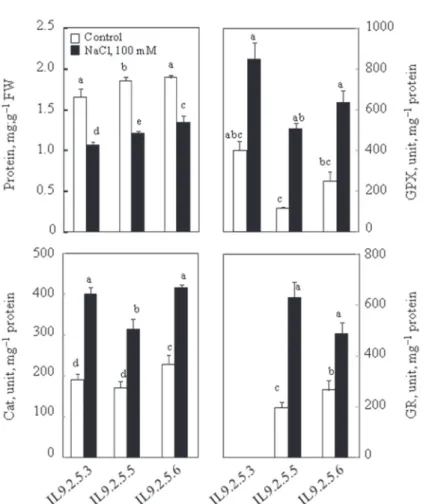
Under control conditions the amount of soluble proteins was almost similar and significantly different to IL925.6. In the presence of 100 mM NaCl, a decreased amount of proteins was observed in the three subILs, this decrease was of the order of 35% in IL925.3 and IL925.5, while it was around 29% only in IL925.6 (Fig. 3).
The enzyme systems studied in this work were, guaiacol peroxidase (GPX), catalase (CAT) and an enzyme belonging to ascorbate-glutathione cycle, glutathione reduc- tase (GR). IL925.5 presented low GPX activity under control conditions, while IL925.3 exhibits the highest activity under both conditions (Fig. 3). Under control conditions, IL 925.3 shows much higher GPX activity compared to IL925.5 and
Table 2
Contents of chlorophylls a, b, total chlorophylls, carotenoids and anthocyanins in the leaves of tomatoes were measured. Thirty two-day-old plants grown in nutritive solution, at this age 100 mM NaCl was added to the nutrient solution (S). Control plants (C) had no salt added. Plants were harvested after 8 days.
Mean of five plants and confidence interval for P = 0.05. Mean values with the same letter in each panel were not significantly different at P = 0.05 (ANOVA and mean comparison with fisher post hoc test)
Pigment, mg ∙ g–1 FW IL9.2.5.3 IL9.2.5.5 IL9.2.5.6
C S C S C S
Chl a 2.1±0.2b 1.8±0.2c 3.0±0.2a 0.5±0d 2.2±0.3b 0.4±0.1d
Chl b 2.0±0.1a 0.8±0.1c 1.1±0.1b 0.2±0d 1.2±0.2b 0.1±0d
Chl tot 4.1±0.2a 2.6±0.2c 4.1±0.2a 0.7±0.2d 3.3±0.3b 0.5±0.1d
Car. 0.1d 0.3c 0.6a 0.1d 0.5b 0.1d
Anth 0.011bc 0.013ab 0.010c 0.006d 0.005d 0.014a
IL925.6: this difference was about 4 times more, compared to IL925.5, and twice more than IL925.6. GPX was significantly increased in the presence of 100 mM NaCl in the three lines in comparison with the control treatment. Similarly to GPX activity, salt stimulates the activity of CAT compared to the control in the three lines, the percentage increase of catalase activity was 52%, 46% and 45%, respectively, for IL925.3, IL925.5 and IL925.6. Under control conditions, the CAT activity was sig- nificantly higher in IL925.6, compared to IL925.3 and IL925.5. Under saline condi- tions, IL925.3 and IL925.6 have the highest activity and the difference between them was not significant, while the difference was significant compared to IL925.5 (Fig.
3). Under the control conditions, IL925.6 has higher GR activity, compared to IL925.5. Salt treatments activate GR activity. Indeed, we noted an increase in their enzymatic activity by 69% and 46%, respectively in IL925.5 and IL925.6 but this difference was not significant between this two lines. (Activity not determined for IL925.3) (Fig. 3).
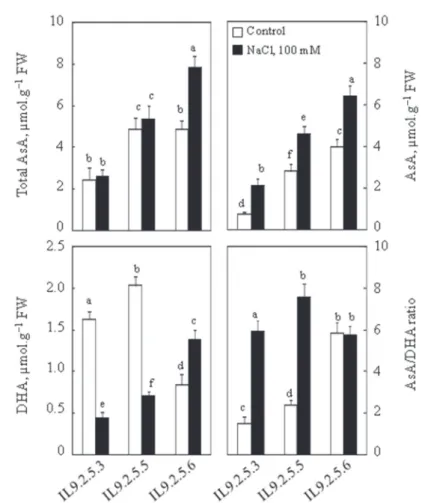
Total ascorbate level (AsA) was only significantly different in the presence of 100 mM NaCl in the sub ILs 925.6 where saline treatment caused an increase in the total ascorbate contrast of 38% (Fig. 4). Under control conditions, the total ascorbate con- centration was almost the same for both sub ILs (IL925.5 and IL925.6). In contrast,
Fig. 2. Malondehyaldehyde content in aerial parts of plants. Thirty two-day-old plants grown in nutritive solution, at this age 100 mM NaCl was added to the nutrient solution (S). Control plants (C) had no salt added. Plants were harvested after 8 days. Mean of five plants per treatment and confidence interval for P = 0.05. Mean values with the same letter in each panel were not significantly different at P = 0.05
(ANOVA and mean comparison with Tukey and Fisher test)
IL925.3 was much less rich in ascorbate (almost half of the other two subILs). Saline treatment caused a significant increase in reduced ascorbate in these three subILs: this increase was 62%, 39% and 38%, respectively, for IL925.3, IL925.5 and IL925.6.
The variability in the changes in reduced ascorbate in the sub ILs was very clear:
IL925.6 had the highest reduced ascorbate levels (Fig. 4). Dehydroascorbate (DHA) showed a significant increase (39%) in IL925.6 following treatment of plants with 100 mM NaCl whereas in IL925.3 and IL925.5, DHA decreases with saline treat- ment, this decrease was respectively 73% and 65% less than the control.
Fig. 3. Total proteins soluble content and enzymatic activity of guaiacol peroxydase (GPX), catalase (CAT) and glutathione reductase (GR) assays in aerial parts of plants. Thirty two-day-old plants grown in nutritive solution, at this age 100 mM NaCl was added to the nutrient solution (S). Control plants (C) had no salt added. Plants were harvested after 8 days. Mean of five plants per treatment and confidence inter- val for P = 0.05. Mean values with the same letter in each panel were not significantly different at
P = 0.05 (ANOVA and mean comparison with Tukey and Fisher test)
DISCUSSION
Several previous studies have shown the variability of salt tolerance in tomato [2, 66].
Plant biomass and yield can be considered as stress tolerance markers [58]. A reduced dry leaf weight of 30%, and of 50% in the stems of tomato was observed by Cuartero et al. [14] following saline treatment. In our work, the lowest leaf biomass was found in IL925.5, which defines this line is the most sensitive to salt stress. Similar results were demonstrated also by Juan et al. [32] in the cultivar Royesta.
Fig. 4. Total ascorbate, ascorbate reduced and dehydroascorbate contents. Thirty two-day-old plants grown in nutritive solution, at this age 100 mM NaCl was added to the nutrient solution (S). Control plants (C) had no salt added. Plants were harvested after 8 days. Mean of five plants per treatment and confidence interval for P = 0.05. Mean values with the same letter in each panel were not significantly
different at P = 0.05 (ANOVA and mean comparison with Tukey and Fisher test)
Salt stress induces a decline in growth parameters in the lines studied: it has been proven that the answer to salinity differs depending on the concentration of salt and tomato variety used [2]. Generally, the leaf numbers of lines was affected by NaCl treatment. This observation was also confirmed by Munns and Termaat [41]. Indeed, they showed that salinity causes a reduction in plant growth associated with a decline in leaf area, which led to the death of the tissues, organs and whole plant at high concentrations. The leaf area reduction under salinity also affected photosynthesis [42]. Reduction of shoot number and root and stem elongation has also been demon- strated by several authors in tomato [50, 71]. These reductions were also observed by Oztekin and Tuzel [45] in 33 different tomato genotypes. The excessive accumulation of Na+ and Cl− in the leaves was one of the harmful effects of salinity on plant growth [5]. IL925.5 and IL925.6 presented the lowest foliar concentrations in Na+ while in IL925.3 we registered the highest concentrations. Plants grown under salt stress accu- mulate Na+, resulting in a specific ionic imbalance and the appearance of symptoms of nutrient deficiency [32]. The increase in Na+ concentration causes a decrease in K+, Ca2+, Mg2+ which inhibits growth [58]. The potassium content decreased in the three lines under salt stress, this has been also observed in tomato by Frary et al. [25]. Salt stress causes a potassium deficiency in plants, which can be explained by the compe- tition between Na+ and K+ for the same transport system at the root surface [8, 54].
Salt stress causes a decrease in leaf concentration of calcium in the three lines; this was explained by the competition between sodium and calcium through non-selective cation channels [8, 16]. When the accumulation of Na+ in the plant increases its effect becomes increasingly toxic at various physiological levels. This toxicity includes not only the nutritional disturbance (K+ and Ca2+), but also the development of water stress and the induction of oxidative cell damage [3, 6].
The decrease in chlorophyll and carotenoids under conditions of salinity was a major marker of salt tolerance; this has been demonstrated by Sairam et al. [56].
Chlorophyll content decreased in three lines at 100 mM NaCl treatment. Eryilmaz [19] also observed a decrease of 60% in chlorophyll content in tomato after 7 days of treatment with 100 mM NaCl. The anthocyanin pigment content increased with saline treatment in the two lines IL925.3 and IL925.6, and this increase was significant for IL925.6. Similar result was also demonstrated by Rajamane and Gaikwad [51].
Eryilmaz [19] showed that the anthocyanin pigment content increased under treat- ment with 100 mM NaCl, this content has been increased by 73% in cotyledons and 51% in tomato hypocotyls. Based on the results obtained, anthocyanin production seems positively correlated with the saline treatment in the aerial part of the tomato.
The anthocyanin pigments increased significantly with salt stress [33].
In our study, we noted a decrease in lipid peroxidation in the three introgression lines under salinity but the line IL925.5 seems to be the most affected by NaCl. This decrease in lipid peroxidation was seen in barley by Liang [35]. This was consistent with the results obtained by Ozturk et al. [46] in leaves of pea, and also in peanut (Arachis hypogaea L.) by Parida and Das [48]. Increased peroxidase activity accom- panied by a decrease in the content of MDA under saline conditions suggests that
peroxidases were involved in the integrity of the cell membranes [48]. The lower level of MDA under salt stress was the result of the high activities of antioxidant enzymes (SOD and peroxidase); this was observed by Shalata and Tal [59] in wild tomato species tolerant to salt, in wheat [18], pea [46] and cotton [17]. Similarly, a low level of MDA accompanied by high SOD activity and peroxidases under salt stress in cotton [38] and senna ‘Cassia angustifolia Vahl’ [1]. In Grevia ilicifolia, MDA levels decreased significantly after exposure to salt stress, and in parallel there was a significant increase in protease, catalase, polyphenol oxidase, SOD and lipoxy- genase activities [33]. Plants have developed a powerful antioxidant system that protects against damage caused by oxidative stress. These defense barriers consist of two types: enzymatic and non-enzymatic thus protecting plant cells from oxidative damage by scavenging ROS [28]. Rodríguez-Rosales et al. [53] observed an increase in the activity of lipoxygenase and antioxidant enzymes such as SOD, catalase, ascor- bate peroxidase, glutathione reductase, and glutathione-S-transferase in tomato under saline treatment. In our work, the activity of guaiacol peroxidase was stimulated under salinity, in the three lines of tomato. Several authors observed a simultaneous increase in this activity in leaves and roots of Vigna radiate [47], of Oryza sativa [34].
In other studies, the authors noted an increase in total peroxidase activity under saline conditions. Salt induces increases in enzymatic antioxidants, which could give the tomato lines a high capacity for scavenging ROS generated by salt stress. These results were also observed by Ozturk et al. in pea [46]. A synthesis study conducted by Parida and Das [48] showed an increase of H2O2 and MDA in the chloroplasts of L. esculentum treated with salt. However, S. pennellii shows a decrease of these indi- cators under the same conditions. The response of L. esculentum and S. pennellii was in positive correlation with the activities of antioxidant enzymes in the chloroplasts.
IL925.6 was richer in ascorbate than the two others subILs (IL925.3 and IL925.5), this was explained by the presence of 2 separate QTL which contribute to the increase in the total ascorbate [63]. The content of reduced ascorbate was higher in the pres- ence of salt for the three subILs and this can be explained by the presence of a QTL which varies under the effect of the environment [61].
The salinity of the nutrient solution creates a disturbance of the nutritional status, which has caused a disruption of plant growth of the introgression lines except for the IL925.6 line which was the least sensitive to the stress, probably due to its improved compartmentalization of sodium and a better absorption of K+ and Ca2+. The salt stress induced an enzymatic and non-enzymatic antioxidant response (GPX, CAT and GR and ascorbate) in three tomato lines. Indeed, in our study, we have also shown that the response of the three tomato lines to salt stress by enzymatic anti- oxidants was similar to the response of S. pennellii [64], this resemblance could be explained by the presence of a S. pennellii region in the genetic background of L.
esculentum.
REFERENCES
1. Agarwal, S., Pandey, V. (2004) Antioxidant enzyme responses to NaCl stress in Cassia angustifolia.
Biol. Plant. 48, 555–560.
2. Akinci, S., Yilmaz, K., Akinci, I. E. (2004) Response of tomato (Lycopersicon esculentum Mill.) to salinity in the early growth stages for agricultural cultivation in saline environments. J. Environ. Biol.
25, 351–357.
3. Aktas, H., Abak, K., Cakmak, I. (2006) Genotypic variation in the response of pepper to salinity. Sci.
Hortic. 10, 260–266.
4. Alfocea, P. F., Estañ, M. T., Caro, M., Guerrier, G. (1993) Osmotic adjustment in Lycopersicon esculentum and L. Pennellii under NaCl and polyethylene glycol 6000 iso-osmotic stresses. Physiol.
Plant 87, 493–498.
5. Ashraf, M., Harris, P. J. C. (2004) Potential biochemical indicators of salinity tolerance in plants.
Plant. Sci. 116, 3–16.
6. Attia, H., Nouaili, S., Soltani, A., Lachaâl, M. (2009) Comparison of the responses to NaCl stress of two pea cultivars using split-root system. Sci. Hort. 123, 164–169.
7. Attia, H., Karraya, N., Rabhi, M., Lachaâl, M. (2008) Salt-imposed restrictions on the uptake of macro elements by roots of Arabidopsis thaliana. Act. Physiol. Plant. 30, 723–727.
8. Attia, H., Arnaud, N., Karraya, N., Lachaâl, M. (2008) Long-term effects of mild salt stress on growth, ion accumulation and superoxide dismutase expression of Arabidopsis rosette leaves. Physiol. Plant.
132, 293–305.
9. Beadle, C. L. (1993) Growth analysis. 36–46. In: Hall, D. C., Scurlock, J. M. O., Bolhar- Nordenkampf, H. R., Leegod, R. C. Long, S. P. (eds) Photosynthesis and production in a changing environment, A field and laboratory manual, London.
10. Bhardwaj, N. V., Sharma, M. K. (2005) Genetic parameters and character association in tomato.
Bangladesh. J. Agric. Res. 30, 49–56.
11. Bolarin, M. C., Perez-Alfocea, F., Cano, E. A., Estan, M. T., Caro, M. (1993) Growth, fruit yield, and ion concentration in tomato genotypes after pre-emergence and post-emergence salt treatments. J. Am.
Soc. Hortic. Sci. 118, 655–660.
12. Bradford, M. M. (1976) A rapid and sensitive method for the quantitation of microgram quantities of protein utilizing the principle of protein-dye binding. Anal. Biochem. 72, 248–254.
13. Chance, B., Maehly, S. K. (1955) Assay of catalase and peroxidases. Meth. Enzymol. 2, 764–775.
14. Cuartero, J., Boların, M. C., Asıns, M. J., Moreno, V. (2006) Increasing salt tolerance in the tomato.
J. Exp. Bot. 5, 1045–1058.
15. Delf, E. M. (1912) Transpiration in succulent plants. Ann. Bot. 26, 409–440.
16. Demidchik, V., Maathuis, F. J. M. (2007) Physiological roles of non selective cation channels in plants: from salt stress to signaling and development. New Phytol. 175, 387–404.
17. Ding, M., Hou, P., Shen, X., Wang, M., Deng, S., Sun, J., Xiao, F., Wang, R., Zhou, X., Lu, C., Zhang, D., Zheng, X., Hu, Z., Chen, S. (2010) Salt-induced expression of genes related to Na+/K+ and ROS homeostasis in leaves of salt-resistant and salt-sensitive poplar species. Plant. Mol. Biol. 73, 251–269.
18. Dionisio-Sese, M. L., Tolbita, S. (1999) Antioxidative responses of shoots and roots of wheat increasing NaCl concentration. J. Plant. Physiol. 155, 274–280.
19. Eryılmaz, F. (2006) The relationships between salt stress and anthocyanin content in higher plants.
Biotechnol. Biotechnol. Equip. 20, 47–52.
20. Eshed, Y., Zamir, D. (1995) The introgression-line (IL) population of S. pennellii in a processing- tomato variety (M82) is an efficient tool for identification and mapping of QTL. Genetics 141, 1147–1162.
21. Eshed, Y., Zamir, D. (1994) A genomic library of Lycopersicon pennellii in L. esculentum: A tool for fine mapping of genes. Euphytica 79, 175–179.
22. Eshed, Y., Gera, G., Zamir, D. (1996) A genome-wide search for wild-species alleles that increase horticultural yield of processing tomatoes. 3, 877–886.
23. Foolad, M. R. (2004) Recent advances in genetics of salt tolerance in tomato. Plant Cell. Tissue.
Organ. Cult. 76, 101–119.
24. Foolad, M. R. (2007) Genome mapping and molecular breeding of tomato. Int. J. Plant Genomics 2007, 52. pp.
25. Frary, A., Keles, D., Pinar, H., Gol, D., Doganlar, S. (2011) NaCl tolerance in Lycopersicon pennellii introgression lines:QTL related to physiological responses. Biol. Plant 55, 461–468.
26. Frary, A., Göl, D., Keleş, D., Ökmen, B., Pınar, H., Şığva, Ö. H., Yemenicioğlu, A., Doğanlar, S.
(2010) Salt tolerance in Solanum pennellii: antioxidant response and related QTL. BMC Plant. Biol.
10, 58. pp.
27. Fridman, E., Liu, Y. S., Carmel-Goren, L., Gur, A., Shoresh, M., Pleban, T., Eshed, Y., Zamir, D.
(2002) Two tightly linked QTLs modify tomato sugar content via different physiological pathways.
Mol. Genet. Genomics 266, 821–826.
28. Gomez-Mestre, I., Alexander, P. R., Wiens, J. J. (2012) Phylogenetic analyses reveal unexpected patterns in the evolution of reproductive modes in frogs. Evolution 66, 1558–5646.
29. Haydar, A., Mandal, M. A., Ahmed, M. B., Hannan, M. M., Karim, R. (2007) Studies on genetic variability and interrelationship among different traits in tomato (Lycopesicon esculantum Mill.).
Middle East J. Sci. Res. 2, 139–142.
30. Heath, R. L., Packer, L. (1968) Photoperoxidation in isolated chloroplasts. I. Kinetics and stoichiometry of fatty acid peroxidation. Arch. Biochem. Biophys. 125, 189–198.
31. Hoagland, D., Arnon, D. I. (1950) The water culture method for growing plants without soil.
California. Agricultural Experiment Station.
32. Juan, M. M., Rivero, L. R., Juan, M. R. (2005) Evaluation of some nutritional and biochemical indicators in selecting salt-resistant tomato cultivars. Environ. Exp. Bot. 54, 193–201.
33. Kennedy, B. F., De Fillippis, L. F. (1999) Physiological and oxidative response to NaCl of the salt tolerant Grevillea ilicifolia and the salt sensitive Grevillea arenaria. J. Plant. Physiol. 155, 746–754.
34. Koji, Y., Shiro, M., Michio, K., Mitsutaka, T., Hiroshi, M. (2009) Antioxidant capacity and damages caused by salinity stress in apical and basal regions of rice leaf. Plant Prod. Sci. 12, 319–326.
35. Liang, Y. C. (1999) Effects of silicon on enzyme activity and sodium, potassium and calcium concentration in barley under salt stress. Plant. Soil. 209, 217–224.
36. Lichtenthaler, H. K. (1988) In Vivo Chlorophyll Fluorescence as a Tool for Stress Detection in Plants. Applications of Chlorophyll Fluorescene in Photosynthesis Research, Stress Physiology, Hydrobiology and Remote Sensing. 129–142.
37. Lieberman, M., Segev, O., Gilboa, N., Lalazar, A., Levin, I. (2004) The tomato homolog of the gene encoding UV damaged DNA binding protein 1 (DDB1) underlined as the gene that causes the high pigment-1 mutant phenotype. Theor. Appl. Genet. 108, 1574–1581.
38. Meloni, D. A., Oliva, M. A., Martinez, C. A., Cambraia, J. (2003) Photosynthesis and activity of superoxide dismutase, peroxidase and glutathione reductase in cotton under salt stress. Environ. Exp.
Bot. 49, 69–76.
39. Mittova, V., Guy, M., Tal, M., Volokita, M. (2002) Response of the cultivated tomato and its wild salt-tolerant relative Lycopersicon pennellii to salt-dependent oxidative stress: increased activities of antioxidant enzymes in root plastids. Free Radic. Res. 36, 195–202.
40. Mittova, V., Tal, M., Volokita, M., Guy, M. (2002). Salt stress induces up-regulation of an efficient chloroplast antioxidant system in the salt-tolerant wild tomato species Lycopersicon pennellii but not in the cultivated species. Physiol. Plant. 115, 393–400.
41. Munns, R., Termaat, A. (1986) Whole-plant responses to salinity. Aust. J. Plant Physiol. 13, 143–160.
42. Munns, R., Tester, M. (2008) Mechanisms of Salinity Tolerance. Plant. Biol. 59, 651–681.
43. Murray, J. R., Hackett, W. P. (1998) Leaf anthocyanin content changes in Zea mays L. grown at low temperature: significance for the relationship between the quantum yield of PSII and the apparent quantum yield of CO2 assimilation. Photosyn. Res. 58, 213–219.
44. Nakano, Y., Asada, K. (1981) Hydrogen peroxide in scavenged by ascorbate-specific peroxidise in spinach chloroplast. Plant. Cell. Physiol. 22, 867–880.
45. Oztekin, G. B., Tuzel, Y. (2011) Comparative Salinity Responses Among Tomato Genotypes and Rootstocks. Pak. J. Bot. 43, 2665–2672.
46. Ozturk, L., Demir, Y., Unlukara, A., Karatas, I., Kurunc, A., Duzdemir, O. (2012) Effects of long-term salt stress on antioxidant system, chlorophyll and proline contents in pea leaves Rom. Biotechnol.
Lett. 17, 7227–7236.
47. Panda, S. K. (2001) Response of green gram seeds under salinity stress. Indian J. Plant. Physiol. 6, 438–440.
48. Parida, A. K., Das, A. B. (2005) Salt tolerance and salinity effects on plants: a review. Ecotoxicol.
Environ. Saf. 60, 324–349.
49. Peralta, I. E., Spooner, D. M. (2005). Morphological characterization and relationships of wild tomatoes (Solanum L. Section Lycopersicon): A Festschrift for William G., D’Arcy. T. B., Croat V.
C., Hollowell, R. C., Keating, M. Botanical Garden Press. 104, 227–257.
50. Perez-Alfocea, F., Estañ, M. T., Caro, M., Bolarin, M. C. (1993) Response of tomato cultivars to salinity. Plant. Soil. 150, 203–211.
51. Rajamane, N. N., Gaikwad, D. K. (2014) Effect of sodium chloride stress on polyphenol, flavonoid, anthocyanins contents and Lipid peroxidation of leaf lets of Simarouba glauca. Indian J. Pharm.
Educ. Res. 1, 2350–1138.
52. Rao, M. V. (1992) Cellular detoxifying mechanisms determine age dependent injury in tropical plants exposed to SO. J. Plant. Physiol. 140, 733–740.
53. Rodríguez-Rosales, M. P., Kerkeb, L., Bueno, P., Donaire, J. P. (1999) Changes induced by NaCl in lipid content and composition, lipoxygenase, plasma membrane H+-ATPase and antioxidant enzyme activities of tomato (Lycopersicon esculentum Mill.) calli. Plant. Sci. 143, 143–150.
54. Rus, A. M., Estañ, M. T., Gisbert, C., Garcia-Sogo, B., Serrano, R., Caro, M., Moreno, V., Bolarin, M. C. (2001) Expressing the yeast HAL1 gene in tomato increases fruit yield and enhances K+/Na+ selectivity under salt stress. Plant. Cell. Environ. 24, 875–880.
55. Saeed, M., Saleem, F., Zakria, M., Anjum, S. A., Shakeel, A., Saeed, N. (2011) Genetic variability of NaCl tolerance in tomato. Genet. Mol. Res. 10, 1371–1382.
56. Sairam, R. K., Rao, K. V., Srivastava, G. C. (2002) Differential response of wheat genotypes to long term salinity stress in relation to oxidative stress, antioxidant activity and osmolyte concentration.
Plant. Sci. 163, 1037–1046.
57. Saranga, Y., Zamir, D., Marani, A., Rudich, J. (1991) Breeding tomatoes for salt tolerance – field‐
evaluation of Lycopersicon germplasm for yield and dry‐matter production. J. Am. Soc. Hort. Sci.
116, 1067–1071.
58. Savithri, H. S., Sudhakar, C. (1999) Total peroxidase activity and peroxidase isoforms as modified by salt stress in two cultivars of foxtail millet with differential salt resistance. Plant. Sci. 141, 1–9.
59. Shalata, A., Tal, M. (1998) The effect of salt stress on lipid peroxidation and antioxidants in the cultivated tomato and its wild salt-tolerant relative Lycopersicon pennellii. Physiol. Plant. 104, 169–174.
60. Sharifova, S., Mehdiyeva, S., Theodorikas, K., Roubos, K. (2013) Assessment of genetic diversity in cultivated tomato (Solanum lycopersicum L.) genotypes using raped primers. J. Hortic. Res. 21, 83–89.
61. Stevens, R., Buret, M., Duffé, P., Garchery, C., Baldet, P., Rothan, C., Causse, M. (2007) Candidate Genes and Quantitative Trait Loci Affecting Fruit Ascorbic Acid Content in Three Tomato Populations. Plant. Physiol. 143, 1943–1953.
62. Stevens, R., Buret, M., Garchery, C., Carretero, Y., Causse, M. (2007) Technique for rapid, small- scale analysis of vitamin C levels in fruit and application to a tomato mutant collection. J. Agric. Food Chem. 54, 6159–6165.
63. Stevens, R., Page, D., Gouble, B., Garchery, C., Zamir, D., Causse, M. (2008) Tomato fruit ascorbic acid content is linked with monodehydroascorbate reductase activity and tolerance to chilling stress.
Plant. Cell. Environ. 31, 1086–1096.
64. Taha, R., Mills, D., Heimer, Y., Tal, M. (2000) The relation between low K+/Na+ ratio and salt‐
tolerance in the wild tomato species Lycopersicon pennellii. J. Plant Physiol. 157, 59–64.
65. Tal, M., Shannon, M. C. (1983) Salt tolerance in the wild relatives of the cultivated tomato: Responses of Lycopersicon esculentum. L. cheesmanii, L. peruvianum, solanum pennellii and F1 hybrids to high salinity. Aust. J. Plant Physiol. 10, 109–117.
66. Turhan, A., Seniz, V. (2010) Salt tolerance of some tomato genotypes grown in Turkey. J. Food. Agri.
Environ. 8, 332–339.
67. Wang, W., Vinocur, B., Altman, A. (2003) Plant responses to drought, salinity and extreme temperatures: towards genetic engineering for stress tolerance. Planta 218, 1–14.
68. Witkoswski, E. T. F., Lamont, B. B. (1991) Leaf specific mass confounds leaf density and thickness.
Oecologia 84, 362–370.
69. Xiong, L., Zhu, J. K. (2002) Salt tolerance. The Arabidopsis Book. American Society of Plant Biologists. Rockville.
70. Yagi, K. (1976) A simple fluorometric assay for lipoperoxide in blood plasma. Biochem. Med. 15, 212–216.
71. Yokas, I., Tuna, A. L., Bürün, B., Altunlu, H., Altan, F., Kaya, C. (2008) Response of the tomato (Lycopersicon esculentum Mill.) plant to exposure to different salt forms and rates. Turk. J. Agric.
For. 32, 319–329.