O R I G I N A L S T U D Y
Characterisation of a landslide by its fracture system using Electric Resistivity Tomography and Pressure Probe methods
K. Szokoli1 •L. Szarka1•M. Metwaly2,3•J. Kalma´r1• E. Pra´cser1•S. Szalai1
Received: 24 November 2016 / Accepted: 28 March 2017 ÓAkade´miai Kiado´ 2017
Abstract We have studied a slowly moving loess landslide along the River Danube in South Hungary. In contrast with other efforts, we aimed to determine its fracture system.
Due to the homogeneous composition of the loess, it seems to be the only possibility to get information about the landslide and its further evolution. Beside of the well-known Electrical Resistivity Tomography (ERT) the so-called Pressure Probe (PreP) method was applied to characterise the supposedly dense fracture system. This method was developed to detect and characterise mechanically weak zones, which may not visible from the surface, and may occur e.g. due to landslides. Fracture zones had been especially well localised by the ERT, enabling the prediction of the positions of future rupture surfaces and thus also the delineation of the endangered zones. PreP was able to give a very detailed image about the surface projection of the fractures. Both methods proved to be good to characterise the fracture system of such a landslide area. Geophysical predictions have been verified also in reality: the mass movements occurred about 1 years after the measurements. Therefore, to provide early risk warnings and to avoid damage to con- structions or endangering human life, the application of the ERT and PreP methods is highly recommended.
Keywords LandslideERTPressure-ProbeFractureLoess landslide
& K. Szokoli
szk@ggki.hu
1 MTA CSFK Geodetic and Geophysical Institute, POB 5, Sopron 9401, Hungary
2 Archaeology Department, College of Tourism and Archaeology, King Saud University, Riyadh, Saudi Arabia
3 National Research Institute of Astronomy and Geophysics (NRIAG), Cairo, Egypt DOI 10.1007/s40328-017-0199-3
1 Introduction
A landslide is a down slope movement of soil or rock, which occurs due to local geological and groundwater conditions, extreme weather events, earthquakes and other factors. It is therefore important to map landslide endangered areas, diagnose their risk and monitor them. A loess landslide is a typical type of landslide, which is widely distributed all over the world. It occurs frequently over wide areas, and causes serious casualties and property losses. A systematic summary and thorough analysis of the loess-bedrock landslide to reduce disasters caused by loess landslides was done by Fan et al. (2012).
Geotechnical (Solberg et al.2012), remote sensing (Tofani et al.2013), geodetic (U´ jva´ri et al. 2009; Ba´nyai et al. 2014) and geophysical techniques (Jongmans and Garambois 2007) are used to investigate landslides. Landslide studies were conducted by geoelectrical resistivity measurements, using one-dimensional sounding e.g. by Agnesi et al. (2005) to determine the bedrock depth. Lapenna et al. (2005) performed two-dimensional ERT studies to describe the geological boundary and/or determine the slip surface depth. Three- dimensional slip surface geometry was investigated by Lebourg et al. (2005). Uhlemann et al. (2015) carried out time-lapse ERT measurements to study landslides. Recent reviews by Perrone et al. (2014) summarize possibilities of application of ERT to describe landslides.
All aforementioned techniques aimed at delineate the horizontal and/or vertical boundaries of the sliding volume, its internal characterisation and monitoring. We aimed to complement these investigations with the characterisation of the fracture system of the landslide. It was expected to allow an early prediction of future rupture surfaces and thus delineate endangered areas. Knowledge of the fracture system of a landslide is also important because the continuity and geometry, orientation and dip of the major fractures are crucial parameters for assessing rock stability and landslide evolution.
Although geotechnical tools are perfect for mapping fractures, these tools provide only single points information. They are expensive, and their utilisation is strongly limited by field conditions, like topography, artificial constructions, slide danger and plants. The PreP method presented here—which was first described by Szalai et al. (2014)—is a simplified version of the geotechnical instruments. It avoids all the aforementioned deficiencies of the geotechnical tools.
The resistivity method is also useful to detect fractures. Francese et al. (2009) could detect fractures with a large (about 10 m) characteristic distance using electric resistivity tomography. Even a dense fracture system can be successfully mapped by geoelectric null arrays (Falco et al.2013), but they provide information only from a given depth. Bie`vre et al. (2012) characterised fissures within a fine-grained landslide, using ERT and seismic techniques. Jones et al. (2014) mapped desiccation cracks on a flood embankment with 2D and 3D ERT.
We think that fracture detection in landslide areas is a principal question, due to the fact that fractures, which may cause significant mass movements, are going to be present long time before the failure. If the fractures could be localised, the endangered areas could be delineated in right time. In this paper, at first geological and geomorphological settings of the study area will be presented, and then the ERT and PreP methods will be demonstrated.
Finally, the field results obtained by both methods will be presented with their in situ verification.
2 Geology of the area
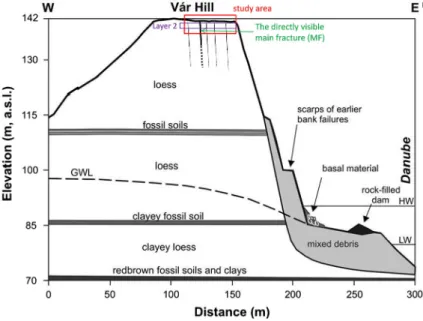
The field study was carried out in Dunaszekcs}o, Baranya County, Hungary. It is located on the bank of river Danube between the Sa´rko¨z and Moha´cs depressions. Our measurements have been carried out on the top of a bluff which reaches its highest point (142 m a.s.l.) at Va´r Hill (Figs.1, 2). The basement formations at Dunaszekcs}o are Triassic–Jurassic limestones, which are located 200–250 m below the surface (Moyzes and Scheuer1978).
The basement rocks are covered by clayey and sandy sediments (Fig.1) which formed in the Pannonian s.l. epoch (12.6 to *2.6–2.4 Ma). The uppermost 70 m of the sediment sequence are sandy and clayey loess layers with brown to red fossil soils accumulated during the Pleistocene (Fig.1).
Below Va´r Hill, the flood plain of the Danube is very narrow. The bluff consists of a 20–30 m high vertical loess wall above the 10–20 m high slopes that consist of reworked loess from past landslides and fluvial mud, sand and gravel deposits of the river (Fig.1).
The slopes were intensively undercut by the Danube during each flood event. The younger loess series on top is less compact, the older loess below is much more compact (Moyzes and Scheuer 1978). Field observations show tension cracks in the loess complex both parallel and perpendicular to the channel of the Danube. The vertical cracks are visible also on the roof of the To¨ro¨klyuk cave, a large natural cavity in the area (Kraft2005).
The water level of the Danube fluctuates in a range of about 10 m that influences the springs of ground and artesian water at the foot of the bank. It is inundated during higher water stages but drains fast during lower ones (Fa´bia´n et al. 2006). A more detailed geologic description of the study area is given in U´ jva´ri et al. (2009).
It was observed in the field that the top of the fractures are only in 5–10 cm depth and they are only hidden by grass and soil. Close to the surface most of them are about 3–5 cm
Fig. 1 Geological cross-section of the high bank at Dunaszekcs}o (after Moyzes and Scheuer1978). Vertical exaggeration:93.GWLground water level (measured in a well in July 2008),HWhighest water,LWlowest water
wide and they seem to go down at least 1–2 m. In 2007, a rupture appeared parallel with the riverbank provoking the presented investigations.
3 Former research in the area
Engineering geology (Pe´csi and Scheuer 1979), geodesy (Ba´nyai et al.2014), geomor- phology (Pe´csi et al.1979), hydro-geology (Galli1952) and geophysics (see later) were used to study recent movements of the Dunaszekcs}o landslide providing mainly empirical descriptions of the three-dimensional deformations.
Heged}us (2008) applied active and passive seismics, Zilahi-Sebess et al. (2009) seis- mics and engineering geophysics in the Dunaszekcs}o area. Bugya et al. (2011) surveyed the relative elevation change of the surface in 2.595 m grid network in relation to a marked base point using analogue theodolite and leveller with regular time interval during a year. Their results showed significant cm scale vertical displacements. Most of the grid points have a slow decreasing tendency, but close to the scarp they found a more signif- icant displacement. Fu¨si and Madarasi (2012) monitored the development of the main fracture with geoelectrical anisotropy measurements and the motion of the whole area with PSInSAR analysis and high precision leveling. Szanyi (2016) mapped velocity distribution of the Va´r Hill using Rayleigh wave group to image intact and creviced areas and identify
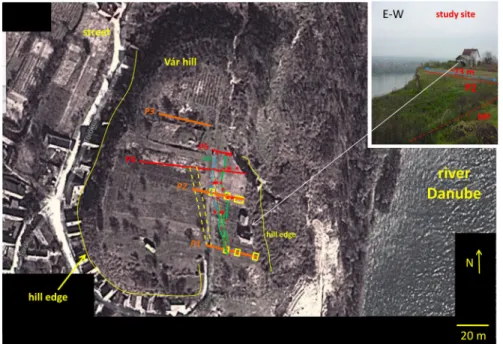
Fig. 2 Google map of the study site. ERT profiles P1, P2 and P3 (brown lines); PreP profiles (red linesP4, P5 and P1). P1 was measured by both methods. The main fracture visible at the time of the measurements (thick dotted blue curve); new fractures developed after the measurements (continuous green curves); the actual scarp (yellow curve); fracture positions (stars); fracture zones in the ERT section (yellow rectangle).
Supposed major fractures outside of the active area on the basis of the P1 and P2 PreP profiles (yellow dotted line). (Color figure online)
the most vulnerable sections. They found another low velocity region, beside the known one, which might indicate a previously unknown loosened domain.
The studied landslide does not seem to develop over a sliding surface. Loess loses its cohesion due to the leaching of its carbonates below the ground water level and under the pressure of the mountain it produces extrusions in the river bed. This process has been observed several times (U´ jva´ri et al.2009). The lack of mass below the mountain due to the extruded loess must lead to the mass movement. Regarding that this process takes place at a very large depth in comparison with the length of the plateau of the hill, its geophysical investigation is very complicated. Therefore our aim was to map the fracture network of the landslide in order to delineate the endangered area and to describe the inner fracture structure of the landslide.
The study site is close to the edge of the landslide (Fig.2). Field observations show the development of cracks, both parallel and perpendicular to the channel of the Danube. At the time of the measurements, only one fracture was visible. Since many fractures have been excavated, it is known that the top of the fractures were only in 5–10 cm depth and they were only hidden by grass and soil. Most of the fractures were about 3–5 cm wide close to the surface, and they seem to go down at least 1–2 m. The results of the ERT measurements could have been influenced by the rainfall, just before the measurements had been carried out. Disregarding from that however during the previous 3 weeks, there was no rainfall at all, and all fractures, which were dug out, were dry.
4 Electric Resistivity Tomography (ERT) investigations
We carried out Electric Resistivity Tomography (ERT) measurements since the resistivity method is able to characterise fractures. These measurements are discussed detailed in Szalai et al. (2016). In this study the well-known Wenner–Schlumberger (W–S) array has been used. An inversion procedure is required to handle the geoelectric data like the ones by Gyulai et al. (2014) or Gyulai and Szabo´ (2014).
First we carried out numerical modelling because it is principal to see whether the ERT is applicable for the given problem. The modelling parameters were determined taking into account, that the study area is homogeneous loess in the investigated depth range; electrical resistivity may only change due to either fracturing and/or changes of moisture content.
The mean electrical resistivity value of loess, which was taken as a background, is 150Xm (Caicedo et al. 2013). At shallow depth, the non-saturated loess is assumed to be only interrupted by fractures. The distance of the minor fractures was assumed to be 0.5–1 m, on basis of the characteristic fracture distance on the roof of the To¨ro¨klyuk cave. Dry fractures are more resistive, water-filled fractures are less resistive than the fracture-free loess. Both of these situations were modelled, as well as partially water-filled fractures. All fractures, which have been dug out, were nearly vertical, close to the surface.
The electrodes were spaced at a distance of 0.5 m from each other for modelling 0.1 m wide fractures. A 24-electrode system was used. We added voltage dependent noise to the data following Zhou and Dahlin (2003). The average noise level was 1–2%. The damping factor was set to 1. The default parameters of the EarthImager 2D software Version 2.1.7 (Advanced Geosciences2006) were used in the modelling, but the robust inversion was applied, because it is expected to produce a better image in case of sharp horizontal resistivity changes.
Fig.3Numericalmodellingoveraseriesoffractures.aModel;binvertedimage;capparentresistivitypseudosection.disthedepthofthetopofthefractures.Bluecircles indicateresistiveanomalies,theyellowonesconductiveanomalies.(Colorfigureonline)
Figure3a presents the model of a series of fractures. The resistivity of fractures 1–3 are 10,000 Xm, while those of fractures 4–6 are 20 Xm, representing air-filled and water- saturated fractures, respectively. Fracture 7 is only partially water filled, hence electrically conductive. All fractures can be recognised in the resistivity image (Fig.3b), but their effect depends strongly on their depth. Due to the fact, that close to the surface there are a lot of pseudoanomalies, we looked for a depth, where the near-surface artefacts disappear, while the anomalies due to the fractures are still well visible and separable. At the depth of 0.3 m all fractures could be detected and localised rather precisely (Fig.3b). Figure3c displays the apparent resistivity pseudosection.
Although the artefacts are smaller than the anomalies, it is better to carry out mea- surements, when all fractures are expected to be dry (free of water, that is electrically resistive) or wet (that is electrically conductive). Carrying out field measurements, e.g.
after a longer dry period, resistive anomalies may be certainly interpreted like fractures, while zones with lower resistivity values have to be artefacts. The presence of such fractures is expected in the given field. The fractures proved to be well detectable, but they could not be followed deeper than 1 m. It is however possible to map their surface pro- jection, hence to fulfil the principal aims of the study.
5 Field study
5.1 The field measurement and field results
The measurements were acquired in November 2013, 3–5 days after a small amount (35 mm) of rainfall, but 3 weeks after a larger amount of precipitation. A 72-electrode Syscal Pro Standard & Switch system was used for the field measurements with 0.5 m electrode spacing. Data were inverted using Earthlmager 2D Version 2.1.7 (Advanced Geosciences2006). In the resistivity inversion settings, the stop criteria were set with 3%
RMS error and 5% error reduction. The best RMS values were obtained taking 1 as damping factor.
The locations of the three electrical profiles (labelled P1–P3) are presented in Fig.2.
They are closely perpendicular to the slope, and expected to characterise the area ade- quately. P2 is in the middle of the investigated area, which supposed to be the most characteristic for the landslide. The already visible large fracture, the main fracture (MF) can be found here. The largest part of P1 is in the area between the expected elongation of the MF and the edge of the landslide, although the MF does not reach it. P3 is on the western side of the elongation of the main fracture. Therefore, the expected order of the fracturing of the areas is below P2, P1 and P3, respectively.
At first P2 field results are presented (Fig.4b), because its interpretation is the easiest.
The green areas are assumed to describe dry loess. They are in the inhomogeneous layer at a depth of 0.5–2.5 m (layer 2), with resistivity values about 150 Xm. They have been regarded as background. The more conductive uppermost layer (layer 1, from the top down to 0.5 m) with a resistivity of 70–100Xm is supposed to be a little more humid loess, likely due to the low amount of rain before the measurements. The conductive layer (below 50 Xm) in the bottom of the section (below 2.5 m, layer 3) has to be even more humid loess.
We focused on the non-continuous middle layer 2, to achieve our goal to describe fractures, because the effect of the fractures are expected to be seen the best in this layer, on basis of the numerical modelling. The green zones (about 150Xm) are interrupted by
Fig.4ERTprofiles.aP3;bP2;cP1.Fracturezoneswhoseelectricalresistivityvaluesaresignificantlylargerthanthebackgroundvalueatthesamedepthlevel(continuous linerectangles);fracture-freezones(dottedlinerectangles);bordersofthefracturezones,whicharepredictedtocorrelate(bluelines).Predictedfractures(thickdottedblue line)andnotpredictedfractures(thindottedblueline).AbovetheP1andP2sectionstheirtopographyandtheverticaloffsetatthefractureson31.08.2015.Thethreelayers havingdifferentresistivityarepresentedinP2inbothsidesofMF.Thephotoshowsthelocationofthebuildinginthelandslidearea.(Colorfigureonline)
yellow (about 200Xm) and red (over 500Xm) ones, which were interpreted as fractures or fracture zones. Beside the known main fracture (MF, fracture zone 3) at 12–13 m there are two zones in this ‘‘layer’’ on the ERT section whose resistivity values are significantly greater than the background value: the 19.5–21.5 m (fracture zone 2) and 28.5–35 m (fracture zone 1) zones.
Zone 1, the one, closest to the scarp, shows that the loess is very fragmented at the hill edge. Fracture zone 3, whose anomaly value is the largest, belongs to the main fracture (MF). Fracture zone 2 is in the middle, between zone 1 and zone 3. The consolidated area between zone 1 and zone 3 is likely going to break here. Since fracture zone 1 is fully fractured, its fragments may slide or fall down anytime.
Figure4c presents the area below P1, which is assumed to be more consolidated; the MF has not reached it yet. The resistivity values of all ‘‘layers’’ are close to the corre- sponding ones in the P2 section, and the structure of the section is also very similar to that of P2. Like the P2, the P1 results also highlighted three very characteristic fracture zones.
Fracture zone 1 is at the edge of the slide, zone 2 is in the middle of this zone and zone 3.
The high value of zone 3 lets us assume that the MF crosses P1 here, even if it is not seen yet. In this profile fracture zones also seem to appear west of these zones. In the area below P1 the structure is very different between zones 1 and 3, and between zones 4 and 5. In zones 1–3 there are long fracture-free zones between the fracture zones. In zones 4–5 at the same time, there are only very short fracture-free zones. Positioning of individual fractures is only possible in case if their anomalies are sharp, but it was rare in the study area.
P3 (Fig.4a) is westerly of the elongation of the MF. This site seems to be the less hazardous among those that were investigated. There is no any indication on the surface of the presence of any fractures. The resistivity section presents a rather homogeneous area.
Fractures are supposed to be throughout P3, but only the ones at 10.5, 17, 27 and 31 m produced stronger anomalies. The 30–33 m fracture zone, at the end of the profile, was assumed to be mechanically weaker.
The similarity between P1 and P2 sections is remarkable. Most likely both of them contain the MF fracture zone and two zones easterly of it. The west side of the MF is not as structured as the east one. The situation is the same for the whole length of P3, although it is also hardly structured and it is containing zones, where the resistivity is a little higher than elsewhere along the profile. We suppose that strong structuring (that is occurrence of zones, which are characteristically different from other parts of the profile) develops due to the break of the loess unit at certain locations (developing the fracture zones) and a relaxation in others following it (producing the fracture-free zones). Therefore, we supposed that only the well structured area east of the MF between P1 and P2 is actually endangered (Figs.2,4).
Fracture zone 3 in P1 supposed to contain the fracture, which is visible in P2. Fracture zone 2, appearing on both P1 and P2 profiles, was assumed to detect a significant fracture which may develop to a rupture surface. Fracture zones 1 of P1 and P2 also refer to the existence of remarkable fractures. The relative stability of the area between fracture zones 1 and 2 lets us assume that the houses in this area may sink without serious damage. Due to the lack of well-defined fracture zones the area covered by P3 is not considered to be hazardous either. The smaller fractures westerly of the MF below P1 and P2 and all along P3 may emerge in the first line because of the steep topography of the hill.
It was found from the field results that fractured and fracture-free areas are well dis- tinguishable, while individual fractures could not have always been separated. Hence, the fractures could not be followed in the lowest layer ERT results enabled to describe the inner structure of the landslide area. The endangered area could be delineated and even the position(s) of future rupture surfaces could be forecasted.
5.2 Verification of the ERT field results
The ERT results have been verified by different methods. Numerical modelling verified the field interpretation. The excavated fractures were dry, their tops were at a depth of about 5–10 cm; they are vertical near the surface and go deep down. These fractures were well localised by the ERT. The best verification of our results has been given by the new mass movements in 2015 since the measurements and data interpretation. The actual condition of the study site can be seen in Figs.2and5. The MF continued and now crosses P1 in fracture zone 3, where it was expected on the basis of our study. A new large fracture appeared in fracture zone2of P2 (the right fracture in the photo in Fig.5), as expected. Its continuation has not reached P1, but it seems to go in the direction of its fracture zone2 (Figs.2,5). There is no visible fracture in fracture zone1neither in P1 nor in P2. These zones are special, as they are located at the edge of the landslide. We think that due to the strong fracturing of these zones these blocks may fall down anytime.
Figure4presents the correlation between the actual topography along P1 and P2 and their resistivity images. There are also two fractures on P2 with vertical offsets of 0.4 m and 0.2 m. These smaller fractures were not predicted by our measurements. Most likely, they did not exist at the time of the measurements yet. They must have been produced by the movement along the larger fractures.
P3 is still free of visible fractures as expected. A part of the hazardous area where there are the houses, seemed to be fracture-free (Fig.5), therefore it was expected that they will not be severely damaged or destroyed. It is seen e.g. in the lower photo in Fig.5, that there is no fracture on the walls of the houses, which sank about 2 meters without serious damage. All of our predictions have been verified by the mass movements in 2015, dis- regarding only from the small features below P2. They are assumed to have developed meantime due to the displacement along the predicted large fractures.
The following facts can be stated on basis of the ERT measurements: 1. The MF, which was already visible in time of the measurements, will continue along fracture zone 3 in P1.
2. In fracture zone 2, a new rupture will open in P2. 3. The same was expected in fracture zone 2 in P1. 4. Blocks at the edge of the landslide (fracture zone 1 on P1 and P2) could separate anytime. 5. Only the area easterly of zone 3 is hazardous inside of the area between P1 and P2. The west side area of this zone and the one below P3 is not endangered yet. 6. The area inside the hazardous one (point 5) where there are houses may slip down in one unit because it is fracture-free. Expectations 1, 2, 5 and 6 have been verified by the mass movements 21 months after the measurements. Although expectation 3 has not yet been verified, regarding the actual situation of the new large fracture which is going through zone 2 on P2, it may be expected in the future. Expectation 4 has not been verified yet, but regarding to earlier rupture surfaces it can easily take place. The smaller rupture surfaces could not have been predicted since they might have occurred during the mass movements along the larger surfaces.
6 Pressure-Probe (PreP) investigations 6.1 The PreP device and measurement
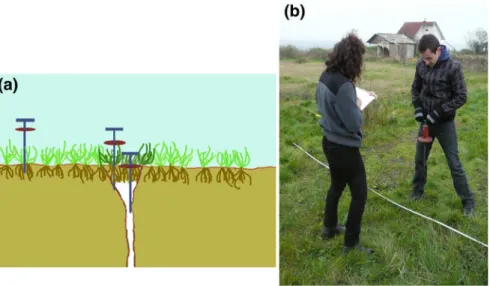
PreP is in effect a simplified penetrometer (Fig.6b) whose principle is as follows: dropping the probe from the same height, its penetration depth depends on the mechanical resistance
of the soil (Fig.6a). One lets it fall down from a height of 1 m which is convenient for most people (Fig.6b) and which was marked on the clothes of the crew members to hold it throughout the measuring process. The depth scale on the rod shows the penetration depth.
The technical details of the probe can be found in Szalai et al. (2014). This method is easily applicable and powerful, due to its low cost, relative rapidity, almost arbitrarily high resolution power, easy use and simple interpretation of its results. The main limit of the method is that it might not be applied in areas, where the mechanical properties of the soil have been exposed to artificial changes.
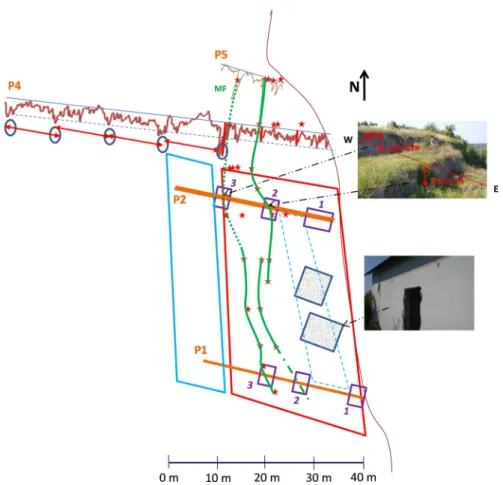
Fig. 5 Verification of the ERT results (taken from Fig.2) and PreP profiles P4 and P5. ERT profiles P1, P2 and P3 (brown lines); the MF visible at the time of the measurements (green dotted curve); the new fractures which developed after the measurements (green curves); predicted continuation of the new fracture in the future (point-dotted green curve); the actual scarp (thin brown curve); actual fracture positions (stars);
fracture zones, which have been interpreted from the ERT results (numbered violet rectangles). Area assumed to be hazardous (red rectangle); probably not yet hazardous area (blue rectangle). Probably safe area inside of the dangerous one (blue dotted line rectangle). Ground-plan of the buildings (filled rectangles). The photo above presents the two largest fractures 21 months after the measurements. Thered lineis about 15 m north of P2. The photo below demonstrates the fracture-free wall of the house in the landslide site at the time of the verification. The background value lines of P4 and P5 which present also the position of the profiles (blue continuous lines). Marker lines to support the localisation of the P4 anomalies (red lines).-20 cm PreP level (blue dotted line). Positions of anomalies with PreP values less than-20 cm (blue ellipses). Their characteristic distance (red double side arrows). (Color figure online)
The PreP measures the mechanical resistivity of the soil at shallow depths. This method proved to be well applicable in the study area, where most of the fractures reach close to the surface, but they are not visible due to the vegetation cover and the soil, which eroded into them, furthermore because of the roots of the flora. Crossing the roots of plants, the probe is able to detect fractures due to their decreased mechanical resistance. The mea- surements were carried out on profiles which were quasi perpendicular to the supposed direction of the most interesting fractures which are supposed to be nearly parallel to the edge of the hill. A sampling distance of 0.1 m was applied.
6.2 Field results and interpretation
Significant, wide fractures were interpreted in the PreP profiles where the values (i.e. the penetration depth of the probe) were much larger than in the neighbouring points (Fig.7).
The background values (where there are no fractures) were mostly in the range of 11–13 cm. The PreP profiles display the running average each of 3 consecutive values.
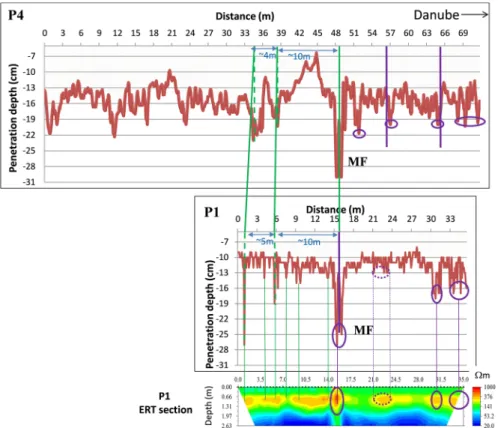
Only profiles P1 and P4 will be discussed here more detailed (Fig.7). Several more profiles are discussed in Szalai et al. (2014). Profiles P1 and P4 are partly or entirely outside of the area which seemed to be endangered at the time of the measurements (Fig.2). P4 clearly demonstrates that the area, which is located on the stable, not-sliding, passive side (0–49 m) of the MF is also fractured. The cracks in this zone have even greater amplitudes than on the active side (49–72 m). These cracks were shown also in Fig.5 demonstrating that they are almost equally distributed. The fragmentation of the loess unit appears to have been also started here. Regarding P1 and P4 results together (Fig.7) it can be stated that there are cracks also in the passive area. The area below P1 must be more consolidated, because the background PreP value is about 15 cm on profile P4, it is only 11 cm on profile P1. The anomalies of P1 are at least as large, which may nevertheless be an alert.
P1 ERT section at the bottom in Fig.7demonstrates the similarity of the ERT and PreP results. ERT presents however the 21–24 m anomaly more clearly. This anomaly is in the
Fig. 6 The PreP measurement process:ascheme of the measurement;bmeasurement and data registration.
(Color figure online)
18–28 m zone which is rather compact because it serves as a footpath. The PreP anomaly supposed to be weak due to that. The other anomalies correlate well, but the PreP seems to resolve better the anomalies. This example demonstrates the usefulness of the joint application of the ERT and PreP methods to avoid problems among others due to the non- sufficient resolution and the effect of human activity.
6.3 Verification of the PreP field results
PreP field results were verified in numerous ways. The most direct way was their expo- sition: some cracks were shorter or longer exposed. All larger PreP anomalies were clearly attached to fractures. Even fractures not wider than half of the sampling distance, that is 5 cm, were detected by the PreP method, showing its effectiveness and good resolution. Its reason is that a small scale valley develops at the top of the fractures, as it is demonstrated in Fig.6a which is wider than the fracture itself.
Fig. 7 Profiles P1 and P4, extended into the passive area and P1 ERT section. Thedotted linesproject the position of the anomalies tothe horizontal axis. Thecontinuous green linesconnect fractures observed on both profiles which were assumed to be the same.Purple thick linespresent the positions of the newly opened fractures. Ellipses PreP anomalies east from the MF. Dotted line ellipseless significant PreP anomaly.Purple thin linesconnect the corresponding PreP and ERT anomalies (the continuous linesthe more,the dotted linesthe less significant ones).Green linesconnect the corresponding PreP and ERT anomalies in the passive area. (Color figure online)
Figure7 displays the newly developed fractures along P1 and P4. A significant new fracture appeared at 57 m in P4 (the fracture is seen in Fig.2and on the right side of the photo in Fig.5), as it was forecasted by a large PreP anomaly. A smaller crack occurred at 65 m, where also an anomaly had been recorded. The PreP method suggested the presence of a fracture also at 51 m. No fracture has appeared here yet. The anomalies at the end of P4 (65–71 m) have to be linked to the weak zone at the edge of the landslide, which is well seen also in the ERT profiles (Fig.4b, c). This zone is well displayed also in P1 (Fig.7). P1 does not present however any other anomalies easterly from the MF. Most likely human activities (a frequently used pathway) made the PreP method not usable in this part of P1.
The anomaly of the MF appeared at the same time very clearly in this profile (at 16 m), already when it had not got any surface indication yet.
7 Conclusions
A slowly moving loess landslide was investigated using the well-known ERT and the newly-developed PreP methods. We focused the study on the fracture system of the landslide to determine its mechanically weak zones. Although the investigation of such a dense fracture system may be difficult, it was expected that this knowledge will enable us to understand the process of mass movement and to forecast its future development.
Mapping of the furthest significant fracture (zone) from the actual sliding front was expected to enable us to delineate the endangered area. ERT and PreP measurements have been carried out to fulfil the aforementioned aim.
The ERT results demonstrated that fractured and fracture-free areas may be well dis- tinguishable, while individual fractures could not have always been separated. Although ERT could not follow the fractures in the lowest layer, ERT results enable to describe the inner structure of a landslide area. The endangered area could be delineated and even the position(s) of future rupture surfaces could be forecasted.
The PreP method explored and tracked even 2–3 cm wide cracks enabling the very detailed investigation of the fracture system of our study area, thus the localisation of future rupture surfaces and the delineation of the endangered areas. This method may be particularly useful to study landslides consisting of homogeneous rocks whose investiga- tion is fairly limited by other methods.
Both the ERT and PreP methods were able to predict future mass movements. It had been forecasted in which direction the MF was going to continue. The location of the new rupture surface, which had not got any indication at the time of the measurements, was also predicted. We assumed that blocks at the edge of the landslide may separate anytime. A safe area could have been delineated inside of the endangered one, which was expected to slide down in one unit.
Almost all expectations have been verified by the mass movements 21 months after the measurements. Only the blocks at the edge have not fallen yet. The new smaller rupture surfaces could not have been predicted, most likely because they might have occurred during the mass movements along the larger surfaces. Due to the not sufficient length of the ERT profiles the area westerly of the MF was predicted not to be endangered yet. The longer PreP profile suggests that there are already significant rupture surfaces also in this still apparently safe area.
It was verified on the example of the Dunaszekcs}o landslide, that both the ERT and PreP methods are able to delineate potential landslide hazardous areas and to map their fracture
system, and this way give us an early risk warning to avoid damage to buildings or danger to human lives.
Acknowledgements We would like to express our thanks to Csaba Molna´r and A´ da´m To´th for their collaboration in the field survey and data processing.
References
Advanced Geosciences, Inc. (2006) Instruction manual for EarthImager 2D, version 2.1.7, Resistivity and IP inversion software
Agnesi V, Camardab M, Conoscentia C, Di Maggio A, Dilibertoc I, Madoniac P, Rotiglianoa E (2005) A multidisciplinary approach to the evaluation of the mechanism that triggered the Cerda landslide.
(Sicily, Italy). Geomorphology 65:101–116
Ba´nyai L, U´ jva´ri G, Mentes G, Kova´cs M, Czap Z, Gribovszki K, Papp G (2014) Recurrent landsliding of a high bank at Dunaszekcs}o, Hungary: geodetic deformation monitoring and finite element modeling.
Geomorphology 210:1–13
Bie`vre G, Jongmans D, Winiarski T, Zumbo V (2012) Application of geophysical measurements for assessing the role of fissures in water infiltration within a clay landslide (Trieves area, French Alps).
Hydrol Process 26:2128–2142
Bugya T, Fa´bia´n Sz A´ , Go¨rcs NL, Kova´cs IP, Radva´nszky B (2011) Surface changes on a landslide affected high bluff in Dunaszekcs}o (Hungary). Cent Eur J Geosci 3(2):119–128. doi:10.2478/s13533-011-0014- 6
Caicedo B, Murillo C, Hoyos L, Colmenares JE, Berdugo IR (2013) Advances in unsaturated soils. Taylor and Francis, London, pp 165–169. ISBN 978-0-415-62095-6
Fa´bia´n SZA´ , Kova´cs J, Lo´czy D, Schweitzer F, Varga G, Baba´k K, Lampe´rt K, Nagy A (2006) Geomor- phologic hazards in the Carpathian foreland, Tolna County (Hungary). Stud Geomorphol Carpath Balc 40:107–118
Falco P, Negro F, Szalai S, Milnes E (2013) Fracture characterisation using geoelectric null-arrays. J Appl Geophys 93:33–42
Fan C, Liang S, Ma X (2012) Research advances on the loess-bedrock Landslide in China. In: Asia Pacific conference on environmental science and technology, Advances in biomedical engineering, vol 6 Francese R, Mazzarini F, Bistacchi A, Morelli G, Pasquare` G, Praticelli N, Robain H, Wardell N, Zaja A
(2009) A structural and geophysical approach to the study of fractured aquifers in the Scansano- Magliano in Toscana Ridge, southern Tuscany, Italy. Hydrogeol J 17:1233–1246
Fu¨si B, Madarasi A (2012) Landslide monitoring with combined methodology: geoelectrical anisotropy, PSInSAR and high precision leveling in Dunaszekcs}o, Hungary, American Geophysical Union, Fall Meeting 2012, abstract#NH13A-1596
Galli L (1952) A dunai e´s balatoni magaspartok a´lle´konysa´ga´nak to¨rve´nyszer}use´gei (The rules of the stability of high bluffs along the Danube and Lake Balaton). Hidrol Ko¨zlo¨ny 32:409–415
Gyulai A´ , Szabo´ NP (2014) Series expansion based geoelectric inversion methodology used for geoin- veronmental investigations. Front Geosci 2(1):11–17
Gyulai A´ , Baracza MK, Szabo´ NP (2014) On the application of combined geoelectric weighted inversion in environmental exploration. Environ Earth Sci 71:383–392
Heged}us E (2008) A megcsu´szott dunaszekcs}oi lo¨szfal aktı´v e´s passzı´v szeizmikus vizsga´lata (Active and passive seismic investigation of the slipped loess bluff at Dunaszekcs}o). Technical report, Eo¨tvo¨s Lora´nd Geofizikai Inte´zet
Jones G, Sentanac P, Zielinski M (2014) Desiccation cracking using 2-D and 3-D electrical resistivity tomography: validation on a flood embankment. J Appl Geophys 106:196–211
Jongmans D, Garambois S (2007) Geophysical investigation of landslides: a review. Bull Soc Ge´ol Fr 33:101–112
Kraft J (2005) A dunaszekcs}oi To¨ro¨klyuk kialakula´sa e´s fennmarada´sa (Evolution and survival of the To¨ro¨klyuk cave at Dunaszekcs}o). Mecsek Egyesu¨let E´ vko¨nyve a 2004-es egyesu¨leti e´vr}ol. U´ j E´vfo- lyam 8:133–153
Lapenna V, Lorenzo P, Perrone A, Piscitelli S, Rizzo E, Sdao F (2005) 2D electrical resistivity imaging of some complex landslides in Lucanian Apennine chain, southern Italy. Geophysics 70:B11–B18
Lebourg T, Binet S, Tric E, Jomard H, El Bedoui S (2005) Geophysical survey to estimate the 3D sliding surface and the 4D evolution of the water pressure on part of a deep seated landslide. Terra Nova 17:399–406
Moyzes A, Scheuer G (1978) A dunaszekcs}oi magaspart me´rno¨kgeolo´giai vizsga´lata (Engineering geo- logical investigation of the high bank at Dunaszekcs}o). Fo¨ldt Ko¨zlo¨ny 108:213–226
Pe´csi M, Scheuer G (1979) Engineering geological problems of the Dunau´jva´ros loess bluff. Acta Geol Hung 22:345–353
Pe´csi M, Schweitzer F, Scheuer G (1979) Engineering geological and geomorphological investigations of landslides in the loess bluffs along the Danube in the Great Hungarian Plain. Acta Geol Hung 22:327–343
Perrone A, Lapenna V, Piscitelli S (2014) Electrical resistivity tomography technique for landslide inves- tigation: a review. Earth Sci Rev 135:65–82
Solberg IL, Hansen L, Ronning JS, Haugen ED, Dalsegg E, Tonnesen JF (2012) Combined geophysical and geotechnical approach to ground investigations and hazard zonation of a quick clay area, mid-Norway.
Bull Eng Geol Environ 71:119–133
Szalai S, Szokoli K, Metwaly M (2014) Delineation of landslide endangered areas and mapping their fracture systems by the pressure probe method. Landslides 11(5):923–932
Szalai S, Szokoli K, Metwaly M, Gribovszki Z, Pra´cser E (2016) Prediction of the location of future rupture surfaces of a slowly moving loess landslide by electrical resistivity tomography, Geophysical prospecting. Version of Record online: 25 Aug 2016. doi:10.1111/1365-2478.12421
Szanyi, G, Gra´czer Z, Ba´nne´ Gy}ori E, Kala´b Z, Lednicka´ M (2016) Ambient seismic noise tomography of a loess high bank at Dunaszekcs}o (Hungary). Pure Appl Geophys 173(8):2913-2928. ISSN 0033-4553 Tofani V, Segoni S, Agostini A, Catani F, Casagli N (2013) Technical note: use of remote sensing for
landslide studies in Europe. Nat Hazards Earth Syst Sci 13:299–309
Uhlemann S, Wilkinson PB, Chambers JE, Maurer H, Merrit AJ, Gunn DA, Meldrum PI (2015) Interpo- lation of landslide movements to improve the accuracy of 4D geoelectrical monitoring. J Appl Geo- phys 121:93–105
U´ jva´ri G, Mentes G, Ba´nyai L, Kraft J, Gyimo´thy A, Kova´cs J (2009) Evolution of a bank failure along the River Danube at Dunaszekcs}o, Hungary. Geomorphology 109:197–209
Zhou B, Dahlin T (2003) Properties and effects of measurement errors on 2D resistivity imaging surveying.
Near Surf Geophys 1:105–117
Zilahi-Sebess L, Kova´cs AC, Gu´thy T, Heged}us E, Csabafi R (2009) Komplex geofizikai vizsga´latok a megcsu´szott dunaszekcs}oi lo¨szfal ko¨rnyezete´ben, VII. Fo¨ldtani Vesze´lyforra´sok Konferencia, 2009