Community assessment to advance computational prediction of cancer drug combinations
in a pharmacogenomic screen
Michael P. Menden
1,2,185,187, Dennis Wang
1,3,187, Mike J. Mason
4,187, Bence Szalai
5,6,7,187,
Krishna C. Bulusu
1,187, Yuanfang Guan
8,187, Thomas Yu
4, Jaewoo Kang
9, Minji Jeon
9, Russ Wol
finger
10, Tin Nguyen
11, Mikhail Zaslavskiy
12, AstraZeneca-Sanger Drug Combination DREAM Consortium
†,
In Sock Jang
4, Zara Ghazoui
1, Mehmet Eren Ahsen
13, Robert Vogel
13, Elias Chaibub Neto
4, Thea Norman
4, Eric K.Y. Tang
1, Mathew J. Garnett
14, Giovanni Y. Di Veroli
15, Stephen Fawell
16, Gustavo Stolovitzky
13,17, Justin Guinney
4,188, Jonathan R. Dry
16,188& Julio Saez-Rodriguez
2,7,186,188The effectiveness of most cancer targeted therapies is short-lived. Tumors often develop resistance that might be overcome with drug combinations. However, the number of possible combinations is vast, necessitating data-driven approaches to find optimal patient-specific treatments. Here we report AstraZeneca’s large drug combination dataset, consisting of 11,576 experiments from 910 combinations across 85 molecularly characterized cancer cell lines, and results of a DREAM Challenge to evaluate computational strategies for predicting synergistic drug pairs and biomarkers. 160 teams participated to provide a comprehensive methodological development and benchmarking. Winning methods incorporate prior knowledge of drug-target interactions. Synergy is predicted with an accuracy matching bio- logical replicates for >60% of combinations. However, 20% of drug combinations are poorly predicted by all methods. Genomic rationale for synergy predictions are identified, including ADAM17 inhibitor antagonism when combined with PIK3CB/D inhibition contrasting to synergy when combined with other PI3K-pathway inhibitors in PIK3CA mutant cells.
https://doi.org/10.1038/s41467-019-09799-2 OPEN
1Oncology, IMED Biotech Unit, AstraZeneca, Cambridge SG8 6EH, UK.2European Bioinformatics Institute, European Molecular Biology Laboratory, Cambridge CB10 1SD, UK.3Sheffield Institute for Translational Neuroscience, University of Sheffield, Sheffield S10 2TN, UK.4Sage Bionetworks, Seattle, WA 98121, USA.
5Department of Physiology, Faculty of Medicine, Semmelweis University, Budapest 1085, Hungary.6Laboratory of Molecular Physiology, Hungarian Academy of Sciences and Semmelweis University (MTA-SE), Budapest 1085, Hungary.7RWTH Aachen University, Faculty of Medicine, Joint Research Center for Computational Biomedicine, Aachen 52062, Germany.8Department of Computational Medicine and Bioinformatics, University of Michigan, Ann Arbor 48109, USA.9Department of Computer Science and Engineering, Korea University, Seoul 02841, Korea.10SAS Institute, Inc, Cary, NC 27513, USA.11Department of Computer Science and Engineering, University of Nevada, Reno 89557, USA.12Independent Consultant in Computational Biology, Owkin, Inc., New York, NY 10022, USA.13IBM Thomas J. Watson Research Center, Yorktown Heights, New York 10598, USA.14Wellcome Trust Sanger Institute, Hinxton CB10 1SA, UK.
15Early Clinical Development, IMED Biotech Unit, AstraZeneca, Cambridge SG8 6EH, UK.16Oncology, IMED Biotech Unit, AstraZeneca, R&D Boston, Waltham, MA 02451, USA.17Department of Genetics and Genomic Sciences, Icahn School of Medicine at Mount Sinai, New York 10029, USA.185Present address: Institute of Computational Biology, Helmholtz Zentrum München - German Research Center for Environmental Health, Munich D-85764, Germany.186Present address:
Heidelberg University, Faculty of Medicine, Institute for Computational Biomedicine, Bioquant, 69120 Heidelberg, Germany.187These authors contributed equally:
Michael P. Menden, Dennis Wang, Mike J. Mason, Bence Szalai, Krishna C. Bulusu, Yuanfang Guan.188These authors jointly supervised this work: Justin Guinney, Jonathan R. Dry, Julio Saez-Rodriguez.†A full list of consortium members appears at the end of the paper. Correspondence and requests for materials should be addressed to J.G. (email:justin.guinney@sagebionetworks.org) or to J.R.D. (email:jonathan.dry@astrazeneca.com)
or to J.S.-R. (email:julio.saez@bioquant.uni-heidelberg.de)
1234567890():,;
P
ersonalized treatment matching targeted drugs to a tumor’s genetics has resulted in remarkable responses. Unfortu- nately, most patients’tumors develop resistance leading to disease relapse. There are multiple mechanisms that may lead to drug resistance1 that include genetic and non-genetic hetero- geneity inherent in advanced cancers, coupled with complex feedback and regulatory mechanisms, and dynamic interactions between tumor cells and their microenvironment. Any single therapy may be limited in its effectiveness, but drug combinations are hypothesized to potentially overcome drug resistance and lead to more durable responses in patients. The molecular makeup of cancer cells and the mechanisms driving resistance will influence the optimal combination of mechanisms to target1–3.High-throughput preclinical approaches are crucial to deter- mine and evaluate effective combination strategies. While empirical experiments are important for observing potential synergistic properties across drug pairs, the possible number of combinations grows exponentially with the number of drugs under consideration. This is further complicated by the influence of disease and cellular contexts, rendering it impractical to cover all possibilities with undirected experimental screens4. Compu- tational approaches for predicting drug synergy are critical to guide experimental approaches for discovery of rational combi- nation therapy5.
A number of approaches have been developed to model drug combination synergy using chemical, biological, and molecular data from cancer cell lines6,7but with limited translatability to the clinic. A key bottleneck in the development of such models has been a lack of public data of sufficient size and variety to train computational approaches4,8, particularly considering the diver- sity of biological mechanisms that may influence drug response.
A further limit to the translatability of many computational approaches is their reliance on data features that may not be present during the course of patient care, such as on-treatment tumor molecular profiles.
To accelerate the understanding of drug combination synergy, Dialog for Reverse Engineering Assessments and Methods (DREAM) Challenges partnered with AstraZeneca and the Sanger Institute to launch the AstraZeneca-Sanger Drug Combination Prediction DREAM Challenge. DREAM Challenges (dreamchal- lenges.org[www.dreamchallenges.org]) are collaborative compe- titions that pose important biomedical questions to the scientific community, and evaluate participants’ predictions in a statisti- cally rigorous and unbiased way, emphasizing model reproduci- bility, and methodological transparency9.
This Challenge was designed to explore fundamental traits that underlie effective combination treatments and synergistic drug behavior. Specifically, it was structured to address the following translational questions using data available prior to drug treat- ment (mirroring a clinically relevant scenario to direct ther- apeutic choice): [i] how to predict whether a known (previously tested) drug combination will be effective for a specific patient;
[ii] how to predict which new (untested) drug combinations are likely to yield synergistic behaviors in a patient population; and [iii] how to identify novel biomarkers that may help reveal underlying mechanisms related to drug synergy.
We shared with the scientific community 11,576 experimen- tally tested drug combinations on 85 cancer cell lines. Molecular data was provided for the untreated (baseline) cell lines, alongside chemical information for the respective drugs. Participants used the described data to train and test models, and were encouraged to extend computational techniques to leverage a priori knowl- edge of cellular signaling networks.
In this manuscript, we report on the results of this Challenge where we have identified novel and performant methods using a rigorous evaluation framework on previously unpublished data.
We describe the details of these approaches, as well as general trends arising from the meta-analysis of all submissions. The full dataset, along with methods and scoring functions, are freely provided to the research community, and available to benchmark future algorithms in the field. Finally, we describe putative mechanistic models derived from the observed predictive features underlying synergistic responses, particularly between receptor tyrosine kinase and PI3K/AKT pathway inhibitors.
Results
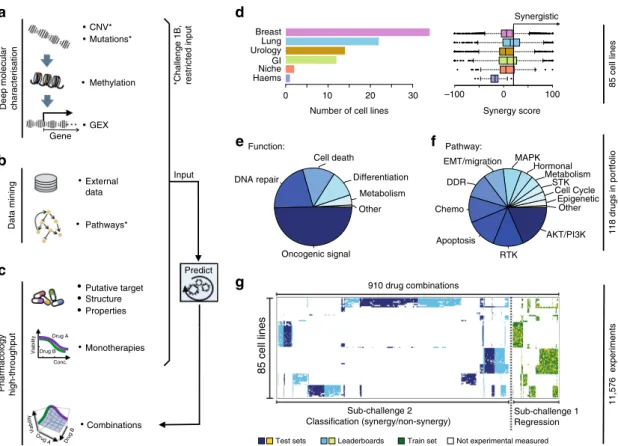
A large high-throughput drug combination screen. We collated a combinatorial drug sensitivity screen comprising 11,576 experiments each measured in a 6-by-6 dose matrix (Methods) across 85 cancer cell lines. A synergy and an antagonism dis- tribution (Loewe reference model10,11) were calculated and summarized via a single score for each experimental matrix (Methods; Supplementary Fig. 1 and Supplementary Data 1). The resulting dataset included highly reproducible cell viability response measurements and synergy scores for 910 pairwise combinations of 118 drugs (Supplementary Fig. 2 and Methods), plus information on the drugs including putative drug targets and their chemical properties. We also integrated deep molecular characterization of these same cell lines, including somatic mutations, copy-number alterations, DNA methylation, and gene expression profiles (Fig.1a–c) measured before drug treatment12. The 85 cell lines were predominantly derived from tumors of the breast (N=34), lung (N=22), bladder (N=14), and the gastrointestinal tract (N=12) (Fig. 1d). Drug synergy score distributions varied across disease types (Fig. 1d); in particular lung cell lines had over twofold higher mean synergy than breast cell lines (t-test P=7e-27). Of the 118 drugs tested, 59 were targeted therapies against components of oncogenic signaling pathways (Methods), 15 of which target receptor tyrosine kinases (RTKs), 22 target PI3K/AKT signaling, and 9 target MAPK signaling (Fig. 1e, f). Across the pairwise drug combination experiments, 88% (N=797) of the unique pairs had drug targets within the same signaling pathway and demonstrated markedly overall higher synergy scores (average of 17.3 vs. 7.3,t-testP= 2e–18) than the remaining 12% (N=113) whose drug targets were defined to be in distinct pathways. As part of the Challenge design, we ensured that drug targeted pathways and cancer types were proportionally distributed across sub-challenges and train- ing/test datasets (Fig. 1g). Sparsity in the cell line drug combination data matrix (Fig. 1g) resulted as several drug combinations were selectively profiled in clinically relevant cancer cell lines, e.g., ESR1 inhibitors were predominantly combined with other drugs in estrogen receptor-positive breast cancer cell lines since these agents are standard of care within this cancer subtype.
Comparison of AZ-DREAM to published combination screens.
We compared the AstraZeneca-DREAM (AZ-DREAM) challenge dataset with the independently published in vitro combination screening studies by O’Neil et al.4 and ALMANAC13. All three studies used different experimental designs and protocols (Fig.2a and Supplementary Table 1), with AZ-DREAM exploring screens with a 5-by-5 concentration titration format, O’Neill et al.4 a 4- by-4 format, and ALMANAC a 3-by-3 format. The overlap is limited in cell lines, targets and drugs explored: 10 cells and 7 targets, 4 drugs and 0 combination-cell pairs shared between AZ- DREAM and O’Neil et al.4; and 15 cells, 28 targets, 19 drugs, and 10 combination-cell pairs shared between AZ-DREAM and ALMANAC. AZ-DREAM provides greater coverage of targeted agents and greater numbers of cell lines per tumor type (Sup- plementary Table 1).
For the AZ-DREAM and ALMANAC comparison, only nine experiments passing quality control (Supplementary Methods) had the same combination tested in the same cell line, comprising gefitinib combined with either tamoxifen, fulvestrant, vorinostat, crizotinib, or everolimus, and tested in two breast cancer cell lines (MCF7 or T47D). Encouragingly, all but one experiment were concordantly identified synergistic with the same effect signs seen
in AZ-DREAM and ALMANAC (Fig. 2b). Within the nine overlapping experiments, 38 titrations were identically used by both ALMANAC and AZ-DREAM (Supplementary Fig. 3 and Supplementary Fig. 4a). For these 38 titrations we observed a correlation >0.7 (Fig. 2c and P< 10−7, test for association) between cell viability measures from AZ-DREAM and ALMA- NAC, maintained for individual combinations and cell lines
Gene GEX CNV*
Mutations*
Methylation
•Combinations Monotherapies Deep molecular characterisation
Pharmacology high-throughput
Breast Lung Urology GI Niche Haems
0 10 20 30
Number of cell lines
a d
e
g
118 drugs in portfolio
f b
85 cell lines
External data
Pathways*
Data mining
Putative target Structure Properties
Drug A Drug B Viability
Viability
Drug A Drug B
c
*Challenge 1B, restricted input
Conc.
–100 0 100
Synergy score
Input
Predict
Synergistic
Test sets
11,576 experiments
Leaderboards Train set Not experimental measured Other
Metabolism Differentiation Cell death
DNA repair
Oncogenic signal
Other Epigenetic Cell Cycle STK Metabolism Hormonal EMT/migration MAPK
DDR
Chemo
Apoptosis RTK
AKT/PI3K
Function: Pathway:
Sub-challenge 1 Regression Sub-challenge 2
Classification (synergy/non-synergy)
85 cell lines
910 drug combinations
Fig. 1Drug combinations and cell lines profiled.aMolecular characterization of the cell lines included genetics, epigenetics, and transcriptomics.
bParticipants were encouraged to mine external data and pathway resources.cParticipants were provided the putative targets for all and chemical structures for ~1=3of drugs (with this manuscript structures are now provided for all drugs).dThe cell line panel contained 85 cell lines from six different cancer types, combination synergy scores capped within a range of−100 to 100.eThe drug portfolio comprised approximately half oncogenic signaling targeting agents, and half cytotoxic drugs of which 14 were untargeted chemotherapies.fDrugs split by the putative targeted pathway.gSparse data was split into training set, leaderboard, and independent test set for SC1 and SC2
–30 –20 –10 0 10 20 30 40
–5 0 5 10 15
MCF7 T47D
Crizotinib
Fulvestrant
Tamoxifen
Tamoxifen Everolimus Vorinostat
20 40 60 80 100
60 70 80 90 100
Experiments:
Fulvestrant in mcf7 Fulvestrant in t-47d Tamoxifen in mcf7 Tamoxifen in t-47d Vorinostat in mcf7 Crizotinib mcf7 Crizotinib in t-47d
ALMANAC synergy scores
AstraZeneca-DREAM synergy scores
a b c Drug combinations of gefitinib + drug X
(cell viability of identical drug conc.)
ALMANAC cell viability [%]
AstraZeneca-DREAM cell viability [%]
Spearman = 0.70 (P = 7.92e–7) Pearson = 0.71 (P = 6.92e–7) Drug combinations of gefitinib + drug X
(synergy scores)
log10(conc.) [µM]
3
–2 –1 0 1 2
AstraZeneca-
DREAM O’Neil et al. ALMANAC Maximal used drug concentrations
Fig. 2Reproducibility of independent in vitro drug combination datasets.aComparison of the maximum drug concentration used in the AZ-DREAM, O’Neil et al.4and ALMANAC datasets.bSynergy scores of identical drug combinations in AZ-DREAM and ALMANAC. Horizontal and vertical striped lines mark the threshold for synergistic and antagonistic, where positive and negative scores confirm synergy and antagonism, respectively.cShows cell viability for each of the 38 overlapping experimental titration points that are identical in AZ-DREAM and ALMANAC across the nine drug combination experiments, significance calculated with test for association (Supplementary Fig. 3)
where the number of data points was sufficient (Supplementary Fig. 4).
While there were ten cell lines and four drugs found in both AZ-DREAM and O’Neil et al.4, no combination-cell experiment was shared between those two screens. O’Neill et al.4 data displayed lower dispersion of synergy scores (Supplementary Fig. 2c, d) and fewer instances of extreme synergy scores. The technical reproducibility within these screens, however, was comparable, with a similar correlation observed between replicated experiments (Spearman=0.63 for O'Neil et al.,4 Spearman=0.56 for AZ-DREAM).
We derived a RECIST-like response measure from the AZ- DREAM in vitro data (see Methods) to enable comparison to in vivo response metrics for the eight overlapping combinations in patient-derived tumor xenograft (PDX) models published by Gao et al.8 (Supplementary Data 1 and Supplementary Fig. 5a).
We compared the % PDX models with synergy in Gao et al.4,8to the % cell lines with synergy in AZ-DREAM. A concordant trend was observed (Pearson r=0.34,P=0.42; Methods; Supplemen- tary Fig. 5b), although too few combinations were shared between the datasets to conclude with statistical confidence.
Benchmarking of methods reveal high prediction accuracy. The Challenge was divided into two primary sub-challenges. In sub- challenge 1 (SC1) participants were asked to predict continuous synergy scores for drug combinations for which training data on those same combinations were available. In sub-challenge 2 (SC2), participants were asked to predict binary synergy status on drug combinations for which no training data was provided, thereby requiring participants to infer synergy using transferable data/knowledge patterns identified from previously seen
independent drug pairs. SC1 was further subdivided into two parts: SC1A allowed the use of all available data for model pre- diction, while SC1B limited data use to just mutation and copy- number variation (mimicking current clinical assay feasibility).
A total of 969 participants of diverse geography and expertize registered for the Challenge (Supplementary Fig. 6a, b). One- hundred sixty teams submitted across any portion of the Challenge and 78 teams submitted for final assessment.
Specifically, SC1A receivedfinal submissions from 76 teams, 62 for SC1B and 39 for SC2.
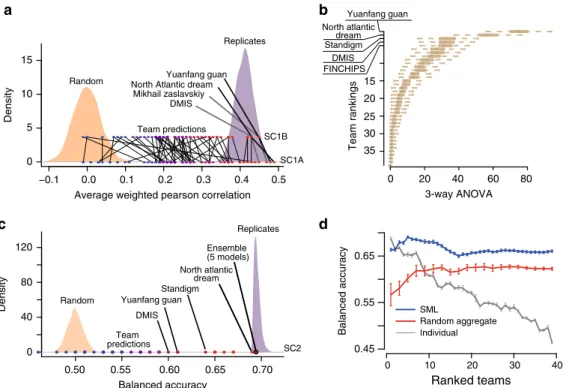
As scoring metric we used the average weighted Pearson correlation between the continuous endpoints of predicted and known synergy values for SC1, and both the–log10(p) from a 3- way analysis of variance (ANOVA) and balanced accuracy (BAC) for SC2 where predictions were binary (Methods). Across all teams, mean performance scores were r=0.24 ± 0.01 and r= 0.23 ± 0.01 (weighted Pearson correlation ± standard error) for SC1A and SC1B, respectively, and –log10(p)=12.6 (3-way ANOVA) for SC2. Despite omitting several input data types, teams performed only slightly worse for SC1B,Δprimary metric
=0.01 (t-test P=0.90), compared to SC1A (Fig. 3a and Supplementary Fig. 6c, d). While teams employed many different methodological approaches to modeling drug synergy—including regression, decision trees, random forests, Gaussian processes, SVM, neural networks, text mining, mechanistic network-based, and others (Supplementary Fig. 7a)—algorithm class showed little relationship to performance (Supplementary Fig. 7b). The top winning team in all three sub-challenge was Yuanfang Guan (Y Guan) with primary metrics of 0.48, 0.45, and 74.89 in SC1A, SC1B, and SC2, respectively. Based on the primary metric in SC2, Y Guan performed considerably better (Methods; >5 Bayes Factor, based on bootstrapped metrics’comparisons) than other
−0.1 0.0 0.1 0.2 0.3 0.4 0.5
0 5 10 15
Random
Replicates
Team predictions
Average weighted pearson correlation
Random
Replicates
c d
a
SC1B
b
Yuanfang guan North Atlantic dream
Mikhail zaslavskiy DMIS
DMIS Standigm
SC1A
0 10 20 30 40
0.45 0.55 Ensemble 0.65
(5 models)
SC2 Yuanfang guan
0 40 80 120
Team predictions
0.50 0.55 0.60 0.65 0.70
SML
Random aggregate Individual
Ranked teams Balanced accuracy
Density Density Balanced accuracy
0 20 40 60 80
3-way ANOVA Yuanfang guan
North atlantic dream
North atlantic dream
Standigm DMIS FINCHIPS
15 20
35 30 25
Team rankings
Fig. 3Performance of teams in the AstraZeneca-DREAM challenge.aParticipant performance in SC1A and SC1B—the distribution of performance of random predictions was used to estimate a lower limit, and the distribution of synergy correlations between biological replicates were used to estimate the upper limit.bParticipant performance ranked in SC2 based on the primary metric, 3-way ANOVA. Distribution of bootstrap prediction performances for each team are shown by each boxplot with the dot showing their actual performance.cParticipant performance plotted with upper and lower limits for SC2 based on the tie-break metric.dEnsemble models compared to the performance of individual models ranked from best to poorest performing in SC2. SML is an ensemble of the best performing models based on estimation of their BAC. Random Aggregation is an ensemble combining a random combination of models. Standard error of mean represented by error bars are estimated from ten random splits of the data
teams (Fig.3b). All performance statistics and team rankings are available at the Challenge website (synapse.org/DrugCombina- tionChallenge[https://www.synapse.org/#!Synapse:syn4231880/
wiki/235649]).
To benchmark the performance of teams in thefinal rounds of SC1A/B and SC2, we established lower and upper bounds of performance. We defined the lower bound as the null model, i.e., random permutation of the synergy data across each cell line (see
‘Code availability’’section). We would not expect algorithms to predict better than the reproducibility observed between replicate experiments. We therefore identified cases for which replicate measurements (same drug/combination tested independently in the same cell line) were available and assessed the primary metric achieved when using one measure to predict the other. We set this metric value as our upper-bound. We observed that 83%, 85%, and 94% of submitted models performed better than random (Methods; 5% false discovery rate, FDR) for SC1A, SC1B, and SC2, respectively. Team performances varied widely, but remarkably the top 15 models (20%) submitted to SC1A all reached a performance level comparable to experimental replicates (primary metric=0.43; Fig. 3a), as did the top 13 models (21%) in SC1B. Proportionally fewer teams performed at the level of replicate experiments in SC2 based on the BAC, with North Atlantic Dream (NAD) achieving the best performance (BAC=0.688; Fig.3c).
Given the less robust performance of SC2, we assessed whether an ensemble method—based on an aggregation of all submitted models—could yield a better overall model, a phenomenon called
“wisdom of the crowd”9,14. By applying a Spectral Meta-Learner (SML)15 as our ensembl approach, we achieved a modest improvement in performance (BAC=0.693) over the best performing individual team (BAC=0.688), as well as an ensemble of randomly selected models (BAC=0.63, (Fig.3d).
Leveraging biological relationships improves predictions. A common strategy among top-performing teams (DMIS, NAD,
and Y Guan) was tofilter molecular features, leaving only those related to known cancer drivers for subsequent modeling (Sup- plementary Methods). These teams also consolidated pharma- cological and/or functional pathway information associated with the molecular drug target, enabling one drug’s model to learn from data generated for another drug with the same target (Y Guan16and NAD16–18).
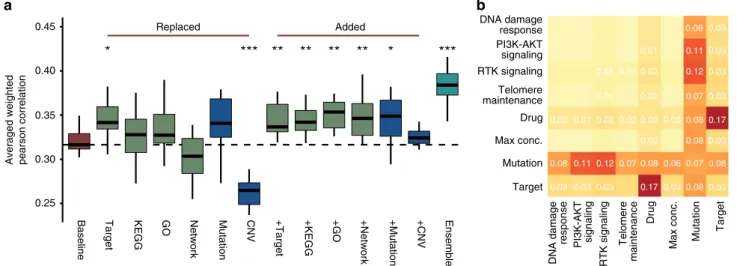
We took two approaches to analyze each feature type’s importance, particularly whether incorporating molecular fea- tures and chemical/biological knowledge can increase prediction accuracy. In the first approach, we generated a baseline model (following Team NAD’s method) utilizing only cell line and drug labels as input features as per SC1B. We then assessed changes in the primary metric after the substitution or addition of feature types (Fig. 4a and Supplementary Methods). In the second approach, we started with the DMIS model obtained from SC1B, and then iteratively removed single feature types and pairs of features to assess changes in prediction accuracy (Fig. 4b and Supplementary Methods).
Surprisingly, high primary metrics were observed for the NAD baseline model where the only input features were drug and cell line label (Fig. 4a, 0.32). Drug target was the only feature to improve performance of the NAD baseline model when swapped with drug label (Fig.4a,t-testP=0.012). Furthermore, removing both drug label and target resulted in the highest performance drop for the DMIS model (Fig.4b,−0.17). This result highlights the importance of the global cell-line state in predicting drug synergy, and how drug target information shared across drugs can facilitate transfer learning across separate models. Mutational and copy-number variation (CNV) data can similarly offer a barcode of cell identity to encode cell line label. However, where mutation data improved performance when replacing cell line labels, replacement with CNV decreased performance significantly (Fig.4a,t-testP=8.8e-6). Importantly, in all cases additional feature data increased performance when added to the NAD baseline model (Fig.4a,t-testP=0.009, 0.009, 0.002, 0.008, 0.021 adding drug target, KEGG pathway, Gene Ontology,
0.25 0.30 0.35 0.40
0.45 DNA damage
response
DNA damage response PI3K-AKT
signaling
PI3K-AKT signaling RTK signaling
RTK signaling
Telomere maintenance
Telomere maintenance Drug
Drug
Max conc.
Max conc.
Mutation
Mutation
Target
Target
0.17
0.17
0.11 0.12
0.11 0.12
0.03 0.03 0.03 0.030.080.03 0.08 0.070.08 0.080.070.08
0.08 0.08 0.08
0.07
0.03 0.03 0.03 0.03 0.03
0.01
0.01 0.01 0.01
0.01
0.02
0.02 0.02 0.02 0.02 0.02
0.02
0.02
a b
* *** ** ** ** ** * ***
Baseline Target KEGG GO Network Mutation CNV +Target +KEGG +GO +Network +Mutation +CNV Ensemble
Replaced Added
Averaged weighted pearson correlation
Fig. 4Feature impact. Drug target annotation is key in top-performing algorithms, as is the meta information about variants including their functional impact and tumor driver gene status.aCross validation-based distributions of NAD primary metric of SC1B when replacing or adding drug/cell line label with respective features. NAD baseline model (red) used cell line labels and drug labels only as feature inputs. In the other models different drug specific (drug targets, drug target KEGG pathway memberships, drug target-associated Gene Ontology terms or direct interactions between drug targets in a signaling network) or cell line specific (mutations or CNVs of selected, cancer related genes) features (green and blue, respectively) were added either in place of or in addition to the baseline model features. Ensemble model (cyan) is the averaged prediction of the different models. Single asterisks refers tot-testP< 0.05, double asterisks forP< 0.01, and triple asterisks forP< 0.001 compared to baseline model.bHeatmap of decrease in performance (average weighted Pearson correlation) of SC1B for DMIS support vector regression method when a particular feature type is removed (diagonal) or two feature types are removed at once (off diagonal)
signaling network, and mutation features, respectively). Ensemble of different feature sets improved prediction most when collectively increasing coverage of biological (pathway) complex- ity (Fig.4a,t-testP=1.2e-6).
Inspecting consistently poorly predicted drug combinations.
While a global performance metric applied to all cell-lines and drug combinations provides a broad assessment of model pre- diction accuracy, we hypothesized that some models may be optimized for certain subclasses of combinations and/or tumor types. We assessed the Pearson correlation between predicted and observed synergy scores for each combination in SC1A/B, and clustered teams by correlation of performance across combina- tions. Of the 118 combinations that had observed synergy scores
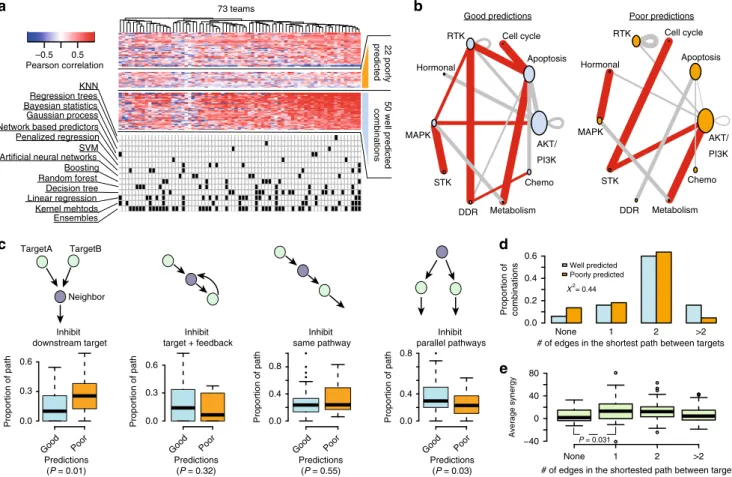
>20 in more than one cell line, we identified 22 combinations predicted poorly by all participants (Fig.5a, Methods), and over 50 combinations predicted well across all teams.
Combinations tested across a higher diversity of tumor types tended to show lower overall performance (Supplementary Fig. 8a; t-test P=0.04), indicating that a pan-cancer prediction presents a more difficult prediction task. Combinations tested across more tumor types were also tested across greater numbers of experiments (Supplementary Fig. 8b; Spearman=0.56,
P=2.3e–15), but no significant difference was observed between performance and number of experiments within a cancer type specific setting (Supplementary Fig. 8c, d). On average the quality assessment scores were significantly better (t-testP=0.018) for the pharmacology experiments in the training set of well predicted compared to poorly predicted combinations (Supple- mentary Fig. 8e). Comparable trends were seen between the quality of synergy and predictive performance in the training and test sets (Supplementary Fig. 8f; r=0.52 vs. 0.43). The distribution of synergy scores were similar between poorly and well predicted combinations (Supplementary Fig. 8g) as were the proportion of synergistic cases (37% for poorly predicted vs.
39% for well predicted).
Well predicted cases were enriched for combinations inhibiting both the PI3K/AKT and MAPK pathways (Fig. 5b, average Pearsonr=0.37 vs. 0.25;t-testP=0.008), or apoptosis pathway combined with either metabolism, cell cycle, or receptor tyrosine kinase pathways. The drugs targeting these pathways were prevalent in our dataset, but these specific combinations of those drugs were not (Supplementary Fig. 9a). Assessment of the interactions between drug targets and neighboring proteins from OmniPath, a comprehensive compendium of literature-based pathway resources19, revealed no differences in the somatic alteration frequency for targets or their first neighbors between
None 1 2 >2
−40 0 40 80
# of edges in the shortested path between targets
Average synergy
22 poorlypredicted
Pearson correlation
a b
c
Good predictions Poor predictions
73 teams
KNN Regression trees
Penalized regression SVM Artificial neural networks
Ensembles Kernel mehtods Linear regression Decision tree Random forest Boosting Network based predictors Gaussian process
Bayesian statistics combinations 50 well predicted
TargetA TargetB
Neighbor
Inhibit downstream target
Inhibit target + feedback
Inhibit same pathway
Inhibit parallel pathways
Proportion of path 0.0 0.6
0.3
Proportion of path 0.0 0.6
0.3
0.0 0.8
0.4
Proportion of path 0.0
0.8
0.4
Proportion of path
Good Poor Predictions (P = 0.01)
Good Poor Predictions
(P = 0.32)
Good Poor Predictions
(P = 0.55)
Good Poor Predictions
(P = 0.03) –0.5 0.5
None 1 2 >2
# of edges in the shortest path between targets Proportion of combinations
0.0 0.2 0.4 0.6
Well predicted Poorly predicted X2= 0.44
P = 0.031
e
AKT/
PI3K Apoptosis Cell cycle RTK
Hormonal
MAPK
STK
DDR Metabolism Chemo AKT/
PI3K Apoptosis Cell cycle RTK
Hormonal
MAPK
STK
DDR Metabolism Chemo
d
Fig. 5Features of poorly and well predicted combinations.aHeatmap of Pearson correlation between observed and predicted synergy scores for 118 combinations across 73 teams participating in SC1A/B. Algorithms used by each team is marked in the matrix below.bCombinations of pathways targeted. Size of node is proportional to number of drugs targeting a specific pathway in the entire dataset and width of edges is proportional to the number of drug combinations within the poorly or well predicted combination subset. Red edges highlight target pathway combinations unique to either the well predicted or poorly predicted combinations.cTypes of interactions between the nearest neighboring gene and the two drug targets of poorly and well predicted combinations. Boxplots show the difference in the proportion of interactions of each type for poorly and well predicted combinations (t-test).
dProportion of poorly and well predicted combinations for different network distances (minimum number of interactions in the OmniPath shortest path) between the two targets of a drug combination, difference significance estimated with chi-squared test.eDifference in average synergy for combinations categorized by the network distance between targets are tested witht-test
the poorly and well predicted combinations (Supplementary Fig. 9b, c). We did observe a significant enrichment of well predicted combinations where both drugs’respective targets were downstream of a common neighboring protein (Fig. 5c, t-test P=0.01), and conversely, we observed an enrichment of poorly predicted combinations where targets were both up-stream (Fig. 5c, t-test P=0.03). There was no significant difference (Chi-sqr P=0.44) in OmniPath protein network distance between drug targets for well and poorly predicted combinations (Fig. 5d), nor any correlation between either network distance and average/median synergy scores (Fig. 5e) or the number of cases with synergy >20. Combinations where targets were found to not be connected in a protein network had significantly lower average synergy (t-testP=0.031) and lower max synergy (t-testP=0.0021).
Biomarkers of drug combination synergies. A limitation of many machine learning algorithms is the lack of feature inter- pretability and experimentally testable logic-based rules. We took two approaches to identify biomarkers that may be predictive of drug synergies: a direct survey of participants through which predictive features were nominated for each drug pair (Supple- mentary Data 2); and retrospective work focusing on results from two of the best performing teams, NAD and DMIS, to decon- volute features most impactful to model predictions (Supple- mentary Fig. 10 and Supplementary Data 3).
The survey-submitted biomarker results varied in detail and depth (Supplementary Data 2), but common genetic markers were apparent across good predictions in SC1B, includingEGFR, ERBB2,PIK3CA, PTEN,TP53, orRB1. In the survey, synergy was commonly assigned to drug pairs targeting directly down- or up- stream of a mutated, amplified, overexpressed or deleted cancer gene. We hypothesized that drug synergy may result when one drug overcomes a resistance mechanism for the other. Focusing on mutations in cancer genes (as defined by Iorio et al.12) we identified all mutations associated with resistance to monother- apy in our data (Supplementary Methods and Methods) selected at increasingly stringent P-value (wilcoxon rank sum test) thresholds (Supplementary Methods and Methods). For each threshold, we then assessed the likelihood of synergy seen from combinations paired to these monotherapies in the presence vs.
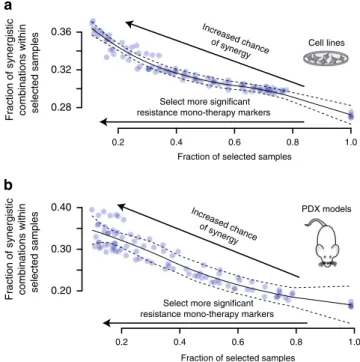
absence of the respective mutation. We observed an increase in the proportion of synergistic drug combinations with each increase in threshold stringency (Fig. 6a, Pearson r=−0.90, P
=4.09e-38). We observed the same trend in patient-derived xenograft (PDX) models (Fig. 6b, Pearson r=−0.95,P=2.2e- 49). This observation supports the notion that drug sensitivity may be restored with drug combinations targeting a resistance driver.
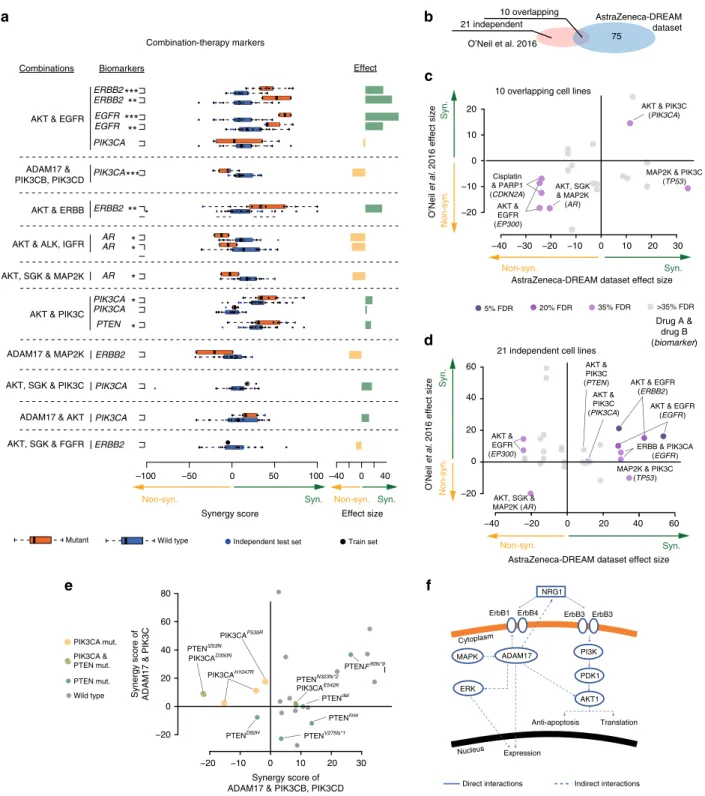
We also explored models of best performing teams and their chosen features, focusing on biomarker associations aligned to combinations for which the respective team had achieved a robust prediction accuracy (Pearson r> 0.5), with particular interest in the genetic biomarkers revealed through SC1B. Multiple criteria for quality, independence and reproducibility (Methods)4,8 were applied yielding 13 feature-to-combination associations (Fig. 7a and Supplementary Data 3), seven associated with synergy and six with non-synergy. To assess whether these associations could be independently validated as synergistic biomarkers, we explored nine overlapping and 21 non-overlapping (independent) cell lines in O’Neil et al.4(Fig.7b) that were treated with similar drug combinations, i.e., same putative drug targets. Concordance of association was observed in the nine overlapping cell lines (Fig.7c;
six out of seven associations, ~86%) and in the 21 independent cell lines (Fig.7d; eight out of eleven associations, ~72%).
Among the prioritized feature-to-combination associations were several genetic variants associated with synergistic responses to the combination of receptor tyrosine kinase (RTK) inhibitors with inhibitors of the downstream PI3K/AKT pathway. Ampli- fications or activating mutations inEGFRorERBB2consistently predicted synergy from inhibition of the RTK+PI3K/AKT pathways across multiple independent drugs and datasets (Fig.7a). Less direct relationships were also observed, including combined AKT inhibition with either IGFR inhibition in the ERBB2 mutant setting or FGFR inhibition in theEGFR mutant setting (Supplementary Data 3). Despite kinase domain homology it is unlikely these observations are explained by off-target effects sinceEGFR,ERBB2, andFGFRmutations were only predictive of respective monotherapy responses (Supplementary Fig. 11).
Combinations inhibiting multiple points within the PI3K/AKT pathway also showed synergy in the presence of up-stream activation from mutations in PIK3CA or deleterious events in PTEN(Fig.7a, e). Inhibition of the metalloproteinase ADAM17, known to influence RTK activity20, also showed synergistic responses in a common subset of cell lines when combined with inhibitors of PIK3C-pan or AKT1/2 (Fig.7a and Supplementary Data 3), with a notable exception of PIK3CB/D selective inhibitors, which show antagonism unique to PIK3CA mutant cell lines (Fig. 7e, f). Amplification and activating mutations in Androgen Receptor (AR) were also found to be associated with antagonistic effects when targeting AKT in combination with MAP2K or IGFR inhibitors (Fig. 7a).
Translatability of synergy and biomarker predictions. We assessed the performance of top-performing AstraZeneca- DREAM models on the independent screening datasets by O’Neil et al.4and ALMANAC13. Since no combination-cell experiments
0.2 0.4 0.6 0.8 1.0
0.28 0.32
0.36 Increased chance
of synergy
Fraction of selected samples Fraction of synergistic combinations within selected samples
0.2 0.4 0.6 0.8 1.0
0.20 0.30 0.40
Fraction of synergistic combinations within selected samples
Fraction of selected samples Increased chance
of synergy
Select more significant resistance mono-therapy markers
Cell lines
PDX models Select more significant
resistance mono-therapy markers
a
b
Fig. 6Drug synergy and monotherapy resistance biomarker relationship.
aCell lines andbPDX models show increased frequency of synergistic drug combinations if they contain biomarkers with stronger association to monotherapy resistance (Methods; Supplementary Methods). The fraction of combination experiments is selected by order of most significant linked monotherapy resistance biomarker associations. The solid and dashed line are the LOcal regrESSion (LOESS) curvefit and its standard error, respectively
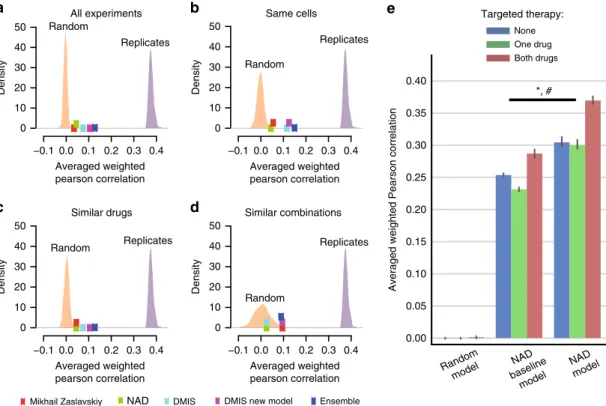
directly overlapped AZ-DREAM and O’Neil et al.4, we collapsed drugs by shared targets to expand the overlap. We observed that SC1A models from NAD and DMIS outperformed random models (Fig.8a, mean primary metric=0.07, top 1% of random models) for cell lines and drug target combinations non- overlapping between O’Neill et al. and AZ-DREAM data (Sup- plementary Data 1). Interestingly, no substantial performance increase was observed when independent model predictions were
made for the ten cell lines in common between the two datasets, nor the 30 combinations with similar chemical/target properties (Supplementary Table 2 and Fig. 8b–d). As in the main Chal- lenge, combining these two or more models in an ensemble led to an improved prediction performance (Fig. 8a–d).
Considering the limited overlap and correlation of synergies between AZ-DREAM and ALMANAC datasets, high perfor- mance was not expected when predicting ALMANAC synergy
d
e 80 f
−20 −10 0 10 20 30
−20 0 20 40 60
Synergy score of ADAM17 & PIK3CB, PIK3CD Synergy score of ADAM17 & PIK3C
PTENI253N PIK3CAD350N
PTENdel PTENloss PTENV275fs*1 PTENN323fs*2 PIK3CAE542K PIK3CAP539R
PTEND92H
PTENF90fs*9 PIK3CAH1047R
Independent test set
a
*
*
*
**
**
***
**
***
*****
Combinations Biomarkers
AKT & ERBB AKT & EGFR
ADAM17 &
PIK3CB, PIK3CD
AKT & ALK, IGFR
AKT, SGK & MAP2K
AKT & PIK3C ERBB2
EGFR PIK3CA
PIK3CA
ERBB2
AR AR
AR PIK3CA PIK3CA PTEN
Effect
ADAM17 & MAP2K ERBB2
AKT, SGK & PIK3C PIK3CA
ADAM17 & AKT PIK3CA AKT, SGK & FGFR ERBB2
–100 –50 0 50 100
Synergy score
–40 0 40
Effect size Syn.
Non-syn. Non-syn. Syn.
Mutant Wild type
EGFR ERBB2
Direct interactions Indirect interactions NRG1
ErbB3
ErbB1 ErbB4 ErbB3
ADAM17 PI3K
PDK1 AKT1 MAPK
ERK
Expression
Anti-apoptosis Translation Cytoplasm
Nucleus Train set
Combination-therapy markers
−20 0 20 40
−20 0 20 40 60
21 independent cell lines
AstraZeneca-DREAM dataset effect size
O’Neil et al. 2016 effect size
AKT & EGFR (ERBB2)
AKT & EGFR (EGFR)
ERBB & PIK3CA (EGFR) AKT &
PIK3C (PTEN)
MAP2K & PIK3C (TP53) AKT, SGK &
MAP2K (AR) AKT &
EGFR (EP300)
−40 60
Non-syn. Syn.
AKT &
PIK3C (PIK3CA)
Syn.Non-syn.
5% FDR 20% FDR 35% FDR
Drug A &
drug B (biomarker)
−20 −10 0 10 20 30
−20
−10 0 10
20 AKT & PIK3C
(PIK3CA)
MAP2K & PIK3C (TP53) Cisplatin
& PARP1 (CDKN2A) AKT &
EGFR (EP300)
AKT, SGK
& MAP2K (AR)
−30
−40
c
O’Neil et al. 2016 effect size Syn.Non-syn.
10 overlapping cell lines
AstraZeneca-DREAM dataset effect size Syn.
Non-syn.
10 overlapping
AstraZeneca-DREAM dataset O’Neil et al. 2016 75
21 independent
b
>35% FDR
PTEN mut.
Wild type PIK3CA mut.
PIK3CA &
PTEN mut.
Fig. 7Post-hoc analysis of putative synergy biomarkers.aSynergy markers suggested by DMIS and NAD, when focusing on top weighted features from predictive modelsfiltered for biological relatedness to drug targets, ANOVA with FDR of triple asterisks refers to 5%, double asterisks refers to 20% and single asterisks to 35%.bVenn-diagram showing independent and overlapping cell lines between AZ-DREAM and O’Neil et al.4. Independent dataset reproducibility of biomarker predictions incthe overlapping anddO’Neil et al.4exclusive cell lines. The effect size is the mean difference in synergy scores of mutant vs. wild-type cell lines.eComparison of ADAM17 combined with PIK3CB/D against ADAM17 in combination with pan-PIK3C inhibitor.
fNetwork cartoon of PI3K signaling and role of ADAM17
scores with models trained on AZ-DREAM data points alone, as was observed for the NAD model. We trained two NAD models on 50% of the ALMANAC data:first a baseline model to show maximum performance achievable when using only cell and drug label features as input; and a second allowing use of the full feature set as input. The full model consistently predicted significantly better than baseline in the remaining 50% over ten randomized iterations, giving confidence in the transferability of the method designed for AZ-DREAM. Best performance was observed for targeted combinations (r=0.369 vs. 0.287 for full NAD and baseline NAD model, ANOVA P=1.322e-31 for model type andP=5.5e-05 for model type and targeted therapy association, Fig.8e).
Exploring AZ-DREAM biomarker associations prioritized as described in earlier sections, we assessed statistical association for drug combinations with consistent targets in the O’Neil et al.4 dataset. In the ten cell lines overlapping the AZ-DREAM and O’Neil et al.4 datasets, seven of the prioritized biomarker- drug combinations were present, of which six (86%) showed reproducible directionality (FDR < 35%, Fig.7c). In the 21 O’Neil et al.4 cell lines not used within AZ-DREAM training, 11 of the prioritized biomarker-drug combinations were present, of which 8 (72%) showed reproducible directionality (Fig. 7d).
Discussion
The objective of this AstraZeneca-DREAM Challenge was to drive the development of innovative computational approaches to predict novel drug combinations and to comprehensively
benchmark these approaches. To enable this we made one of the largest in vitro drug combinatorial screens to date available to the scientific community. We cover largely non-overlapping experiments to existing datasets and, in particular, offer extensive data for targeted therapies complimenting the non-targeted chemotherapeutic agents covered in the NCI-ALMANAC.
Despite little overlap we demonstrated an encouraging reprodu- cibility of data and predictions between screens, particularly when considering the confounding differences in experimental designs and assay formats21. Furthermore, we showed that some trends represented in these data can be reproduced in vivo, and that clinically efficacious combination pairs can be identified.
Our double-blinded benchmark of 78 methods provides an unbiased comprehensive evaluation of the state-of-art of drug synergy prediction. Collectively this Challenge manuscript equips the scientific community with data and a methodological baseline for algorithm development, alongside a suite of computational methods to direct new experiments towards likely synergistic drug combinations.
The results of the AstraZeneca-Sanger Drug Combination Prediction DREAM Challenge have shed important light on the best practices and limitations in predicting drug synergy. By evaluating predictions from a large number of teams, we were able to discern important strategies for predicting drug synergy from molecular and chemical traits. As with most DREAM Challenges, we observed that the machine learning method itself has little impact on overall performance. Aggressive pre-filtering that incorporates clean sparse network data to consider feature relevance to drug targets and cancer was successfully used by top
−0.1 0.0 0.1 0.2 0.3 0.4 0
10 20 30 40 50
0 10 20 30 40 50
0 10 20 30 40 50 0 10 20 30 40 50
−0.1 0.0 0.1 0.2 0.3 0.4
−0.1 0.0 0.1 0.2 0.3 0.4 −0.1 0.0 0.1 0.2 0.3 0.4 Random
Replicates
Averaged weighted pearson correlation
Averaged weighted pearson correlation
Averaged weighted pearson correlation
Averaged weighted pearson correlation
Density
All experiments Same cells
Similar drugs Similar combinations
a b
c d
Random
Replicates
Random Replicates
Random
Replicates
Density
Density Density
e
Mikhail Zaslavskiy NAD DMIS DMIS new model Ensemble
NAD baseline
model
*, # None One drug Both drugs Targeted therapy:
0.00 0.40
0.35
0.30
0.25
0.20
0.15
0.10
0.05
Averaged weighted Pearson correlation
NAD model Random
model
Fig. 8Translatability of AstraZeneca-DREAM models to the independent screens. Performance of SC1A models for predicting synergy scores in the O'Neil et al.4dataset by the best performing teams are plotted along with distributions of predictions from the random model and replicate experiments.
Performance of predictions are shown foraall experiments in the O’Neil et al.4dataset, and three subsets of the dataset;bexperiments that tested same cell lines as AZ-DREAM,ctested similar drugs as in AZ-DREAM (one drug in the combination with the same target), anddtested similar combinations as in AZ-DREAM (same targets for both drugs in the combination).ePrediction performance on the ALMANAC13dataset is shown for a random, NAD baseline (using only cell line and drug identities as features) and full NAD model for no targeted agents (None, i.e., two chemotherapeutic drugs), one targeted agent plus chemo (One drug), and combinations of two targeted agents (Both drugs)(mean+/−95% CI). ANOVAP-values: *P=1.322e-31 for different performance between baseline and full model; #:P=5.584e-5 for association between model performance and number of targeted drugs in the combinations
performers to limit model complexity and improve model gen- eralizability. Despite the complexity of the problem, many teams reached the upper-bound of performance levels based on varia- bility in experimental replicates. This was further confirmed when top-performing models were applied to an independent dataset, demonstrating robustness to assay variability, and context heterogeneity.
A comprehensive assessment of the predictive value of monotherapy was not completed in the Challenge format, in part due to initial miss-annotation of data. However, post-hoc ana- lyses suggested it offered no significant improvement to well- performing models (Supplementary Fig. 12). Despite minimal predictivity from monotherapy itself as a feature, biomarkers associated with monotherapy resistance were observed to have predictive value for respective combinations. Looking forward, additional attention is also required for the one-fifth of combi- nations poorly predicted by all Challenge teams. The rationale differentiating these combinations is non-obvious but our data suggests, in part, some relationship to the complexity of network connectivity between drug targets and proximal biomarkers (Fig. 5c), perhaps a bias introduced by network-led dimension reduction techniques employed by well-performing models.
Furthermore higher synergy scores were observed—in some combinations—when both drugs target downstream of a com- monly interacting protein22. Collectively, these observations advocate for a more biologically rationalized approach to bio- marker discovery, accounting for directionality and exclusivity of signaling and functional relationships between biomarkers and targets.
A notable absence from the Challenge was the use of mathe- matical, reaction- or logic-based mechanistic pathway modeling approaches23–27, likely due to the higher time and data input needed for model creation. The dynamic nature of mechanistic models may offer an advantage by enabling consideration of the heterogeneity that exists across even apparently‘clonal’’cell line populations28. The increasing availability of published pre- derived mechanistic models for many cancer relevant pathways may soon make such an approach more viable. Given the strong benefit seen from inclusion of prior-knowledge, and as text-based artificial intelligence technology matures, computational approa- ches, such as natural language processing (NLP) to harness knowledge from world literature may also become of significant benefit. Alternatively, more generic signatures of dynamic (e.g., transcriptional) output mayfirst be used to identify a mechanistic rationale28–31 to which causative genetic or epigenetic events can then be inferred and aligned as predictive features32,33. A surprising result of our Challenge, however, suggested only modest improvement to prediction from inclusion of all data in SC1A compared to only genetics in SC1B.
To maximize potential for translation it is essential that modeling approaches reveal testable biological insight, parti- cularly considering that this and prior Challenges show no predictive advantage to black box algorithms. As we discovered, however, it can be difficult to incentivize knowledge retrieval within a competition format that focuses on objective scoring of performance. Despite these limitations, we were able to extract important insights to biomarkers for certain drug combinations. Given the dominance of RTK and PI3K/AKT pathway targeting agents in the Challenge data, it was not surprising that these revealed some of our strongest combination-feature relationships. In multiple cases this aligned to a two-hit hypothesis targeting the activating driver with a downstream pathway component. These included synergies between EGFR and AKT inhibitors in the presence of activating EGFR mutations34, or AKT1/2 with pan-PI3K inhibitors in the presence of pathway activating mutations
in PIK3CA or PTEN. In some cases the biomarker rationale for AKT inhibitor synergy with RTK or MAPK inhibition was less direct but indicative of crosstalk and feedback signaling previously reported35. Interestingly antagonism was observed in cell lines harboring activating mutations of AR36–39. Feed- back signaling resulting from AKT inhibition has been seen to drive AR activity, which in turn can lead to the activation of the MAPK cascade39,40, attenuating respectively targeting drug activity.
The synergy observed between ADAM17 and PI3K/AKT pathway inhibitors may work through independent inhibition of multiple cancer hallmarks, or via a more direct mechanism whereby inhibition of ADAM17 driven proteolysis and shedding of RTKs20 stabilizes and increases signaling through PI3K/
AKT41,42. Notably ADAM17 predominantly influences RTK’s other than EGFR/ERBB220, and no benefit is seen in cells with mutations in these genes. ADAM17 inhibition, however, showed antagonism unique to combined PIK3CB/D selective inhibitors within the PIK3CAmutant setting. Reduced synergy may result from a lessened dependency on PI3K paralogues in the presence of constitutively activated PIK3CA, or reduced benefit from ADAM17 loss in the extreme luminal/epithelial physiology of PIK3CA mutants. The apparent antagonism, however, suggests feedback following PIK3CB/D inhibition enhances mutant PIK3CAexpression/activity. Indeed PIK3CB inhibition has been shown to result in elevated expression and activity of PIK3CA43, and may also relieve the inhibitory effects of substrate competi- tion or dimerization between PIK3CA and PIK3CB/D.
Many drug combinations effective in the clinic to date involve mechanistically distinct agents, often chemotherapies combined with an additional targeted therapy, for which benefit may arise from the independent effects of the drugs on different sub- populations44 rather than synergy. More recently, an increasing number of combinations include multiple targeted therapies5. Hence, identifying both molecularly synergistic and com- plementary drugs, and how these affect inter- and intra-patient heterogeneity remains an essential area of future research. Future Challenges should further address the question of how to opti- mize translation of preclinical results into the clinic45. Where this Challenge addressed prediction of synergy for combinations of known drugs, an ability to predict truly novel beneficial target combinations should also be explored. Furthermore, the space of therapeutic combinations should be extended to include >2 drugs, and covering targets in independent cell types, such as subclonal tumor cell populations or cells of the tumor microenvironment and immune system3. These approaches can be complemented by adaptive and sequential strategies reactive to monitoring of the patient tumor and physiology. Success in these areas will be dependent on the availability and access to large-scale data needed for model development and validation. Public-private partnerships—as exemplified by this Challenge and AstraZeneca’s generous sharing of data with the research community—will be critical to future efforts.
Methods
Drug combination screening. All cell lines were authenticated at AstraZeneca cell banking using DNAfingerprinting short-tandem repeat assays and each bank is confirmed to be free from mycoplasma. Cells ordered from the global cell bank are cultured for up to 20 passages. Cell suspensions are counted using a haemocyt- ometer and cells are re-suspended in full growth medium containing Pen/Strep to afinal density for different cell line densities and for different seeding densities into 384-well cell culture plate. A volume of cells as determined by cell count and dependent on cell type was added to each well of a Greiner 384-well plate using a Multidrop Combi liquid handler and then incubated at 37 °C and 5% CO2
overnight in a rotating incubator. After seeding, plates were shaken to distribute the cells more evenly at the bottom of the wells and left to stand on the bench for 1 h to allow even settling of cells.