Identification of Sitobion avenae F. Resistance and Genetic Diversity of Wheat Landraces from Qinling Mountains, China
X.L. Liu, B.Y. Lu, C.Y. Wang,·Y.J. Wang, H. ZHang,·Z.R. Tian and W.Q. Ji* State Key Laboratory of Crop Stress Biology for Arid Areas, College of Agronomy, Northwest A&F
University, Yangling, Shaanxi 712100, China (Received 23 September 2016; Accepted 21 March 2017;
Communicated by A. Mohan)
The aphid Sitobion avenae F. is one of the most harmful pests of wheat growth in the world. A primary field screening test was carried out to evaluate the S. avenae resistance of 527 wheat landraces from Shaanxi. The results indicated that 25 accessions (4.74%) were resistant to S. avenae in the three consecutive seasons, of which accession S849 was highly resistant, and seven accessions were moderately resistant. The majority of S. avenae resistant accessions come from Qinling Mountains. Then, the genetic variability of a set of 33 acces- sions (25 S. avenae resistant and 8 S. avenae susceptible) originating from Qinling Mountains have been assessed by 20 morphological traits and 99 simple sequence repeat markers (SSRs). Morphological traits and SSRs displayed a high level of genetic diversity within 33 accessions. The clustering of the accessions based on morphological traits and SSR markers showed significant discrepancy according to the geographical distribution, resistance to S. avenae and species of accessions. The highly and moderately resistant lan- drace accessions were collected from the middle and the east part of Qinling Mountains with similar morphology characters, for example slender leaves with wax, lower leaf area, and high ear density. These S. avenae resistant landraces can be used in wheat aphid resistance breeding as valuable resources.
Keywords: wheat landraces, Sitobion avenae F., genetic diversity analysis, morphologi- cal traits, SSR
Introduction
Wheat is a major staple food crop in many parts of the world, whose yield and quality are highly vulnerable to many biotic stresses such as cereal aphids (Larsson 2005). Sitobion avenae F., English grain aphid (EGA), is an important insect pest which causes severe economic losses in worldwide wheat (Larsson 2005) and it is also one of the most harm- ful species in China (Ma et al. 2006). Insecticides provide a simple and effective strategy for controlling the aphid, with the environment pollution and natural ecological imbal- ance (Yu et al. 2012). Research has shown that the use of resistant wheat varieties is a very effective way to control aphid populations (Khan and Port 2008).
*Corresponding author; E-mail: jiwanquan2008@126.com; Phone: 86-29-87081319
The wheat landrace is one of the important genetic variation sources. Several reports have confirmed that wheat landraces should be an excellent cereal aphid resistance genes source (Li and Peng 2014; Liu et al. 2014). Among 70 bread wheat accessions mainly from central Asia, one Iranian wheat accession and two Iranian landraces showed high or moderate levels resistance to EGA (Li and Peng 2014). Liu et al. (2006) identified only 30 resistant accessions to EGA from 4600 wheat germplasm. Interestingly, the vast ma- jority of them were Shaanxi landraces. Furthermore, the Qinling Mountains, located in Southern Shaanxi province, is famous as an important biodiversity hotspots in China with the abundance and diversity of flora and fauna (Liu et al. 2014), including wheat species (Dong et al. 2003). However, little is known about genetic diversity and agro-morpholog- ical variation of wheat landraces from Qinling Mountains.
Diversity in genetic resources can commonly be identified by morphological traits and molecular marker. Morphological traits may describe some of the basic characteristics of germplasm, evaluating its diversity is a necessary way of mining and utilizing favorable genes. Genetic variation of wheat landraces is frequently detected by morphological traits (Sönmeoğlu et al. 2012; Ayala et al. 2016), such as plant height, flag leaf size, spike length and spike density. Simple sequence repeat (SSR) is one of the most widely used molecu- lar markers for determining genetic relationships among wheat genotypes (Dreisigacker et al. 2004; Zhang et al. 2006).
In this study, we evaluated S. avenae resistance of 527 wheat landrace accessions col- lected from different districts of Shaanxi province, China, and evaluated morphological traits and SSRs of 25 EGA-resistant and eight EGA-susceptible landrace accessions col- lected from Qinling Mountains. The purpose of our analysis was to detect potential ben- eficial germplasm for the aphid-resistance breeding of wheat and determine the genetic variability and relationship of accessions by using SSRs and morphological traits.
Materials and Methods Plant materials
The 527 wheat landrace accessions (Triticum turgidum and T. aestivum) were used in this study. The wheat landrace accessions were collected from different districts of Shaanxi provinces and preserved in the College of Agronomy, Northwest A&F University, China.
Sitobion avenae F. resistance screening
Evaluation of S. avenae resistance was carried out under field conditions during 2009 to 2012 in Yangling. The experiments were conducted according to the rules for resistance evaluation of wheat to diseases and insect pests, Part 7: Rule for resistance evaluation of wheat to aphids, Agriculture industry standard of the People’s Republic of China (NY/T 1443.7-2007) (Inspection and Quarantine Bureau of People’s Republic of China 2007).
Bread wheat cultivar Xiaoyan No. 6, a highly susceptible to EGA, was used as the control (CV). Each accession was laid out in a randomized complete block design with three
replications, and CV was planted in every nine accessions. About 20 seeds of each acces- sion were planted in two rows with one meter in length and 24 cm between the rows. The plots were surrounded by CV as a spreader. Pesticides were applied on the fields before building insect nets at the jointing stage, in order to remove possible influence from Schi- zaphis graminum and Rhopalosiphum padi Linnaeus (Liu et al. 2006). The evaluation procedure was the same as described by Liu et al. (2014).
Evaluation of agronomic characters
Twenty agronomic characters of randomly selected 10 plants were recorded in triplicate during the growth season and the data means were used for the analysis. These traits in- cluded twelve quantitative traits (plant height, culm width of main stem, flag leaf length, flag leaf width, flag leaf area, spike number per plant, spike length, spikelet numbers, ear density, grains per spike, awn length, and 1000-grain weight) and eight qualitative (flag leaf shape, leaf color, leaf wax, ear type, glume color, glume hairs, grain color and grain hardness). Analysis of variance was carried out on the data for comparison.
DNA extraction and SSR analysis
Genomic DNA was extracted from young leaf tissues using the CTAB method. SSR markers were selected and primers synthesized according to the information available from the GrainGenes Database (http://wheat.pw.usda.gov/). The PCR procedure was the same as described by Liu et al. (2012). The amplification products were analyzed using 8% polyacrylamide gel electrophoresis (PAGE) and visualized with silver staining and photographed.
Data analyses
The mean of the aphid number ratio, the standardized coefficients (α = 0.05), independent samples test and squared Euclidean distance were calculated by using the software SPSS 16.0. The evaluation of the relationship between aphid number ratio and morphological traits was performed using regression analysis. The allele number, allele frequency, poly- morphic information content (PIC) values and gene diversity of each locus, and genetic distances between individuals were calculated using the program PowerMarker V3.25.
Results
Identification and analysis of Sitobion avenae F. resistance
The results showed that all the 527 wheat landraces were non-immune to EGA, of which 25 (4.74%) accessions showed resistance in the three consecutive seasons (Table S1*).
Among them, S849 displayed high level resistance to EGA. Seven accessions (S1111,
*Further details about the Electronic Supplementary Material (ESM) can be found at the end of the article.
S1124, S1125, S1148, S1181, S992 and S328) were moderately resistant. Seventeen ac- cessions (S571, S616, S676, S698, S709, S819, S822, S821, S838, S876, S979, S1017, S1028, S1045, S1046, S1071 and S1125) were lowly resistant. All these EGA-resistant accessions were collected from Qinling Mountains. More interestingly, the highly resist- ant accession and six out of seven moderately resistant accessions (except S328) come from the eastern region of Qinling Mountains, Shaanxi Province.
Genetic diversity based on morphological traits analysis
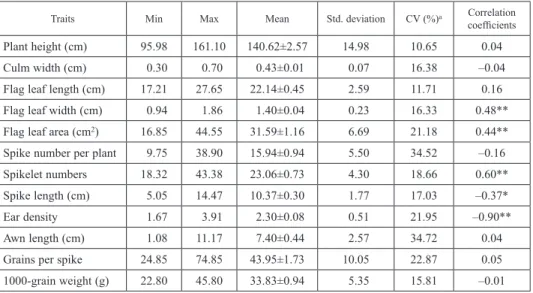
According to the aforementioned results, 25 resistant and eight susceptible wheat lan- draces that collected from Qinling Mountains (Table S1, Fig. S1), were further selected to analyze and evaluate morphological traits. The identified results showed that the variable coefficient (CV) value of 12 quantitative traits varied from 10.65 to 34.72, as listed in Table 1 and Table S2. From these tables, plant height and awn length had the lowest and the highest CV value, respectively. The results of regression analysis showed that aphid number ratio was significantly positively correlated with flag leaf width (r = +0.48), flag leaf area (r = +0.44) and spikelet numbers (r = +0.60); but negative correlated with spike length (r = –0.37) and ear density (r = –0.90). The independent samples test results showed that the average aphid numbers per cm2 of flag leaf in susceptible accessions (2.3) was significantly higher compared to that of highly and moderately resistant accessions (1.0) (t = 5.3, P < 0.01), and larger aphid numbers per cm of spike length of susceptible accessions (6.2) were detected compared with that of highly and moderately resistant ac- cessions (2.4) (t = 5.6, P < 0.01).
Table 1. Evaluation of quantitative characters of wheat landraces
Traits Min Max Mean Std. deviation CV (%)a Correlation
coefficients
Plant height (cm) 95.98 161.10 140.62±2.57 14.98 10.65 0.04
Culm width (cm) 0.30 0.70 0.43±0.01 0.07 16.38 –0.04
Flag leaf length (cm) 17.21 27.65 22.14±0.45 2.59 11.71 0.16
Flag leaf width (cm) 0.94 1.86 1.40±0.04 0.23 16.33 0.48**
Flag leaf area (cm2) 16.85 44.55 31.59±1.16 6.69 21.18 0.44**
Spike number per plant 9.75 38.90 15.94±0.94 5.50 34.52 –0.16
Spikelet numbers 18.32 43.38 23.06±0.73 4.30 18.66 0.60**
Spike length (cm) 5.05 14.47 10.37±0.30 1.77 17.03 –0.37*
Ear density 1.67 3.91 2.30±0.08 0.51 21.95 –0.90**
Awn length (cm) 1.08 11.17 7.40±0.44 2.57 34.72 0.04
Grains per spike 24.85 74.85 43.95±1.73 10.05 22.87 0.05
1000-grain weight (g) 22.80 45.80 33.83±0.94 5.35 15.81 –0.01
Mean, range of variability, min and max of measured morphological characters in 33 wheat landraces from Qinling Mountains of China; aCV – Coefficient of variation = (standard/mean) × 100; bCorrelation coefficients: regression analysis between aphid number ratio and morphological characters of wheat landraces; *P < 0.05; **P < 0.01.
The results of cluster analysis showed that all accessions were divided into two major groups consisting of two and three subgroups, respectively (Fig. S2). The Euclidean dis- tance ranged from 1.16 to 14.70 with an average of 5.57. EGA-resistant T. turgidum ac- cessions S571 and S821 have the most phenotype difference among all tested materials, while S1081 and S1148 were classed into the same group, i.e. they have the most similar morphological traits (Table S2). Apart from the subgroup 2A, both T. aestivum and T. turgidum accessions were classed in the other subgroups, as well as the resistant and susceptible accessions clustered. For example, Sub-groups 1A contained two EGA-resist- ant T. aestivum accessions S616 and S676 and 11 T. turgidum landraces. Of which, S652, S1131 and S1164 accessions are susceptible to EGA, but S1148 and S1181 accessions showed moderate resistance to EGA. Sub-group 2C contained five accessions including four T. turgidum accessions and one T. aestivum accession, which were selected from four neighborhood districts. Intriguingly, all of them are EGA-resistant germplasms, i.e. one highly resistant (S849), two moderately resistant (S1111 and S1125), and two lowly re- sistant (S979 and S1017).
Genetic diversity based on microsatellite markers analysis
A total of 99 SSR markers selected polymorphic primers were used to assess the 33 wheat landrace accessions (Table S3). All markers provided unambiguous bands and they de- tected a total of 707 alleles with an average of 7.14 per locus. The largest number of al- leles per locus was detected in the D genome (with an average of 7.57), which compared to 7.10 and 7.09 for the A and B genomes, respectively (Table S3). The mean values of PIC were recorded as 0.61 (varied from 0.06 to 0.95) with a minor variation among the three genomes. For the two species T. aestivum and T. turgidum, the average alleles per locus were 4.20 and 4.90, while the mean values of PIC were 0.58 and 0.48, respectively.
Compared with EGA-susceptible accessions, EGA-resistant accessions have more aver- age alleles per locus (4.21) and higher mean values of PIC (0.58).
The analysis of Nei’s genetic distance (GD) between different wheat landraces as- sessed in this study indicated that the GD values between the individuals varied from 0.33 to 0.95, with a mean of 0.68. And the mean GD values of T. aestivum and T. turgidum accessions were 0.73 (0.60–0.89) and 0.56 (0.33–0.81), respectively. The closest acces- sions of landraces were EGA-susceptible T. turgidum accessions S1164 from Xunyang and S947 from Danfeng. On the other side, the most genetically different accessions were EGA-resistant T. aestivum accession S616 from Lueyang and EGA-resistant T. turgidum accession S709 from Xixiang.
The UPGMA cluster analysis grouped the 33 accessions into two main clusters, de- noted as I and II, respectively (Fig. S3). Cluster I consisted of nine T. aestivum accessions, was divided into five sub-clusters (IA-IE) at the GD of 0.86. Sub-cluster IA, IB, and ID contained a single EGA-resistant accessions S1017, S616, and S382, respectively. Sub- cluster IC contained a single EGA-susceptible accession S1155. Sub-cluster IE contained three EGA-resistant accessions (S1046, S819, and S676) and two EGA-susceptible ac- cessions (S1056 and S1153). Cluster II, consisted of 24 T. turgidum landraces, was di-
vided into six sub-clusters (IIA-IIG) at the GD of 0.63. Sub-cluster IIA contained a single EGA-resistant accession S1028. Sub-cluster IIB was composed of EGA-susceptible ac- cession S652 and EGA-resistant accession S821. Sub-cluster IIC contained a single mod- erately resistant accession S1111. Sub-cluster IID and Sub-cluster IIE contained two lowly resistant accessions, respectively. An EGA-susceptible accession S591 and two lowly resistant accessions S709 and S571 were placed into Sub-cluster IIF. Sub-cluster IIG contained included all remaining T. turgidum accessions including a highly resistant accession S849 from Zhashui, five moderately resistant accessions (S992 come from Shanyang, S1181 from Baihe, S1124, S1125 and S1148 from Xunyang), four lowly re- sistant accessions and three EGA-susceptible accessions. All these accessions come from the Eastern Qinling region.
Discussion
In China, EGA is the predominant and destructive aphid species on wheat (Ma et al.
2006). The evaluations on identification of resistance to EGA in wheat germplasm have been studied (Shi et al. 2008; Wang et al. 2010, 2013; Zhou et al. 2011; Liu et al. 2014).
One synthetic line (98-10-30) (Wang et al. 2013) and eight China wheat landraces (Liu et al. 2014) were high or moderately resistant to EGA. However, most of the good quality wheat varieties (lines) planted over a large area in China were susceptible to EGA (Wang et al. 2010). Of the 521 spring wheat genotypes from north China, 12 (2.29%) showed resistance to EGA (Shi et al. 2008). And five in 200 genotypes from the main wheat- producing areas of China were moderately resistant (Zhou et al. 2011). Hu et al. (2016) detected great differences in the crop yield loss rates and the aphid number ratio of the same germplasm. And yet, some studies have suggested that the aphid number ratio is suitable for the preliminary screening of large quantities of wheat germplasm materials in the field (Zhou et al. 2011; Wang et al. 2013; Liu et al. 2014). In the present study, 25 EGA-resistant wheat landraces were evaluated based on aphid number ratio from 527 wheat landrace accessions over 3 years. Of which eight accessions which showed high or moderate levels resistance to EGA were from the eastern region of Qinling Mountains, except S328. Therefore, wheat landraces from Qinling Mountains appeared to provide a potential source of resistant to EGA. Previous reports have indicated that most of Chinese wheat cultivars were susceptible to EGA (Shi et al. 2008; Wang et al. 2010; Zhou et al.
2011). The crosses between the susceptible Chinese cultivars and these wheat landrace accessions with medium-high resistance to EGA could breed EGA resistant varieties, especially if they have unique genes that provide resistance to future biotypes of EGA.
In the cluster analysis based on morphological traits, every group included two type species T. aestivum and T. turgidum, both EGA-resistant and susceptible landraces, ex- cept Sub-group 2A and 2C. Sub-group 2A contained two T. turgidum landraces, EGA- resistant accession S571 and EGA-susceptible accession S591. Sub-group 2C contained five EGA-resistant landraces, including one T. turgidum and four T. aestivum accessions.
One highly resistant accession, two moderately resistant accessions and two lowly resist- ant accessions grouped in Sub-group 2C. These five resistant accessions have similar
morphological traits, such as green leaves with wax, light blue glume without glume hairs, higher ear density, longer flag leaf but lower leaf area. The observations are consist- ent with the results of correlation analysis, that aphid number ratio was significant cor- related with flag leaf width, flag leaf area, spike length and ear density. Similar results on the relationship between resistance level and morphological traits were reported by Liu et al. (2006) and Li et al. (2007). This result demonstrated that there was the rich genetic diversity in the morphology traits of the highly and moderately resistant landrace acces- sions collected from Qinling Mountains.
The clustering pattern obtained by morphological traits showed that the wheat lan- drace accessions did not entirely agree with the geographical distribution (Sönmeoğlu et al. 2012). In this study, most of the landraces from the same or nearby districts tended to group together. Landraces from the middle-east part of Qinling Mountains mainly grouped in sub-group 1B, 2B and 2C, while the landraces S571 and S591 from two neigh- boring districts (Hanzhong and Mianxian) were clustered together in sub-group 2A. There was an interesting exception in sub-group 1A that 13 accessions are from 9 different dis- tricts a bit distant from each other. However, according to the morphological database, they do have many similar traits, such as less tillers, large and long leaves, big-spike and high-kernel weight. Based on this result, we concluded that the 13 accessions may have very similar growing conditions, because the floristic composition of Qinling Mountains is largely determined by altitude, mean annual temperature, exposure and relative humid- ity primary (Tang et al. 2004).
Comparison of the results obtained in the current study with those previous studies based on SSR markers for wheat landraces (Dreisigacker et al. 2004; Teklu et al. 2006;
Yildirim et al. 2011; Sönmeoğlu et al. 2012) indicates that the mean number of alleles per locus found for the landraces in the this study was relatively low. In the present study, analysis of 33 wheat landraces by 99 SSR markers identified a total of 707 alleles, with 7.14 alleles per locus. The mean number of alleles per locus were 4.20 and 4.90 across the T. aestivum and T. Turgidum landraces, respectively. Teklu et al. (2006) analyzed the ge- netic diversity of Ethiopian tetraploid wheat landraces using 29 SSR markers and de- tected 320 alleles with 11.03 alleles per locus. The diversity of 36 CIMMYT wheat lan- drace cultivar accessions was assessed using 76 SSR markers and revealed 419 alleles with an average number of alleles per locus 6.0 (Dreisigacker et al. 2004). Yildirim et al.
(2011) assessed the genetic diversity of 20 Turkish durum wheat landraces and reported on average 7.25 number of alleles, while 20 Turkish bread wheat landraces averaged 9.0 alleles according to Sönmeoğlu et al. (2012). In this study, the average alleles per locus of the T. aestivum and T. turgidum species were very similar but even slightly higher in T. turgidum landraces. It indicates that there is a comparable variability in the T. turgidum and T. aestivum landraces. This is in an agreement results of analysing durum wheat and bread wheat accessions from Ethiopian and Oman (Alamerew et al. 2004; Zhang et al.
2006). In this study, SSR markers are valuable in detecting differences among T. aestivum and T. turgidum landrace accessions. Similar results were also reported by other research- ers in tetraploid and hexaploid wheat (Alamerew et al. 2004; Dreisigacker et al. 2004;
Zhang et al. 2006; Iqbal et al. 2009).
In this study, the 33 materials could be divided into two different major groups and further into 12 distinguishable subgroups. Half of the subgroups contained a single acces- sion, which likely host different genes from individuals in another subgroup. The results of the SSR analyses indicated that the wheat landraces have high genetic variability. The largest subgroup contained 13 accessions come from the Eastern Qinling region, includ- ing six of seven highly or moderately resistant T. turgidum wheat accessions. It was in agreement with the previous study (Wang et al. 2011), the wheat genotypes with the same resistance to EGA were clustered in same subgroup. It also was concluded in a similar study that some wheat landraces from the same geographic origin were clustered into the same cluster (Sönmeoğlu et al. 2012), while earlier researches have found the opposite results, the landraces from the same origin were distantly related or landraces from differ- ent origins were closely related (Dreisigacker et al. 2004).
Above all, 25 accessions displayed resistance to EGA among 527 wheat landrace ac- cessions assessed in this study, of which accession S849 displayed high resistance, and seven accessions displayed moderate resistance. Morphological traits and SSR makers showed a high level of genetic diversity within 33 wheat landrace accessions collected from Qinling Mountains. The clustering of the accessions based on morphological traits and SSR markers displayed significant difference in terms of geographical distribution, resistance to EGA and genome of accessions. SSR markers were clearer and more defined in clustering the accessions according to species and origin than morphological traits.
This agrees with the results of Turkish bread wheat landraces (Sönmeoğlu et al. 2012).
The highly or moderately resistant landrace accessions were collected from middle and east part of Qinling Mountains with long narrow green leaves with wax, lower leaf area and higher ear density etc. similar morphology characters.
Acknowledgements
This research is supported by the Key Technologies R&D Program of China (Grant Num- ber 2013BAD01B02-6), the innovation project of science and technology of Shaanxi province of China (Grant Number 2015KTZDNY01-01-02) and Zhongying Tang Breed- ing Foundation of Northwest A&F University.
References
Alamerew, S., Chebotar, S., Huang, X., Röder, M., Börner, A. 2004. Genetic diversity in Ethiopian hexaploid and tetraploid wheat germplasm assessed by microsatellite markers. Genet. Resour. Crop Ev. 51:559–567.
Ayala, M., Guzmán, C., Peña, R.J., Alvarez, J.B. 2016. Diversity of phenotypic (plant and grain morphological) and genotypic (glutenin alleles in Glu-1 and Glu-3 loci) traits of wheat landraces (Triticum aestivum) from Andalusia (Southern Spain). Genet. Resour. Crop Ev. 63:465–475.
Dreisigacker, S., Zhang, P., Warburton, M.L., Skovmand, B., Hoisington, D., Melchinger, A.E. 2004. Genetic diversity in elite lines and landraces of CIMMYT spring bread wheat and hybrid performance of crosses among elite germplasm. Crop Sci. http://www.researchgate.net/publication/29685715
Dong, Y.S., Cao, Y.S., Zhang, X.Y., Liu, S.C., Wang, L.F., You, G.X., Pang, B.S., Li, L.H., Jia, J.Z. 2003.
Establishment of candidate core collections in Chinese common wheat germplasm. J. Plant Genet. Resour.
4:1–8. (in Chinese with English abstract)
Hu, X.S., Liu, Y.J., Wang, Y.H., Wang, Z., Yu, X.L., Wang, B., Zhang, G.S., Liu, X.Q., Zhao, H.Y., Liu, T.X.
2016. Resistance of wheat accessions to the English grain aphid Sitobion avenae. PLOS ONE. 11:e0156158.
Iqbal, N., Tabasum, A., Sayed, H., Hameed, A. 2009. Evaluation of genetic diversity among bread wheat vari- eties and landraces of Pakistan by SSR markers. Cereal Res. Commun. 37:489–498.
Inspection and Quarantine Bureau of People’s Republic of China 2007. Agricultural industry standard of the People’s Republic of China (NY/T 1443.7–2007). Rules for resistance evaluation of wheat to diseases and insect pests. Part 7: Rule for resistance evaluation of wheat to aphids. www.ent-bull.com.cn/admin/down- file.aspx?id=34322
Khan, M., Port, G. 2008. Performance of clones and morphs of two cereal aphids on wheat plants with high and low nitrogen content. Entomol. Sci. 11:159–165.
Larsson, H. 2005. A crop loss model and economic thresholds for the grain aphid, Sitobion avenae (F.), in winter wheat in southern Sweden. Crop Protection 24:397–405.
Li, C.S., Shang, X.W., Shi, G.Y., Sun, D.X., Yuan, J.X. 2007. Effect of northern spring wheat some morpho- logical characters on the resistance level to wheat aphid. J. Gansu Agr. U. 6:80–83 (in Chinese with English abstract).
Li, F.Q., Peng, J.H. 2014. Genetic and association mapping study of English grain aphid resistance and toler- ance in bread wheat germplasm. J. Integr. Agr. 13:40–53.
Liu, X.L., Wang, C.Y., Wang, Y.J., Zhang, H., Ji, W.Q. 2014. Screening and evaluation of different wheat vari- eties for resistance to English grain aphid Sitobion avenae at seedling and adult-plant stages. Acta Phytophyl. Sin. 41:216–224.
Liu, X.L., Wang, Y.J., Sang, L.Q., Xiang, J.Y., Ji, W.Q. 2006. Relationship between morphological characters of wheat germplasm and their resistance to Sitobion avenae (F.). J. Triticeae Crops 26:24–28. (in Chinese with English abstract)
Liu, W., Yin, D.X., Liu, J.J., Li, N. 2014. Genetic diversity and structure of Sinopodophyllum hexandrum (Royle) ying in the Qinling Mountains, China. PLOS ONE. 9:e110500.
Ma, X.M., Liu, X.X., Zhang, Q.W., Zhao, J.Z., Cai, Q.N., Ma, Y.A. Chen, D.M. 2006. Assessment of cotton aphids, Aphis gossypii, and their natural enemies on aphid-resistant and aphid-susceptible wheat varieties in a wheat-cotton relay intercropping system. Entomol. Exp. Appl. 121:235–241.
Shi, G.Y., Shang, X.W., Wang, H.J., Ma, X.L. 2008. Screening the resistance to aphid of spring wheat germ- plasm. J. Lanzhou U. (Nat. Sci.) 44:40–43. (in Chinese with English abstract)
Sönmeoğlu, Ö.A., Bozmaz, B., Yildirim, A., Kandemïr, N., Aydin, N. 2012. Genetic characterization of Turkish bread wheat landraces based on microsatellite markers and morphological characters. Turk. J. Biol. 36:589–
Teklu, Y., Hammer, K., Huang, X.Q., Röder, M.S. 2006. Analysis of microsatellite diversity in Ethiopian tetra-597.
ploid wheat landraces. Genet. Resour. Crop Evol. 53:1115–1126.
Tang, Z.Y., Fang, J.Y., Zhang, L. 2004. Patterns of woody plant species diversity along environmental gradients on Mt. Taibai, Qinling Mountains. Biodivers. Sci. 12:115–122. (in Chinese with English abstract) Wang, C.P., Luo, K., Zhao, H.Y., Zhang, G.S., Li, D., Gao, H.H., Deng, M., Liu, L. 2011. Genetic diversity of
wheat germplasm resistance to the aphid (Sitobion avenae F.) by SSR markers. J. Nucl. Agri. Sci. 25:639–
644. (in Chinese with English abstract)
Wang, C.P., Wang, Z.H., Zhao, H.Y., Zhu, Q.D., Luo, K., Wang, L.M., Dong, P.H. 2013. Expression of potential resistance genes to the English grain aphid, Sitobion avenae, in wheat, Triticum aestivum. J. Insect Sci.
13:90.
Wang, M.F., Yang, H.M., Liu, J.Q., Lei, Z.S., Wu, Z.Q., Yuan, G.H., Chen, J.L. 2010. Effect of aphid damage on wheat yield and quality in Yellow and Huai Valleys winter wheat region. J. Henan Agri. Sci. 4:16–20.
(in Chinese with English abstract)
Yildirim, A., Sönmezoğlu, Ö.A., Gökmen, S., Kandemir, N., Aydin, N. 2011. Determination of genetic diver- sity among Turkish durum wheat landraces by microsatellites. Afr. J. Biotechnol. 10:3915–3920.
Yu, X.D., Pickett, J., Ma, Y.Z., Bruce, T., Napier, J., Jones, H.D., Xia, L.Q. 2012. Metabolic engineering of plant-derived (E)-β-farnesene synthase genes for a novel type of aphid-resistant genetically modified crop plants. J. Integr. Plant Biol. 54:282–299.
Zhang, P., Dreisigacker, S., Buerkert, A., Alkhanjari, S., Melchinger, A.E., Warburton, M.L. 2006. Genetic diversity and relationships of wheat landraces from Oman investigated with SSR markers. Genet. Resour.
Crop Ev. 53:1351–1360.
Zhou, H.B., Chen, J.L., Cheng, D.F., Francis, F., Liu, Y., Sun, J.R., Huang, Y., Wang, X.S., Liu, X.W., Liu, X.M., Zeng, J.D. 2011. Evaluation on the resistance to aphids of wheat germplasm resources in China. Afr.
J. Biotechnol. 10:13930–13935.
Electronic Supplementary Material (ESM)
Electronic Supplementary Material (ESM) associated with this article can be found at the website of CRC at http://www.akademiai.com/content/120427/
Electronic Supplementary Table S1. List of wheat landraces collected from Qinling Mountains and their Sitobion avenae F. response
Electronic Supplementary Table S2. Cumulative variance and eigenvalues for four major factors obtained from factor analysis and the characteristics within each factor for wheat landraces
Electronic Supplementary Table S3. Summary of genetic diversity among 99 SSR marker loci Electronic Supplementary Figure S1. Geographic distribution of the wheat landraces in Qinling Mountains. The
landraces were collected from 17 different districts of Southern Shaanxi province, China
Electronic Supplementary Figure S2. Cluster analysis of 33 wheat landraces using ward method and squared Euclidean distance (morphological traits)
Electronic Supplementary Figure S3. Dendrogram prepared of 33 wheat landraces based on SSR marker data