mTOR inhibition increases cell viability via autophagy induction during endoplasmic reticulum stress – An experimental and modeling study
Orsolya Kapuy
a,⇑, P.K. Vinod
b, Gábor Bánhegyi
aaDepartment of Medical Chemistry, Molecular Biology and Pathobiochemistry, Semmelweis University, T}uzoltó utca 37-47, Budapest H-1094, Hungary
bOxford Centre for Integrative Systems Biology, Department of Biochemistry, University of Oxford, Oxford OX1 3QU, UK
a r t i c l e i n f o
Article history:
Received 18 March 2014 Revised 4 July 2014 Accepted 21 July 2014
Keywords:
Autophagy Apoptosis
Endoplasmic reticulum stress Metyrapone
Unfolded protein response mTOR
a b s t r a c t
Unfolded or misfolded proteins in the endoplasmic reticulum (ER) trigger an adaptive ER stress response known as unfolded protein response (UPR). Depending on the severity of ER stress, either autophagy-controlled survival or apoptotic cell death can be induced. The molecular mechanisms by which UPR controls multiple fate decisions have started to emerge. One such molecular mechanism involves a master regulator of cell growth, mammalian target of rapamycin (mTOR), which paradox- ically is shown to have pro-apoptotic role by mutually interacting with ER stress response. How the interconnections between UPR and mTOR influence the dynamics of autophagy and apoptosis acti- vation is still unclear. Here we make an attempt to explore this problem by using experiments and mathematical modeling. The effect of perturbed mTOR activity in ER stressed cells was studied on autophagy and cell viability by using agents causing mTOR pathway inhibition (such as rapamycin or metyrapone). We observed that mTOR inhibition led to an increase in cell viability and was accompanied by an increase in autophagic activity. It was also shown that autophagy was activated under conditions of severe ER stress but that in the latter phase of stress it was inhibited at the time of apoptosis activation. Our mathematical model shows that both the activation threshold and tem- poral dynamics of autophagy and apoptosis inducers are sensitive to variation in mTOR activity.
These results confirm that autophagy has cytoprotective role and is activated in mutually exclusive manner with respect to ER stress levels.
Ó2014 The Authors. Published by Elsevier B.V. on behalf of the Federation of European Biochemical Societies. This is an open access article under the CC BY-NC-ND license (http://creativecommons.org/licenses/by-nc-nd/3.0/).
1. Introduction
The maintenance of homeostasis of a multicellular organism against both internal and external stimuli (such as nutrient avail- ability, growth factors etc.) depends on the ability of the cells to generate appropriate response (cell growth, division or cell death) to the input signals[1,2]. Cellular response depends on the molec- ular network comprising of crosstalk between diverse signaling pathways[3]. The inter-connections between pathways influence the dynamics and robustness of the regulatory system with respect to multiple signals[3,4].
Endoplasmic reticulum (ER) is a eukaryotic cellular component that has a crucial role in cellular homeostasis by sensing and generating signals to drive cellular responses[1,5]. ER has major
functions in synthesizing and packaging both secreted and mem- brane proteins, lipid biosynthesis, carbohydrate metabolism and several signaling processes[6–8]. The redox homeostasis of ER lumen is an important integrator of various stimuli. The proper redox state of both the luminal thiol/disulfide and pyridine nucle- otide systems, as well as the Ca2+ rich luminal environment are essential for the ER function[9,10]. Any imbalance of luminal ER homeostasis results in ER stress[5,11–13].
Prototypic experimental inducers of ER stress, namely thapsi- gargin (TG) and tunicamycin (TM) are shown to perturb ER homeo- stasis[11,14]. TG disrupts the calcium storage of ER by blocking calcium reuptake into the ER lumen, thus by depleting calcium from the organelle[11,15–17]. TM inhibits N-linked glycosylation of secretory and membrane proteins in the ER[11,18]. Both ER stressors are shown to induce autophagy but higher concentration of TG is shown to disrupt the fusion of autophagosomes and lyso- somes[19]. Both agents are also powerful inducers of apoptosis [20,21].
High luminal NADPH/NADP+ratio is essential for the proper function of the ER[9,22]. The luminal NADPH concentration is http://dx.doi.org/10.1016/j.fob.2014.07.006
2211-5463/Ó2014 The Authors. Published by Elsevier B.V. on behalf of the Federation of European Biochemical Societies.
This is an open access article under the CC BY-NC-ND license (http://creativecommons.org/licenses/by-nc-nd/3.0/).
Abbreviations:ER, endoplasmic reticulum; mTOR, mammalian target of rapa- mycin; UPR, unfolded protein response
⇑Corresponding author. Tel.: + 36 1 266 26 15.
E-mail address:kapuy.orsolya@med.semmelweis-univ.hu(O. Kapuy).
j o u r n a l h o m e p a g e : w w w . e l s e v i e r . c o m / l o c a t e / f e b s o p e n b i o
maintained high by the coordinated action of the ER glucose-6- phosphate transporter (G6PT) and the luminal hexose-6-phos- phate dehydrogenase (H6PD), while NADPH can be consumed by different luminal reductases (such as carbonyl reductases) [9,23,24]. Decreasing NADPH level by adding both metyrapone and menadione sensitizes the ER to oxidative injuries and can result in increased autophagosome formation[22]. We have shown that high concentration of metyrapone alone is sufficient to induce the autophagic process[25].
A recent study has shown that cells under ER stress activate autophagosome formation[26], which results in macroautophagy (autophagy)[26,27]. Since autophagy has an essential role in pro- moting cellular-survival during starvation by ‘‘self-eating’’ of parts of the cytoplasm and intracellular organelles, it was suggested that autophagy also has a crucial protective role under ER stress [3,26,28–30]. On the other hand, severe ER stress results in apopto- tic-dependent cell deathviasustained c-Jun terminal kinase (JNK) activity[29,12].
The accumulation of unfolded or misfolded proteins in ER dur- ing different stress situations is shown to trigger an adaptive response known as unfolded protein response (UPR) [7,14,31].
The three branches of UPR are activated by ER stress through ER membrane-associated proteins IRE1 (inositol requiring 1), PERK (PKR-like ER kinase) and ATF6 (activating transcription factor 6) [6,14]. All three sensors are bound by the chaperone Grp78/BIP under stress free situation to keep them inactive[7,14]. Under ER stress, the activation of IRE1 and ATF6 promotes transcription of UPR target genes (such as chaperones) and activation of PERK-con- trolled pathway leads to the general inhibition of protein transla- tion [6,14]. UPR is shown to activate both autophagy and apoptosis depending on the ER stress levels[29,32].
Intriguingly, recent evidences suggest the existence of a cross- talk between UPR and mammalian target of rapamycin (mTOR) signaling pathways in the control of cell survival and cell death decisions [6,14,33–35]. mTOR is the master regulator that inte- grates inputs from the external and internal signals, such as growth factors, amino acids, glucose and energy status to control growth and metabolism[34,36]. It also inhibits autophagy under nutrient rich condition[34]. In contrast, the down-regulation of mTOR activity by rapamycin is shown to enhance cell viability under ER stress[29,37]. Similarly, pre-treatment with rapamycin also protects cells against apoptotic cell death[29,38]. The pro- apoptotic role of mTOR is coupled to the downstream activation of both PERK and IRE1 branches of UPR under severe ER stress [37,39,40]. Further evidences suggest that UPR also has a function upstream of mTOR to control its activation under ER stress. Thus, mTOR and UPR regulate each other to form a positive feedback loop[35].
In addition to crosstalk between mTOR and UPR, the existence of a crosstalk is also suggested between the cell survival and death pathways at the level of effector molecules, such as caspases and autophagy-inductor Beclin1 regulated by Bcl2[41–44]. Recently, we proposed a minimal mathematical model of Bcl2 – Beclin1 – caspase regulatory motif to show how sequential activation of cell survival and cell death mechanisms can be achieved robustly by the crosstalk between the activators of cell fate decisions[45]. We sug- gested that the feedback loops between autophagy and apoptosis inducers make the system bistable to ensure mutually exclusive decisions and transition from cell survival to irreversible cell death [45]. How the feedback loops between autophagy and apoptosis inducers are coupled to the mutual regulation of mTOR and UPR is still unclear.
In this study, we examine with help of experiments and math- ematical modeling the interplay of mTOR and UPR in the control of cell survival and cell death decision. Thapsigargin and metyrapone were used as ER stress inducers. In the presence of thapsigargin, we
studied the effect of perturbing the mTOR activity on autophagy and cell viability by either using rapamycin or metyrapone.
Autophagy was monitored upon conversion of LC3I to LC3II, mTOR pathway activity was evidenced by measuring p70S6 phosphoryla- tion, activation of apoptosis was detected by the decrease of pro- caspase-3 level and by the cleavage of PARP, while p62 levels were measured as an indicator of autophagy inhibition. 3-methyl- adenine and bafilomycin A were used as inhibitors of autophagy.
Cell viability was assayed by two alternative methods.
We observed that the inhibition of mTOR pathway leads to increase in cell viability under ER stress and is accompanied by increase in autophagy activity. We also showed that autophagy is activated under severe ER stress condition but gets inhibited with increase in duration of stress. These results demonstrate that ER stressors can initiate apoptosis or autophagy, which depends on the chemical nature of the stressor, the extent and the duration of the stress. However, autophagy has cytoprotective role under ER stress. Our mathematical model shows that the activation thresholds and temporal dynamics are sensitive to mTOR activity.
2. Materials and methods 2.1. Materials
Metyrapone (Sigma–Aldrich, M2696), thapsigargin (Sigma–
Aldrich, T9033), rapamycin (Sigma–Aldrich, R0395), tunicamycin (Sigma–Aldrich, T7765) and 3-methyladenine (Sigma–Aldrich, M9281), bafilomycin A (Sigma–Aldrich, M17931) were purchased.
All other chemicals were of reagent grade.
2.2. Cell culture and maintenance
As model systems, human liver carcinoma (HepG2) and human embryonic kidney (HEK293) cell lines were used. Both cell lines were maintained in DMEM (Life Technologies, 41965039) medium supplemented with 10% fetal bovine serum (Life Technologies, 10500064) and 1% antibiotics/antimycotics (Life Technologies, 15240062). Culture dishes and cell treatment plates were kept in a humidified incubator at 37°C in 95% air and 5% CO2.
2.3. SDS–PAGE and Western blot analysis
Cells were harvested and lysed with 20 mM Tris, 135 mM NaCl, 10% glycerol, 1% NP40, pH 6.8. Protein content of cell lysates was measured using Pierce BCA Protein Assay (Thermo Scientific, 23225). During each procedure equal amounts of protein were used. SDS–PAGE was done by using Hoefer miniVE (Amersham).
Proteins were transferred onto Millipore 0.45
l
M PVDF membrane.Immunoblotting was performed using TBS Tween (0.1%), contain- ing 5% non-fat dry milk for blocking membrane and for antibody solutions. Loading was controlled by developing membranes for actin or dyed with Ponceau S in each experiment. The following antibodies were applied: antiGADD153 (SantaCruz, sc-575) antiLC3B (SantaCruz, sc-16755), antiactin (SantaCruz, sc-1616), anticaspase-3 (SantaCruz, sc-7272), antip-p70S6 (SantaCruz, sc- 11759), anti-p70S6 (SantaCruz, sc-230), antiPARP (Cell Signaling, 9542S), antip-4EBP1 (Cell Signaling, 236B4), anti-4EBP1 (Cell Sig- naling, 53H11), antip62 (Cell Signaling, 5114S) and GAPDH (Santa Cruz, 6C5), HRP conjugated secondary antibodies (SantaCruz, sc- 2020 and Cell Signaling, 7074S, 7076S).
2.4. Cell viability assays
Cell viability was detected using a trypan blue exclusion assay.
Cells were incubated with isotonic solution of trypan blue 0.6%
(Sigma–Aldrich, T6146) and permeabilized cells were counted pro-
portionally to total cell numbers. Cell viability was also evaluated using CellTiter-Blue assay (Promega, G8080). Cells were grown and treated on 96-well plates, and were incubated with resazurin for 2 h at 37°C. Absorbance was measured at 620 nm, and expressed in arbitrary unit, being proportional to cell toxicity. For each of these experiments at least three parallel measurements were carried out.
2.5. Mathematical modeling
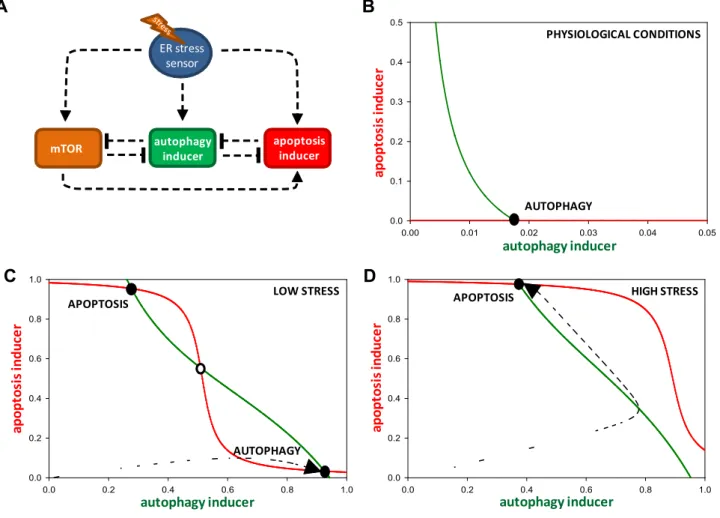
The regulatory network given inFig. 5A was translated into a set of nonlinear ordinary differential equations (ODEs) and ana- lyzed using the techniques of dynamical system theory[46–48].
Dynamical simulations, phase plane and bifurcation analysis were carried out using the program XPPAUT,which is freely available from http://www.math.pitt.edu/ ~bard/xpp/xpp.html [47,48].
ODE describes the time-rate of change of level or activity of a com- ponent (such as crosstalk element, autophagy and apoptosis induc- ers). The initial conditions and parameter values used for simulations are given in Supplementary material. All variables are dimensionless, rate constants (k’s)have a dimension of min 1, while Michaelis Menten constants are dimensionless. The total level of mTOR, autophagy and apoptosis inducers were assumed to be constant (one unit). We provide the XPP code (in theSupple- mentary material) that can be used to generate all the figures in the manuscript.
3. Results
3.1. Apoptotic events are preceded by autophagy-dependent survival under ER stress
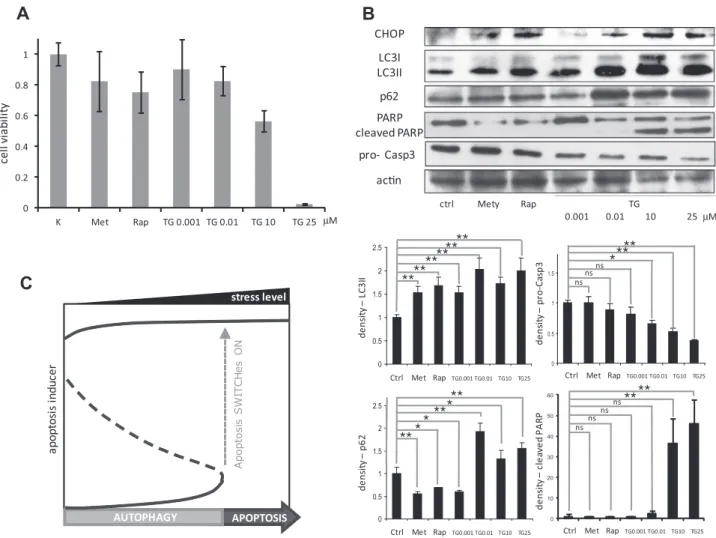
We firstly studied the cellular response to ER stress by checking cell viability in HepG2 cells treated with different concentrations of drug thapsigargin (TG) or tunicamycin (TM) for 24 h (Fig. 1A and Fig. S1A). Cell viability did not decrease significantly at lower con- centration of TG (0.001–0.01
l
M), whereas at a high concentration of TG (25l
M TG), cell viability dropped dramatically, below 5%(Fig. 1A). At intermediate level of ER stressor (0.1–1
l
M) drastic decrease of cell viability was not observed (data not shown). To further characterize cell phenotypes under drug treatment, we analyzed the well-known markers of autophagy and apoptosis by immunoblotting. The lower concentration of TG induced transfor- mation of cytoplasmic LC3I to membrane bounded LC3II, indicating an increase in autophagosome formation. On the other hand, higher concentration of TG not only induced transformation of LC3I to LC3II but also equally showed more intense p62 band (Fig. 1B), suggesting that autophagosome formation was disrupted.Meanwhile, procaspase-3 level decreased and cleaved PARP level increased at high level of ER stressor indicating the activation of apoptotic events, consistently with the observation of drastic drop in cell viability at high TG concentration (Fig. 1A). Similar results were observed when HEK cells were treated with TM or TG
0 0.5 1 1.5 2 2.5
ctrl Mety Rap TG
0.001 0.01 10 25 µM pro- Casp3
LC3I LC3II p62
acn
cell viability
A B
stress level
apoptosisinducer Apoptosis SWITCHes ON
AUTOPHAGY APOPTOSIS
µM
CHOP
0 0.2 0.4 0.6 0.8 1
K Met Rap TG 0.001 TG 0.01 TG 10 TG 25
C
0 0.5 1 1.5 2 2.5
0 0.5 1 1.5
Ctrl Met Rap TG0.001 TG0.01 TG10 TG25
Ctrl Met Rap TG0.001 TG0.01 TG10 TG25
Ctrl Met Rap TG0.001 TG0.01 TG10 TG25
density –LC3IIdensity –p62 density –pro-Casp3
ns nsns
PARP cleaved PARP
0 10 20 30 40 50 60
density –cleaved PARP
Ctrl Met Rap TG0.001 TG0.01 TG10 TG25
nsnsnsns
Fig. 1.Choosing between autophagy and apoptosis with respect to different cellular stressors. HepG2 cells were treated with rapamycin (100 nM) or metyrapone (100lM) for 2 h or with increasing concentration of TG for 24 h. (A) Cell viability observed upon the treatments. (B) Western blot analysis of GADD153/CHOP, LC3, p62, PARP, procaspase-3 and actin. Densitometry data represent the intensity of LC3II, p62, procaspase-3, and cleaved PARP bands in arbitrary units normalized for actin (asterisks indicate statistically significant difference:⁄p< 0.05;⁄⁄p< 0.01). (C) Presumed signal-response curve of apoptosis inducer.
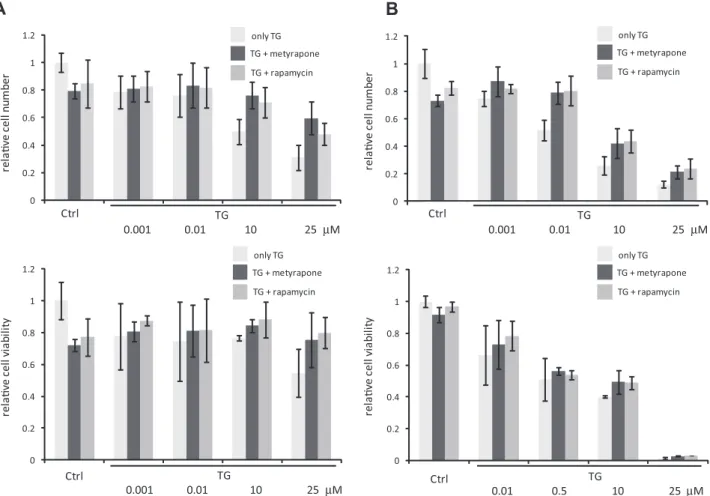
(Figs. S1B–D). Altogether, the data supposed that autophagy induced at low concentration of TG or TM does not kill the cells, however a high level of ER stress results in apoptosis. An earlier study showed that TM- or TG-induced ER stress can activate both autophagy and apoptosis in a sequential manner and autophagy has a cytoprotective role[29]. This suggested that treating cells with higher concentration of TG for a shorter interval might only activate autophagy leading to increase in cell viability. Therefore, we performed the experiment for a shorter time interval of 2 h.
The viability of cells treated for shorter time with high stress levels (TG = 10
l
M) did not decrease drastically (Fig. 2A). This observa- tion coincides with an increase in autophagy activity as measured by the formation of LC3II and decrease in p62 levels (Fig. S2). A treatment of cells for shorter time with lower stress level (TG = 0.01l
M) by itself was also sufficient to activate autophagy (Fig. S2). Thus, at higher stress level cells initiate autophagy to sur- vive, however under longer duration of stress autophagy becomes inactive and the cells commit to apoptotic cell death suggesting mutual exclusion between the surviving and self-killing mecha- nisms. These data are consistent with our recent qualitative model proposed for crosstalk between autophagy and apoptosis. We dem- onstrated that the induction of apoptosis depends on the stress level crossing a specific activation threshold [45]. The signal- response curve of apoptosis inducer with respect to stress level is shown inFig. 1C. Here, the stress level (‘signal’) has to reach a crit- ical value to turn on apoptosis (‘response’). If the treatment is shorter or the concentration of ER stressor is lower, cells induce autophagy to ‘‘self-eat’’ their damaged components instead of pro- moting apoptosis. Apoptosis is switched on only when cells aretreated with higher concentration of ER stressor for longer dura- tion as observed by a drastic drop in viability, PARP cleavage induc- tion and decrease of procaspase-3 level in our experiments. It can be seen from the signal-response curve that the stress threshold for the irreversible activation of apoptosis inducer arises due to the bistable characteristic of the autophagy – apoptosis regulatory net- work (Fig. 1C).
3.2. Metyrapone – similarly to rapamycin – improves cell viability under ER stress
Rapamycin induces autophagy by mimicking nutrient depletion viadown-regulating the mTOR pathway[49]. Recent experimental data suggested that mTOR inhibition promotes cell survival under ER stress induced by TG or TM[37,38]. Consistently, we observed in HepG2 cells that rapamycin treatment alone induced the trans- formation of LC3I to LC3II indicating an increase in autophagosome formation, and a moderate decrease in cell viability was also pres- ent (Fig. 1B). Further, rapamycin treatment rescued the cells from cell death provoked by higher concentrations of TG. This was observed for both long and short treatment of cells with TG beside rapamycin (Fig. 2). Collectively, these results suggest that the acti- vation of autophagy under rapamycin treatment might contribute towards decrease in cell death under ER stress. To further test this possibility, we used another ER stressor, metyrapone that is capa- ble of activating autophagy via downregulation of mTOR pathway [22,25]. Fig. 1B shows that a 2-h long treatment of cells with metyrapone was sufficient to induce the transformation of LC3I to LC3II and cell viability decreased slightly. A decreased level of
0 0.2 0.4 0.6 0.8 1 1.2
1 2 3 4 5
0 0.2 0.4 0.6 0.8 1 1.2
1 2 3 4 5
0 0.2 0.4 0.6 0.8 1 1.2
1 2 3 4 5
0 0.2 0.4 0.6 0.8 1 1.2
1 2 3 4 5
A B
relave cell viabilityrelave cell number relave cell numberrelave cell viability
Ctrl Ctrl
0.001 0.01 10 25 µMTG
Ctrl TG
0.01 0.5 10 25 µM Ctrl
0.001 0.01 10 25 µMTG
only TG TG + metyrapone TG + rapamycin
0.001 0.01 10 25 µMTG
only TG TG + metyrapone TG + rapamycin
only TG TG + metyrapone TG + rapamycin
only TG TG + metyrapone TG + rapamycin
Fig. 2.mTOR inhibition increases cell viability in ER stress. Cell viability was assessed by both measuring the percentage of cells permeable to trypan blue (upper panel) and using CellTiter-Blue assay (lower panel). (A) HepG2 cells were treated with increasing concentration of TG for 2 h without/with metyrapone (100lM)/rapamycin (100 nM) for 2 h. (B) HepG2 cells were treated with increasing concentration of TG for 24 h without/with metyrapone (100lM)/rapamycin (100 nM) for 2 h.
p62 indicated effective autophagosome formation while caspase-3 activation and PARP cleavage were not observed. Thus, metyra- pone has similar effect to rapamycin in promoting autophagy (Fig. 1B). This similarity was also confirmed by using various autophagy inhibitors, such as 3-methyladenine (3-MA) and bafilo- mycin A (Fig. S3).
To investigate whether metyrapone is also capable of restoring cell viability under ER stress, we performed the experiments involving combined treatment of cells with both metyrapone and TG. Cells were treated with different concentration of TG together with metyrapone for 2 h and cell viability was quantified in two ways (seeSection 2). A combined treatment of cells with TG and metyrapone for 2 h suppressed the occurrence of cell death at higher concentrations (10–25
l
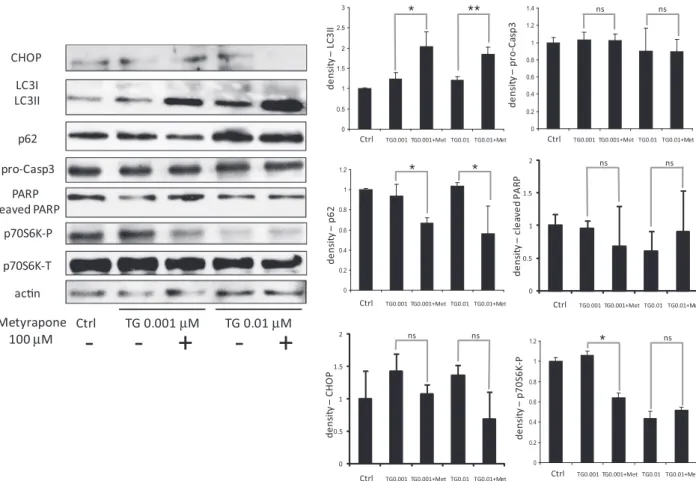
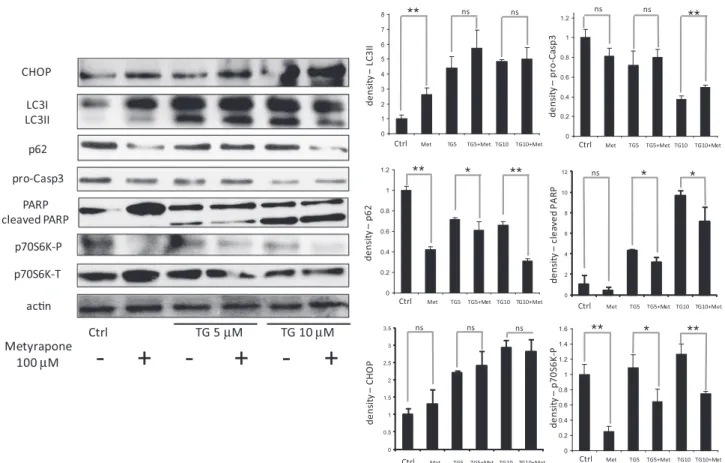
M) of TG (Fig. 2A). We also studied the effect of metyrapone by treating the cells with TG for 24 h, while metyrapone was added only for 2 h. The short treatment of metyrapone was sufficient to increase the cell viability at high TG concentrations even after 24 h (Fig. 2B). Similar results were observed at simultaneous treatment of TM and metyrapone both in HepG2 and HEK cells (Fig. S4).We characterized the positive effect of metyrapone on ER stressed cells by following the markers of both autophagy and apoptosis by immunoblotting under combined treatment (Figs. 3 and 4andFig. S2). Metyrapone promoted a significant transforma- tion of LC3I to LC3II under ER stress caused by 0.001–10
l
M TG.Furthermore, p62 level did not increase so drastically even at a higher concentration of TG (10
l
M). Since apoptosis activation can be observed at 10l
M TG treatment, the experiment was also carried out at a slightly lower TG concentration to catch the switch on of apoptosis (see 5l
M TG on Fig. 4). Meanwhile the mTORmarker p70S6 kinase got dephosphorylated. These data support an effective autophagosome formation and high autophagic activ- ity at combined treatment. We also observed that procaspase-3 level remained higher and cleaved PARP level was lower with metyrapone treatment suggesting an inhibition of apoptosis at high ER stress (Fig. 4). Since both rapamycin and metyrapone induced autophagy and rescued cells from cell death under ER stress, it raises the question whether these drugs bring about their cytoprotective effect via the same pathway. We tested this by treating the ER stressed cell with both rapamycin and metyrapone.
Our results suggest that these drugs – although they have different targets – might act through the same pathway of autophagy activa- tion to suppress the effect of ER stress (Fig. S5). To confirm further that metyrapone-induced viability occurred via intensive autoph- agy at combined treatment the experiment was repeated by using 3-MA or bafilomycin A. It is well-known that 3-MA enhances cyto- toxic effect of TG, but both inhibitors were able to block the posi- tive effect of metyrapone (Fig. S6).
Our results indicate that autophagy and apoptosis can exhibit the characteristic of mutual antagonism, which could influence the behavior of cells under combined treatment. Therefore, an increase in autophagy by mTOR inhibition can delay cell death via feedback loops.
3.3. A minimal model of autophagy-apoptosis crosstalk under ER stress We have previously shown by a mathematical model that the cellular decision of either to survive or die under stress is influ- enced by the dynamics of regulatory motif involving a mutual antagonism between autophagy and apoptosis inducers and a Ctrl TG 0.001 µM TG 0.01 µM
Metyrapone
100 µM
- - + - +
pro-Casp3 LC3I LC3II
p62
acn p70S6K-P
0 0.5 1 1.5 2 2.5 3
0 0.2 0.4 0.6 0.8 1 1.2 1.4
0 0.2 0.4 0.6 0.8 1 1.2
Ctrl TG0.001 TG0.001+Met TG0.01 TG0.01+Met Ctrl TG0.001 TG0.001+Met TG0.01 TG0.01+Met
Ctrl TG0.001 TG0.001+Met TG0.01 TG0.01+Met
density –LC3IIdensity –p62 density –pro-Casp3
ns ns
p70S6K-T CHOP
PARP cleaved PARP
0 0.5 1 1.5 2
density –CHOP
Ctrl TG0.001 TG0.001+Met TG0.01 TG0.01+Met
ns ns
0 0.2 0.4 0.6 0.8 1 1.2
Ctrl TG0.001 TG0.001+Met TG0.01 TG0.01+Met
density –p70S6K-P
ns 0
0.5 1 1.5 2
density –cleaved PARP
Ctrl TG0.001 TG0.001+Met TG0.01 TG0.01+Met
ns ns
Fig. 3.Combined treatment with metyrapone and TG induces early autophagy. HepG2 cells were treated with increasing concentration of TG for 24 h without/with metyrapone for 2 h (100lM). Expression of GADD153/CHOP, LC3, p62, procaspase-3, PARP, p70S6K-P, p70S6K-T and actin was probed by immunoblotting. Densitometry data represent the intensity of LC3II, p62, GADD153/CHOP, procaspase-3, cleaved PARP and p70S6K-P bands in arbitrary units normalized for actin (asterisks indicate statistically significant difference:⁄p< 0.05;⁄⁄p< 0.01).
crosstalk element Bcl2[45]. Although such a regulation is already reported under nutrient starvation, we claimed that this motif might be relevant even under ER stress based on the experimental results obtained by us and relevant data published by other groups.
To demonstrate this point further, we interpret our earlier model from the context of ER stress and include the interconnections of mTOR with autophagy and apoptosis inducers. This minimal model was independent of identity of molecular players and only includes the system level feedback loops relevant to autophagy – apoptosis crosstalk.
In our previous model, the crosstalk element Bcl2 inhibits both autophagy and apoptosis inducers and various cellular stressors activate both autophagy and apoptosis by inhibiting the crosstalk element[45]. It is well known that ER stress acti- vates a crosstalk element involving three branches of unfolded protein response (UPR) to activate both autophagy and apopto- sis. For simplicity, we assumed that an ER stress sensor (ERS) representing the three branches of UPR directly activates both autophagy and apoptosis inducers. ERS activity is very low under physiological conditions and increases rapidly under ER stress.
Since autophagosome formation was disrupted in parallel to apoptosis induction under ER stress (Fig. 1), we considered that apoptosis inducer inhibits autophagy inducer. Such an interac- tion can be envisaged to happen through caspases-dependent cleavage of autophagic proteins as reported under nutrient star- vation. Similarly, autophagic inducers could prevent apoptosis activation by degradation of proteins including apoptosis induc- ers. This could inactivate apoptosis directly or indirectly by relieving ER stress. Such interactions generated a double nega- tive feedback loop between autophagy and apoptosis inducers.
Beside this feedback loop, incorporating mTOR regulation of
autophagy and apoptosis under ER stress introduced more feed- back loops into the regulatory system. Activation of mTOR is known to promote apoptosis (under ER stress) and inactivate autophagy[34,35]. On the other hand, autophagy is also shown to have a negative influence on mTOR activation[50,51]. These generated a double negative feedback loop between mTOR and autophagy inducers. The minimal model included four compo- nents namely ER stress sensor (ERS), mTOR, autophagy and apoptosis inducers (Fig. 5A).
To examine other qualitative behavior of the system, we trans- lated the regulatory structure into a set of nonlinear differential equation and performed a phase plane analysis (see Section2and Suppl. data). A two dimensional phase plane of autophagy and apoptosis inducers was created by assuming that other two regu- lators (ERS and mTOR) were at steady state. The curves on the phase plane are called the balance curves (also called nullclines) of autophagy and apoptosis inducers, which represent how steady state of one inducer varies as function of other inducer. Intersec- tions of the two balances curves show the steady state of system, which could be stable or unstable. The phase plane of autophagy (green) and apoptosis (red) inducers under physiological, low and high stress conditions are shown inFig. 5. Under physiological condition, both balance curves intersected at low value of autoph- agy while apoptosis inducer was completely suppressed (Fig. 5B).
At low stress level, the balances curves intersected at three points representing two stable steady states separated by an unstable steady state (Fig. 5C). A stable state with higher autophagy inducer activity but lower apoptotic inducer activity corresponds to autophagy. On the other hand, a stable state with higher apoptosis inducer activity but lower autophagy inducer corresponds to apoptosis.
0 2 4 6 8 10 12
0 0.5 1 1.5 2 2.5 3 3.5
Metyrapone
100 µM
- + - + - +
Ctrl TG 5 µM TG 10 µM
0 1 2 3 4 5 6 7 8
0 0.2 0.4 0.6 0.8 1 1.2
0 0.2 0.4 0.6 0.8 1 1.2
0 0.2 0.4 0.6 0.8 1 1.2 1.4 1.6
Ctrl Met TG5 TG5+Met TG10 TG10+Met Ctrl Met TG5 TG5+Met TG10 TG10+Met
Ctrl Met TG5 TG5+Met TG10 TG10+Met
Ctrl Met TG5 TG5+Met TG10 TG10+Met
density –LC3IIdensity –p62 density –pro-Casp3density –p70S6K-P
ns
ns ns ns
pro-Casp3 LC3I LC3II p62
acn p70S6K-P p70S6K-T CHOP
PARP cleaved PARP
density –CHOP density –cleaved PARP
Ctrl Met TG5 TG5+Met TG10 TG10+Met
Ctrl Met TG5 TG5+Met TG10 TG10+Met ns
ns ns
ns
Fig. 4.Metyrapone treatment delays apoptotic cell death caused by TG. HepG2 cells were treated with increasing concentration of TG for 24 h without/with metyrapone for 2 h (100lM). Expression of GADD153/CHOP, LC3, p62, procaspase-3, PARP, p70S6K-P, p70S6K-T and actin was probed by immunoblotting. Densitometry data represent the intensity of LC3II, p62, GADD153/CHOP, procaspase-3, cleaved PARP and p70S6K-P bands in arbitrary units normalized for actin (asterisks indicate statistically significant difference:⁄p< 0.05;⁄⁄p< 0.01).
At low (tolerable) level of stress, the system occupied the auto- phagic state (Figs. 1 and 5C). With increase in the stress level the balance curve of apoptosis (red) shifted to the right resulting in the loss of intersection of the curves at autophagic state (Figs.1C and5D). Therefore, the regulatory system fired to the sole remain- ing stable state, which corresponds to apoptosis.
3.4. The effect of autophagy on apoptosis under combined treatment of cells
In this section, we raise the question how the simultaneous treatment of rapamycin/metyrapone and ER stressor can affect the balance curves of the system. Our experimental data showed the following effects of rapamycin/metyrapone on ER stressed cells:
1. Autophagy got activated at lower concentration of TG in the presence of rapamycin/metyrapone compared to TG treatment alone suggesting that the activation threshold for autophagy shifted to lower stress level in the presence of combined treat- ment (Figs. 3 and 4).
2. Rapamycin/metyrapone increased cell viability by maintaining autophagic state at severe ER stress suggesting that the activa- tion threshold of apoptosis inducer moved to higher stress val- ues (Figs. 2–4).
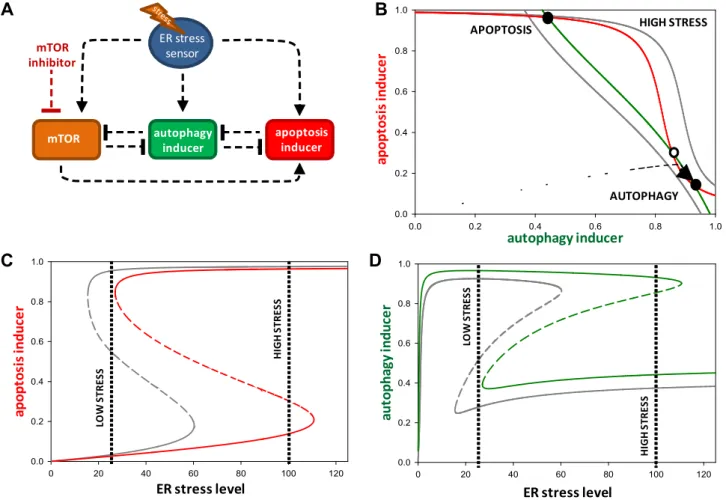
Since both rapamycin and metyrapone actviamTOR inhibition, we studied the qualitative behavior of the system under combined treatment by decreasing the total level of mTOR to close to zero to mimic the effect of rapamycin/metyrapone (Fig. 6A). A combined treatment shifted the balance curve of autophagy inducer to right while the balance curve of apoptosis inducer shifted to left in com- parison to the treatment of cells with only high TG concentration (Fig. 6B). The net effect of combined treatment was that the system was able to preserve its autophagic state even at higher concentra- tion of TG. However, at much higher concentration of TG, the bal- ance curve of apoptosis shifted towards right even in the presence of rapamycin/metyrapone suggesting that the system lost its sur- viving state at severely stressed conditions.
We also computed the effect of combined treatment on the sig- nal response curve of autophagy and apoptosis inducers (Fig. 6C and D). The autophagy inducer followed a sigmoid activation char- acteristic with respect to low levels of stress, while apoptosis indu- cer underwent a switch-like induction at a higher threshold of ER stress. Apoptosis activation also led to the inhibition of autophagy.
The combined treatment of cells resulted in the activation of autophagy inducer to reach its maximum value at much lower level of stress, while its inactivation threshold moved to a higher threshold suggesting that one of the main role of mTOR is to sup- press autophagy dependent survival during intolerable ER stress (Fig. 6C and D). Thus, it could be seen that under combined treat-
0.0 0.2 0.4 0.6 0.8 1.0
0.0 0.2 0.4 0.6 0.8 1.0
0.0 0.2 0.4 0.6 0.8 1.0
0.0 0.2 0.4 0.6 0.8 1.0
0.00 0.01 0.02 0.03 0.04 0.05
0.0 0.1 0.2 0.3 0.4
A B
0.5C D
PHYSIOLOGICAL CONDITIONS
HIGH STRESS LOW STRESS
ER stress sensor
apoptosis inducer autophagy
inducer mTOR
autophagy inducer
autophagy inducer autophagy inducer
a p opt o si s i nduc e r
ap o p to si s i n d u ce r a p o p to si s i n d u ce r
AUTOPHAGY
AUTOPHAGY
APOPTOSIS APOPTOSIS
Fig. 5.The minimal model of cell fate decision during ER stress. (A) Wiring diagram of the regulatory network. The autophagy inducer, the apoptosis inducer, mTOR and the crosstalk element are denoted by isolated boxes. Dashed lines show how the molecules can influence each other. Blocked end lines denote inhibition. (B), (C) and (D) Phase plane portrait of crosstalk between autophagy and apoptosis. Red nullcline represents apoptosis inducer, while green nullcline denotes autophagy inducer. Intersections of nullclines represent the stable (filled circle) and unstable (open circle) steady states. The phase planes are shown for (B) physiological conditions (stress = 0), (C) low level of ER stress (stress = 25) and (D) high level of stress (stress = 100). (For interpretation of the references to color in this figure legend, the reader is referred to the web version of this article.)
ment the activation and inactivation thresholds of autophagy inducers decreased and increased, respectively, to extend the stress window of autophagy-dependent survival. Increase in autophagy under combined treatment was manifested through increase in magnitude and duration of autophagy inducer to sup- press apoptosis (Fig. S7). Our model analysis suggested that both
‘‘arms’’ of mTOR (inhibiting autophagy and activating apoptosis inducers) were lost under the combined treatment to block the activation of apoptosis. We observed comprising either of them is insufficient to block apoptosis at higher stress levels (Fig. S8).
4. Discussion
A cellular decision to survive or die under stress conditions is influenced by the crosstalk between signaling pathways that regu- late these processes. Cells employ pleiotropic pathways or proteins to make mutually exclusive decisions. These aspects raise a ques- tion: how cells succeed to switch on or off robustly specific stress response using an integrated network. In this study, we addressed this question using experiments and mathematical modeling in the context when cells are subjected to ER stress.
An increase in misfolded proteins due to change in ER folding capacity is shown to be monitored by three branches (IRE1, PERK and ATF6) of unfolded protein response (UPR)[14]. These branches not only help towards maintaining homeostasis but also can
trigger apoptosis in the case of irresolvable stress. One of the mechanisms activated by UPR is autophagy, a catabolic process that helps towards cell survival under different stress conditions.
Interestingly, both autophagy and apoptosis share mutual relation- ship as well as are under the positive control of UPR. Further, UPR activates mammalian TOR (mTOR) pathway, which in turn pro- motes apoptosis, while inhibits autophagy[35]. These paradoxical interactions make it difficult to understand regulatory principles of stress responses intuitively.
Our experiments showed that cells depending on the magni- tude and duration of ER stress (by perturbing ER homeostasis using TG or metyrapone) temporally co-ordinate autophagy and apopto- sis in a sequential and mutually exclusive manner (Fig. 1). We observed that autophagy is activated even at high stress conditions and contributes towards cell survival for few hours, after which only cell death mechanism prevails (Fig. 4andFig. S2). This is evi- dent from an early event: increase in the conversion of LC3I to LC3II (an indicator of autophagy activation) and late events: induc- tion of PARP cleavage and decrease of procaspase-3 level (indica- tors of apoptosis activation) and increase in p62 levels (an indicator of autophagy inhibition) (Figs. 3 and 4 and Fig. S2).
Accordingly, cell viability is high at 2 h while low at 24 h (Fig. 2).
On the other hand, at lower stress level, the activation of autoph- agy is observed, concomitantly with rise in cell viability. These results suggest that autophagy might have cytoprotective role dur-
0 20 40 60 80 100 120
0.0 0.2 0.4 0.6 0.8 1.0
0.0 0.2 0.4 0.6 0.8 1.0
0.0 0.2 0.4 0.6 0.8
A B
1.0C D
ER stress sensor
apoptosis inducer autophagy
inducer mTOR
mTOR inhibitor
autophagy inducer
a p opt o si s i nduc e r
HIGH STRESS
ap o p to si s i n d u ce r
ER stress level
LOW STRESS HIGH STRESS
0 20 40 60 80 100 120
0.0 0.2 0.4 0.6 0.8 1.0
ER stress level
LOW STRESS HIGH STRESS
a u to pha g y induc e r
AUTOPHAGY APOPTOSIS
Fig. 6.The effect of combined treatment on cell fate decision. (A) Wiring diagram of the regulatory network when mTOR inhibitor is used. Autophagy inducer, apoptosis inducer, mTOR and crosstalk elements are denoted by isolated boxes. Dashed lines show how the molecules can influence each other. Blocked end lines denote inhibition. (B) Phase plane portrait of crosstalk between autophagy and apoptosis. Red nullcline represents apoptosis inducer, while green nullcline denotes autophagy inducer.
Intersections of nullclines represent the stable (filled circle) and unstable (open circle) steady states. The phase planes are shown for (gray lines) high stress (stress = 25) and for (solid lines) high stress + mTOR inhibitor (stress = 100, mTORT = 0.05). (C) and (D) Signal-response curve of crosstalk between autophagy and apoptosis. The signal- response curve of (C) autophagy inducer and (D) apoptosis inducer are shown with respect to the increasing stress level. The signal-response curves are plotted with (colored lines) and without (gray lines) mTOR inhibitor. Solid lines denote stable states, while dashed line denotes the unstable state. (For interpretation of the references to color in this figure legend, the reader is referred to the web version of this article.)
ing ER stress and can delay or prevent UPR dependent apoptosis activation to relieve the stress. Such a role for autophagy in delay- ing cell death has been reported under nutrient starvation stress with both autophagy and apoptosis sharing antagonistic relationship.
Nutrient starvation condition is known to inhibit mTOR and increase autophagy activity [33]. We confirmed that under ER stress mTOR has dual roles of activating apoptosis and inhibiting autophagy. Thus, inhibiting mTOR by rapamycin or metyrapone in ER stress-induced cells leads to increase in cell viability (Fig. 2). We observed that this increase is accompanied by signifi- cant increase in autophagy due to mTOR pathway inhibition even at low level of ER stressor (Figs. 3 and 4). Previous studies claimed that inhibition of autophagy under ER stress accelerates cell death and loss of function mutation of ATG1 suppresses the positive effect of rapamycin on cell survival[29,38]. Based on these obser- vations, we conclude that UPR activates autophagy as a control strategy to delay apoptosis since it also serve as an activator of apoptosis.
In our previous study, we showed by a mathematical model how stress modulates the activation of autophagy and apoptosis using common regulatory player Bcl2 and crosstalk between these cellu- lar processes [45]. Although the regulatory design remains the same under different stress conditions, cell type- and stress-specific regulatory players additionally influence the dynamics of cell sur- vival-cell death decision. One such example is mTOR, which is shown to promote cell death under ER stress. This is in contrast to its roles in cell growth and suppression of stress responses such as autophagy. We have analyzed with help of mathematical model the influence of mTOR on the dynamics of autophagy and apoptosis activation under ER stress. Both phase plane and bifurcation analy- sis of the model showed that the stress threshold for apoptosis acti- vation is sensitive to mTOR activity and can increase with decrease in mTOR activity (Figs. 5 and 6). Thus, inhibition of mTOR activity with rapamycin or metyrapone increased the threshold for apopto- sis activation to higher stress levels thereby suppressing cell death under ER stress (Fig. 6andFig. S7). In the minimal model, mTOR can influence the threshold in two ways: by controlling the apoptosis inducer directly and by inhibiting autophagy, which has negative effect on apoptosis inducer. We observed that perturbing either of them fails to suppress cell death under high ER stress suggesting that mTOR might contribute to cell death through different routes (Figs. S8 and S9). Another way that mTOR can promote apoptosis activation is by increasing the burden on ER through protein syn- thesis. As a consequence, both mTOR and ER stress sensor, UPR can form a dangerous positive feedback loop to amplify the stress level beyond the threshold required to induce apoptosis. Thus, altering the stress threshold (by enhancing autophagy) or prevent- ing an increase in stress level (by protein synthesis inhibition) is sufficient to rescue cells from death under high ER stress.
It can be noted that the model also incorporates the mutual antagonism between mTOR and autophagy controlled by UPR.
mTOR is active under stress free situation to promote growth and can inhibit autophagy. This creates a situation how autophagy is turned on under ER stress. The model explains this situation through rapid activation of autophagy by UPR in comparison to mTOR. As a result, autophagy overcomes its inhibition to suppress both mTOR and apoptosis at low stress level. On the other hand, at high stress level, the extent of UPR activation increases which lead to an increase in the rate of activation of apoptosis and mTOR to overcome autophagy. Thus, mTOR inactivation is only transient under high stress level. Therefore, mTOR inhibition by rapamycin or metyrapone results in sustained activation of autophagy that can prevent apoptosis activation. The model predicts that mTOR activity temporally varies as a function of ER stress levels to control cell fate decisions.
Our experimental and mathematical data highlight the contri- bution of UPR, mTOR and autophagy towards establishing the stress threshold for apoptosis activation. Therefore, the dynamics of apoptotic pathway is not only influenced by the feedback loops within this pathway but also by the crosstalk with UPR, mTOR and autophagy. Our study provides a framework to build a comprehen- sive model of crosstalk between pathways in the control of cell sur- vival-cell death decision.
ER stress dependent cell death is an important factor in the pathomechanism of various human pathologies (e.g. neurodegen- erative diseases, obesity-related diseases, proteinopathies). Stimu- lation of autophagy via mTOR inhibition either by lifestyle changes (nutrient starvation) or by pharmacological agents (calorie restric- tion mimetics, mTOR inhibitors) can be a tool to combat these dis- eases. Further development of our mathematical model formulated on an experimental ground can have a biomedical value in the identification of targets and in the evaluation of the efficacy of agents.
Acknowledgment
O.K. is thankful to János Bolyai Research Scholarship of the Hun- garian Academy of Sciences. This work was supported by the Hun- garian Scientific Research Fund (OTKA-PD 104110).
Appendix A. Supplementary data
Supplementary data associated with this article can be found, in the online version, athttp://dx.doi.org/10.1016/j.fob.2014.07.006.
References
[1] Alberts, A.J.B., Lewis, J., Raff, M., Roberts, K. and Walter, P. (2002) Molecular Biology of the Cell, fourth ed, Garland Science, New York.
[2] Cannon, W.B. (1929) Organization for physiological homeostasis. Physiol. Rev.
9, 399–431.
[3] Maiuri, M.C., Zalckvar, E., Kimchi, A. and Kroemer, G. (2007) Self-eating and self-killing: crosstalk between autophagy and apoptosis. Nat. Rev. Mol. Cell Biol. 8, 741–752.
[4] Lyons, S.M. and Prasad, A. (2012) Cross-talk and information transfer in mammalian and bacterial signaling. PLoS One 7, e34488.
[5] Gorlach, A., Klappa, P. and Kietzmann, T. (2006) The endoplasmic reticulum:
folding, calcium homeostasis, signaling, and redox control. Antioxid. Redox Signal. 8, 1391–1418.
[6] Ron, D. and Walter, P. (2007) Signal integration in the endoplasmic reticulum unfolded protein response. Nat. Rev. Mol. Cell Biol. 8, 519–529.
[7] Hebert, D.N. and Molinari, M. (2007) In and out of the ER: protein folding, quality control, degradation, and related human diseases. Physiol. Rev. 87, 1377–1408.
[8] Fu, S., Watkins, S.M. and Hotamisligil, G.S. (2012) The role of endoplasmic reticulum in hepatic lipid homeostasis and stress signaling. Cell Metab. 15, 623–634.
[9] Csala, M., Margittai, E. and Banhegyi, G. (2010) Redox control of endoplasmic reticulum function. Antioxid. Redox Signal. 13, 77–108.
[10] Michalak, M., Robert Parker, J.M. and Opas, M. (2002) Ca2+signaling and calcium binding chaperones of the endoplasmic reticulum. Cell Calcium 32, 269–278.
[11]Malhi, H. and Kaufman, R.J. (2011) Endoplasmic reticulum stress in liver disease. J. Hepatol. 54, 795–809.
[12]Tabas, I. and Ron, D. (2011) Integrating the mechanisms of apoptosis induced by endoplasmic reticulum stress. Nat. Cell Biol. 13, 184–190.
[13]Hetz, C. (2012) The unfolded protein response: controlling cell fate decisions under ER stress and beyond. Nat. Rev. Mol. Cell Biol. 13, 89–102.
[14]Walter, P. and Ron, D. (2011) The unfolded protein response: from stress pathway to homeostatic regulation. Science 334, 1081–1086.
[15]Hoyer-Hansen, M., Bastholm, L., Szyniarowski, P., Campanella, M., Szabadkai, G., et al. (2007) Control of macroautophagy by calcium, calmodulin-dependent kinase kinase-beta, and Bcl-2. Mol. Cell 25, 193–205.
[16]Lytton, J., Westlin, M. and Hanley, M.R. (1991) Thapsigargin inhibits the sarcoplasmic or endoplasmic reticulum Ca-ATPase family of calcium pumps. J.
Biol. Chem. 266, 17067–17071.
[17]Criollo, A., Maiuri, M.C., Tasdemir, E., Vitale, I., Fiebig, A.A., et al. (2007) Regulation of autophagy by the inositol trisphosphate receptor. Cell Death Differ. 14, 1029–1039.
[18]Eckardt, K. (1983) Tunicamycins, streptovirudins, and corynetoxins, a special subclass of nucleoside antibiotics. J. Nat. Prod. 46, 544–550.
[19]Ganley, I.G., Wong, P.M., Gammoh, N. and Jiang, X. (2011) Distinct autophagosomal-lysosomal fusion mechanism revealed by thapsigargin- induced autophagy arrest. Mol. Cell 42, 731–743.
[20] Larsson, O., Carlberg, M. and Zetterberg, A. (1993) Selective killing induced by an inhibitor of N-linked glycosylation. J. Cell Sci. 106 (Pt 1), 299–307.
[21]Jiang, S., Chow, S.C., Nicotera, P. and Orrenius, S. (1994) Intracellular Ca2+
signals activate apoptosis in thymocytes: studies using the Ca(2+)-ATPase inhibitor thapsigargin. Exp. Cell Res. 212, 84–92.
[22]Szaraz, P., Banhegyi, G. and Benedetti, A. (2010) Altered redox state of luminal pyridine nucleotides facilitates the sensitivity towards oxidative injury and leads to endoplasmic reticulum stress dependent autophagy in HepG2 cells.
Int. J. Biochem. Cell Biol. 42, 157–166.
[23]Marcolongo, P., Piccirella, S., Senesi, S., Wunderlich, L., Gerin, I., et al. (2007) The glucose-6-phosphate transporter-hexose-6-phosphate dehydrogenase- 11beta-hydroxysteroid dehydrogenase type 1 system of the adipose tissue.
Endocrinology 148, 2487–2495.
[24]Marcolongo, P., Senesi, S., Gava, B., Fulceri, R., Sorrentino, V., et al. (2008) Metyrapone prevents cortisone-induced preadipocyte differentiation by depleting luminal NADPH of the endoplasmic reticulum. Biochem.
Pharmacol. 76, 382–390.
[25]Kapuy, O. and Banhegyi, G. (2013) Depletion of luminal pyridine nucleotides in the endoplasmic reticulum activates autophagy with the involvement of mTOR pathway. BioMed Res. Int. 2013, 942431.
[26]Ravikumar, B., Sarkar, S., Davies, J.E., Futter, M., Garcia-Arencibia, M., et al.
(2010) Regulation of mammalian autophagy in physiology and pathophysiology. Physiol. Rev. 90, 1383–1435.
[27]Hoyer-Hansen, M. and Jaattela, M. (2007) Connecting endoplasmic reticulum stress to autophagy by unfolded protein response and calcium. Cell Death Differ. 14, 1576–1582.
[28]Klionsky, D.J. and Ohsumi, Y. (1999) Vacuolar import of proteins and organelles from the cytoplasm. Annu. Rev. Cell Dev. Biol. 15, 1–32.
[29]Ogata, M., Hino, S., Saito, A., Morikawa, K., Kondo, S., et al. (2006) Autophagy is activated for cell survival after endoplasmic reticulum stress. Mol. Cell. Biol.
26, 9220–9231.
[30] Levine, B. and Kroemer, G. (2008) Autophagy in the pathogenesis of disease.
Cell 132, 27–42.
[31]Wang, S.Y. and Kaufman, R.J. (2012) The impact of the unfolded protein response on human disease. J. Cell Biol. 197, 857–867.
[32]Xu, C., Bailly-Maitre, B. and Reed, J.C. (2005) Endoplasmic reticulum stress:
cell life and death decisions. J. Clin. Invest. 115, 2656–2664.
[33]Watanabe, R., Wei, L. and Huang, J. (2011) mTOR signaling, function, novel inhibitors, and therapeutic targets. J. Nucl. Med. 52, 497–500.
[34]Hay, N. and Sonenberg, N. (2004) Upstream and downstream of mTOR. Genes Dev. 18, 1926–1945.
[35]Appenzeller-Herzog, C. and Hall, M.N. (2012) Bidirectional crosstalk between endoplasmic reticulum stress and mTOR signaling. Trends Cell Biol. 22, 274–
282.
[36] Zoncu, R., Efeyan, A. and Sabatini, D.M. (2011) mTOR: from growth signal integration to cancer, diabetes and ageing. Nat. Rev. Mol. Cell Biol. 12, 21–35.
[37] Kato, H., Nakajima, S., Saito, Y., Takahashi, S., Katoh, R., et al. (2012) mTORC1 serves ER stress-triggered apoptosis via selective activation of the IRE1-JNK pathway. Cell Death Differ. 19, 310–320.
[38] Ravikumar, B., Berger, Z., Vacher, C., O’Kane, C.J. and Rubinsztein, D.C. (2006) Rapamycin pre-treatment protects against apoptosis. Hum. Mol. Genet. 15, 1209–1216.
[39] Ozean, U., Ozcan, L., Yilmaz, E., Duvel, K., Sahin, M., et al. (2008) Loss of the tuberous sclerosis complex tumor suppressors triggers the unfolded protein response to regulate insulin signaling and apoptosis. Mol. Cell 29, 541–551.
[40] Hyrskyluoto, A., Reijonen, S., Kivinen, J., Lindholm, D. and Korhonen, L. (2012) GADD34 mediates cytoprotective autophagy in mutant huntingtin expressing cells via the mTOR pathway. Exp. Cell Res. 318, 33–42.
[41] Gordy, C. and He, Y.W. (2012) The crosstalk between autophagy and apoptosis: where does this lead? Protein Cell 3, 17–27.
[42] Eisenberg-Lerner, A., Bialik, S., Simon, H.U. and Kimchi, A. (2009) Life and death partners: apoptosis, autophagy and the cross-talk between them. Cell Death Differ. 16, 966–975.
[43] Djavaheri-Mergny, M., Maiuri, M.C. and Kroemer, G. (2010) Cross talk between apoptosis and autophagy by caspase-mediated cleavage of Beclin 1. Oncogene 29, 1717–1719.
[44] Wirawan, E., Vande Walle, L., Kersse, K., Cornelis, S., Claerhout, S., et al. (2010) Caspase-mediated cleavage of Beclin-1 inactivates Beclin-1-induced autophagy and enhances apoptosis by promoting the release of proapoptotic factors from mitochondria. Cell Death Dis. 1, e18.
[45] Kapuy, O., Vinod, P.K., Mandl, J. and Banhegyi, G. (2013) A cellular stress- directed bistable switch controls the crosstalk between autophagy and apoptosis. Mol. BioSyst. 9, 296–306.
[46] Kaplan, D. and Glass, L. (1995) Understanding Nonlinear Dynamics, Springer- Verlag, New York.
[47] Tyson, J.J., Chen, K.C. and Novak, B. (2003) Sniffers, buzzers, toggles and blinkers: dynamics of regulatory and signaling pathways in the cell. Curr.
Opin. Cell Biol. 15, 221–231.
[48] Strogatz, H.S. (1994) Nonlinear Dynamics and Chaos, Addison-Wesley Co., Reading, MA.
[49] Noda, T. and Ohsumi, Y. (1998) Tor, a phosphatidylinositol kinase homologue, controls autophagy in yeast. J. Biol. Chem. 273, 3963–3966.
[50] Jung, C.H., Seo, M., Otto, N.M. and Kim, D.H. (2011) ULK1 inhibits the kinase activity of mTORC1 and cell proliferation. Autophagy 7, 1212–1221.
[51] Dunlop, E.A., Hunt, D.K., Acosta-Jaquez, H.A., Fingar, D.C. and Tee, A.R. (2011) ULK1 inhibits mTORC1 signaling, promotes multisite Raptor phosphorylation and hinders substrate binding. Autophagy 7, 737–747.