Trends in Utilization of Fish and Shellfish
GEORG BORGSTROM
Department of Food Science, Michigan State University, East Lansing, Michigan
I. Introduction 638 II. Fish Catch per Capita 639
III. Marine and Fresh-Water Characteristics 644
A. Utilization Pattern 644 B. Comparisons between Relative and Absolute Quantities 645
IV. General Survey of Disposal Channels 649
V. Remote Fishing 654 A. Soviet Expansion 654 B. Japanese Endeavors 655 C. Other Countries 656 VI. Floating Factories 656
A. General 656 B. Freezing Trawlers 658
C. Floating Canneries 659
D. Barges 660 E. Salting Units 660 F. Factory and Motherships in General 661
G. Transporting Vessels 662 H. Fish Meal Factories 662 I. Fishing Vessels 662 VII. Fresh Market Fish 663
A. General 663 B. Utilization Pattern 663
C. Filleting 666 D. Investments 666 E. Miscellaneous 667 VIII. Curing, Smoking, and Drying 668
A. General 668 B. Drying 670 C. Salting 671 D. Smoking 672 E. Specialties 673 IX. Canning 674
X. Freezing 678 XL Industrial Fish Utilization 683
A. Terminology 683 B. Silage . 683 C. Meal 684 D. Flour 689 XII. Herring, Sardine, and Pilchard 689
637
XIII. Redfish 691 XIV. Sand Eels 691
XV. Tuna 691 XVI. Shark 694 XVII. Crustaceans 694
A. General 694 B. King Crab 694 C. Rock Lobster 695 D. Shrimp 695 E. Centolla 695 XVIII. Cephalopods 698
XIX. Whale Utilization 698 A. General 700 B. Whale OÜ 700 XX. Special Fish Products 702
XXI. Fish Oils 702 A. Body Oils 704 B. Liver Oils 704 XXII. Factors in Utilization 705
A. Seasonality 705 B. Regionally 706 C. Consumption Trends 706
D. Fishing Trends 707 XXIII. Utilization Patterns in Selected Countries 707
A. Japan 707 B. United Kingdom 707
C. Iceland 708 XXIV. Waste Utilization 708
XXV. Trade Patterns 709 A. General 709 B. Fish: Fresh, Chilled, or Frozen 711
C. Fish: Dried, Salted, or Smoked 713 D. Crustaceans and Mollusks: Fresh, Dried, and Salted 714
E. Canned Seafood 715 F. Aquatic Oils and Fats 717 G. Imports in Food Balance 717 H. Fish Meal and Solubles 718
References 722
Introduction
It is becoming increasingly difficult to differentiate major trends in the utilization of fish and shellfish catches. Primarily, this is due to the fact that a substantial portion of the fish catch nowadays is processed more than one way. In other words, there is an appreciable discrepancy between the methods employed for primary utilization and the preser
vation methods which industry uses for final preparation of the prod
ucts for market. In the future it would be most desirable if a clear distinction could be made between the handling and preservation of
the original catch, and the final processing and marketing of the fish.
The utilization pattern would then emerge as quite modified in many countries.
A few examples will clearly illustrate these implications. More and more fresh market fish is not actually the original raw fish as captured but fish which has been frozen and then defrosted and, in many cases, also filleted. Another example: only very small quantities of fish are now preserved directly by smoking. Most of the raw material being used for this purpose consists of either salted or defrosted frozen fish. Further
more, freezing has moved up as one of the major methods for rapid preservation of vast quantities of raw material and makes a substantial contribution to the canning industry by providing readily available, high-quality raw material. This is largely true in the Soviet Union, and applies to the French sardine industry as well as the salmon and tuna industries of the United States. Many more examples could be mentioned to illustrate this growing gap between the primary utilization and the final pattern, which might be some two or three stages removed from the initial preservation. Very few statistics allow an adequate analysis of this problem. The situation is further complicated by the fact that although most figures refer to primary utilization, some countries submit official figures showing the final use. A few such cases will be anayzed further below. There is no consistent ruling in this respect. In a few cases, the figures reflect both the primary and secondary utilization, that is, the same fish is counted both as frozen and canned or both as salted and smoked, which also contributes to the confusion. This means that often the total amount of fish which, according to the statistics, is being utilized may exceed the total catch, thus implying that the country imports, which may not be true. Recognizing these difficulties, certain general trends can still be envisoned and a few important con
clusions drawn as to the present trends in fish and shellfish utilization (see Tables I and II).
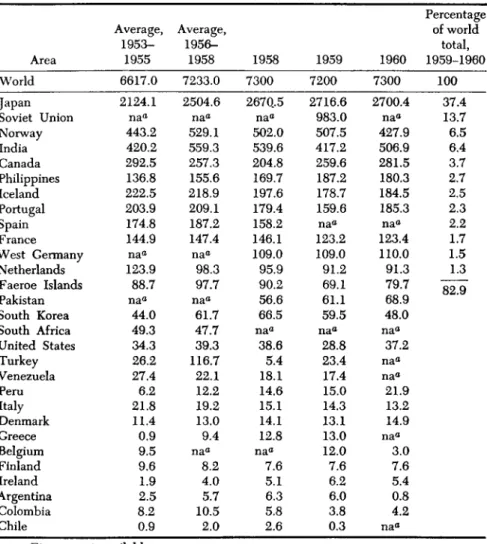
II. Fish Catch per Capita
The utilization pattern naturally is largely determined by the size of the catch in relation to the population of each fishing nation. It is one thing to meet the domestic needs of a human population; to what degree profitable and reliable markets are developed in other countries is quite another matter. As one uses the term "subsistence fishing" in relation to the fisherman's own family, one may use this term in relation to a whole country. Most nations are in this sense either self-sustaining with fish, or short of their needs and have to resort to importation to fill the regular needs. The United States is the leading buyer on the
TABLE I UTILIZATION OF TOTAL FISH CATCH BY AREA (1960) Area World Japan Soviet Union Peru United States Norway India United Kingdom Canada Spain» West Germany Indonesia Canada (excluding Newfoundland) Denmark Iceland France (including Algeria) Philippines South Africa0 South Korea Netherlands Pakistan Newfoundland*
Total catch (1000 metric tons) 37,700 6192.5 3500 3501.4 2796.9 1598.9 1159.9 1070.6 915.2 836.7 743.0 753.7 713.2 581.2 592.8 521.1 475.8 465.8 342.5 314.7 304.5 294.1
Fresh (%) 40.0 22^6 15.5 2.3 30.0 10.8 47.9 79.8 20.6 65.9 35.1 80ö 22.0 22.7 7.8 60.2 62.1 19.8 82.4 47.5 71.8 2.2
Freezing (%) 9.0 12.8 30.5 0.5 11.2 9.7 — 11.2 29.9 — 5.2 — 22.0 12.1 42.4 — — 6.1 0.1 3.7 0.5
35.1
Curing (%) 19.0 43.6 30.2 0.6 1.3 26.8 43.7 2.6 30.8 Ί 8.9 14.8 20*> 17.3 2.6 31.1 23.7 37.9 15.5 14.0 29.0 22.6 53.0
Canning (%) 9.0 67 11.8 1.9 22.8 3.0 — 0.9 7.2 12.4 26.5 — 9.5 3.1 0.1 16.1 — 11.6 2.5 8.5 — 0.1
Reduction (%) 20.0 13.9 10.8 94.7 34.4 48.8 8.4 3.0 9.3 2.8 18.3 — 25.5 50.1 18.6 — —
46.8 — 4.8 5.1 —
Miscellaneous (%) 3 04 0.1 — 0.2 0.1 — 2.4 2.4 — — — 3.7 9.4 — — — 0.2 1.0 5.1 — 9.7
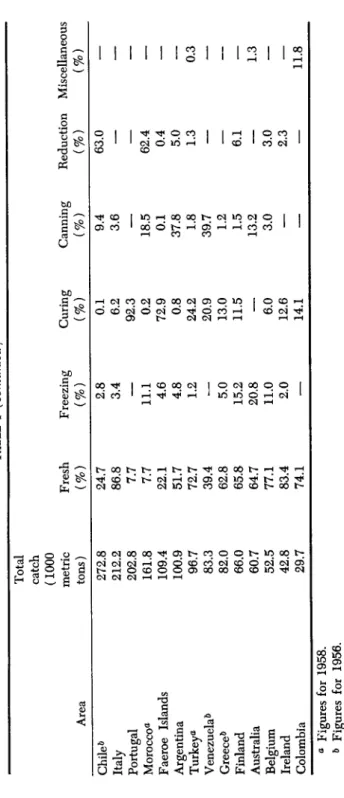
TABLE I (continued) Total catch (1000 metric Fresh Freezing Curing Canning Reduction Miscellaneous Area tons) (%) (%) (%) (%) (%) (%) Chile» 272.8 24.7 2.8 0.1 9.4 63.0 — Italy 212.2 86.8 3.4 6.2 3.6 — — Portugal 202.8 7.7 — 92.3 — — — Morocco* 161.8 7.7 11.1 0.2 18.5 62.4 — Faeroe Islands 109.4 22.1 4.6 72.9 0.1 0.4 — Argentina 100.9 51.7 4.8 0.8 37.8 5.0 0.3 Turkey* 96.7 72.7 1.2 24.2 1.8 1.3 0.3 Venezuela0 83.3 39.4 — 20.9 39.7 — — Greece0 82.0 62.8 5.0 13.0 1.2 — — Finland 66.0 65.8 15.2 11.5 1.5 6.1 — Australia 60.7 64.7 20.8 — 13.2 — 1.3 Belgium 52.5 77.1 11.0 6.0 3.0 3.0 — Ireland 42.8 83.4 2.0 12.6 — 2.3 — Colombia 29.7 74.1 — 14.1 — — 11.8 a Figures for 1958. & Figures for 1956. c Figures for 1959.
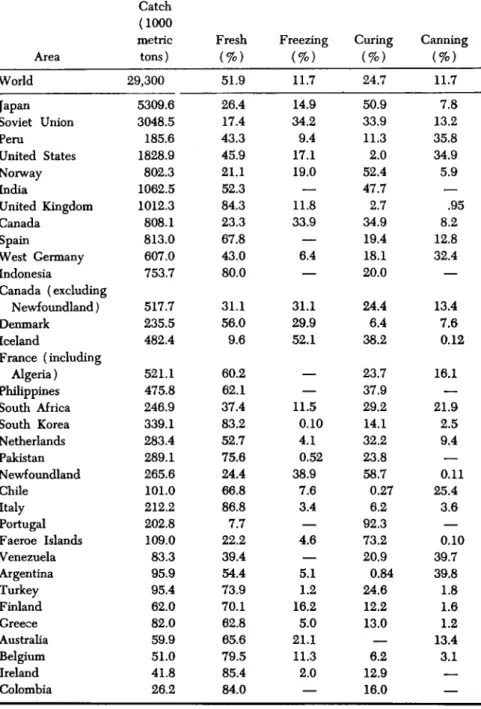
TABLE II
UTILIZATION OF FOOD FISH BY AREA ( 1 9 6 0 )
Area World Japan Soviet Union Peru
United States Norway India
United Kingdom Canada
Spain
West Germany Indonesia
Canada (excluding Newfoundland) Denmark Iceland
France (including Algeria) Philippines South Africa South Korea Netherlands Pakistan Newfoundland Chile
Italy Portugal Faeroe Islands Venezuela Argentina Turkey Finland Greece Australia Belgium Ireland Colombia
Catch (1000 metric tons) 29,300
5309.6 3048.5 185.6 1828.9 802.3 1062.5 1012.3 808.1 813.0 607.0 753.7 517.7 235.5 482.4 521.1 475.8 246.9 339.1 283.4 289.1 265.6 101.0 212.2 202.8 109.0 83.3 95.9 95.4 62.0 82.0 59.9 51.0 41.8 26.2
Fresh (%)
51.9 26.4 17.4 43.3 45.9 21.1 52.3 84.3 23.3 67.8 43.0 80.0 31.1 56.0 9.6 60.2 62.1 37.4 83.2 52.7 75.6 24.4 66.8 86.8 7.7 22.2 39.4 54.4 73.9 70.1 62.8 65.6 79.5 85.4 84.0
Freezing (%)
11.7 14.9 34.2 9.4 17.1 19.0
— 11.8 33.9
— 6.4
— 31.1 29.9 52.1
—
— 11.5 0.10 4.1 0.52 38.9
7.6 3.4
— 4.6
— 5.1 1.2 16.2 5.0 21.1 11.3 2.0
Curing (%) 24.7 50.9 33.9 11.3 2.0 52.4 47.7 2.7 34.9 19.4 18.1 20.0 24.4 6.4 38.2 23.7 37.9 29.2 14.1 32.2 23.8 58.7 0.27 6.2 92.3 73.2 20.9 0.84 24.6 12.2 13.0
— 6.2 12.9 16.0
Canning (%)
11.7 7.8 13.2 35.8 34.9 5.9
— .95 8.2 12.8 32.4
— 13.4 7.6 0.12 16.1
— 21.9 2.5 9.4
— 0.11 25.4
3.6
— 0.10 39.7 39.8 1.8 1.6 1.2 13.4 3.1 :— ___
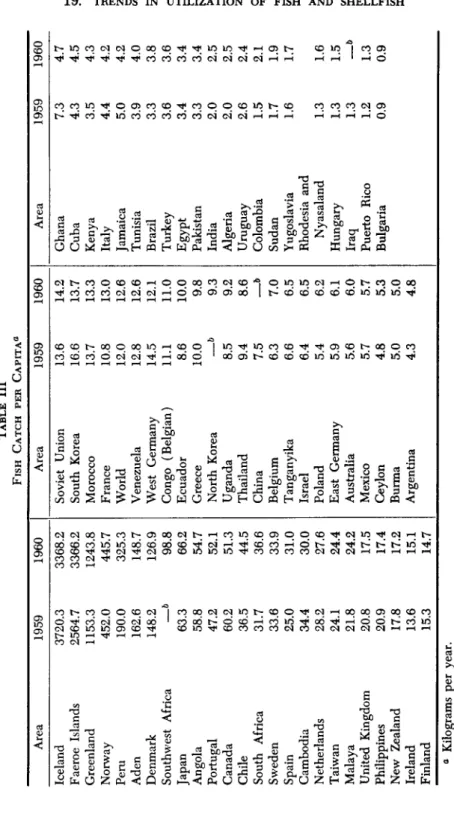
TABLE III FISH CATCH PER CAPITA0 Area 1959 1960 Area 1959 1960 Area 1959 1960 Iceland 3720.3 3368.2 Soviet Union 13.6 14.2 Ghana 7.3 4.7 Faeroe Islands 2564.7 3366.2 South Korea 16.6 13.7 Cuba 4.3 4.5 Greenland 1153.3 1243.8 Morocco 13.7 13.3 Kenya 3.5 4.3 Norway 452.0 445.7 France 10.8 13.0 Italy 4.4 4.2 Peru 190.0 325.3 World 12.0 12.6 Jamaica 5.0 4.2 Aden 162.6 148.7 Venezuela 12.8 12.6 Tunisia 3.9 4.0 Denmark 148.2 126.9 West Germany 14.5 12.1 Brazil 3.3 3.8 Southwest Africa δ 98.8 Congo (Belgian) 11.1 11.0 Turkey 3.6 3.6 Japan 63.3 66.2 Ecuador 8.6 10.0 Egypt 3.4 3.4 Angola 58.8 54.7 Greece 10.0 9.8 Pakistan 3.3 3.4 Portugal 47.2 52.1 North Korea δ 9.3 India 2.0 2.5 Canada 60.2 51.3 Uganda 8.5 9.2 Algeria 2.0 2.5 Chile 36.5 44.5 Thailand 9.4 8.6 Uruguay 2.6 2.4 South Africa 31.7 36.6 China 7.5 b Colombia 1.5 2.1 Sweden 33.6 33.9 Belgium 6.3 7.0 Sudan 1.7 1.9 Spain 25.0 31.0 Tanganyika 6.6 6.5 Yugoslavia 1.6 1.7 Cambodia 34.4 30.0 Israel 6.4 6.5 Rhodesia and Netherlands 28.2 27.6 Poland 5.4 6.2 Nyasaland 1.3 1.6 Taiwan 24.1 24.4 East Germany 5.9 6.1 Hungary 1.3 1.5 Malaya 21.8 24.2 Australia 5.6 6.0 Iraq 1.3 b United Kingdom 20.8 17.5 Mexico 5.7 5.7 Puerto Rico 1.2 1.3 Philippines 20.9 17.4 Ceylon 4.8 5.3 Bulgaria 0.9 0.9 New Zealand 17.8 17.2 Burma 5.0 5.0 Bulgaria Ireland 13.6 15.1 Argentina 4.3 4.8 Finland 15.3 14.7 α Kilograms per year. b Figures not available.
food fish market, importing in excess of one billion pounds—chiefly shrimp and frozen whitefish fillets (see further section XX, below).
A few countries constitute excess-catch regions and have been con- verted into large raw material bases for fish, providing several countries in this respect. Such activities have extensive preservation as a pre- requisite. One way of gauging the significance of such fish provision to the world market is to measure the total fish catch per capita. In this way one can readily indicate which are the truly leading nations of the world, not in terms of absolute volume, but judged on the basis of total annual catch per capita. Table III gives these figures for a number of countries. The North Atlantic region—Iceland, the Faeroe Islands, and Greenland—takes the lead with no less than 1.2 to 3.7 metric tons per capita—far above any reasonable individual consumption. Relative to active fishermen this figure gets still greater. Salting used to be the chief method for preserving large excess catches. Freezing is gradually taking its place. Several minor regions—some Pacific islands and several African colonies—also show notably high catch figures per capita, as the accom- panying tabulation indicates (average, 1958-1959).
Region
St. Pierre and Miquelon (Gulf of St. Lawrence) U.S. Samoa (South Pacific)
Spanish Sahara (Tropical Africa) Melilla (North Africa)
Ceuta (North Africa)
Catch per capita (kg/year)
1880.0 577.3 307.7 98.8 82.0
In most of these cases, preserving and trading is limited and most of the catch is eaten locally. Some is possibly wasted by not reaching the consumer prior to detrimental spoilage.
III. Marine and Fresh-Water Characteristics
A. UTILIZATION PATTERN
The utilization patterns for fresh-water and salt-water fish are basi- cally quite different. Fresh-water catches are generally distributed shorter distances and require less intense processing. In most countries most of the fresh-water fish is eaten within a reasonably short distance from the area of capture. There seem to be only two major exceptions to this general rule. One is the mainland of China, where an extensive network of refrigerated warehouses and fish processing plants are being installed around major lakes. The production of these lakes has been increased considerably to serve distant populations with an important protein
addition. This is particularly true of the large salt-water lake of the interior highland, Koko-nor (see further Chapter 7).
The second exception is offered by the postwar development in continental Europe, Canada, and the United States of combining fish cultivation with freezing or canning plants. Japan has recently introduced canned rainbow trout on the United States market. Frozen rainbow trout from cultivated sources in Denmark and Japan is being marketed in the United States in competition with similar trout from domestic establishments. In Denmark cultivated trout from 425 ponds constitute 90% of all fresh-water fish. Their annual production of such trout now exceeds 6000 metric tons (1960). The annual feed consumption of these trout ponds amounts to 45,000 tons, mostly fish and fish offal (N0rgaard, 1961).
Present development plans in the Soviet Union have been based on fish cultivation organized on a regional basis to provide the local popu- lation. Not only are major areas provided with fish-raising ponds, but most major cities are establishing sizeable fish-producing centers in their vicinity. This fish will probably reach the local market without any preserving operation other than simple icing, combined with a rapid delivery.
Inland fisheries seem amenable to considerable development not only by a better management of the wild stocks in lakes and rivers, but also by applying improved methods of fish culture in enclosed bodies of water, such as ponds, reservoirs, and irrigation systems. In 1960 slightly over 4 million tons of fish came from the inland waters, and half of that originated in Asia, the center since ancient days for artificial fish raising. The true quantity, however, exceeded this figure, as fishing in local waters constitutes a major basis for subsistence for the population throughout Southeast Asia and China. Fish culture is most essential in areas with limited transportation and restricted storage facilities. In some cases it even turns out to be more economical than investment in those two areas of distribution. It should therefore be noted that any expansion of fish cultivation will have its immediate effect on the utilization pattern in general for each individual country. The culti- vation of fish in brackish and salt-water is important in many countries, such as Indonesia, the Philippines, and China. No less than 441,720 tons of cultivated aquatic products—emerged from marine sources in China
(Saburenkov, 1961).
B. COMPARISONS BETWEEN RELATIVE AND ABSOLUTE QUANTITIES
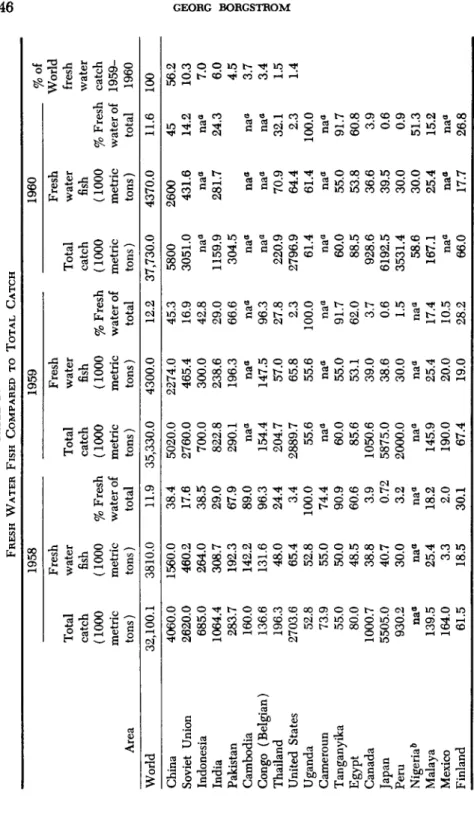
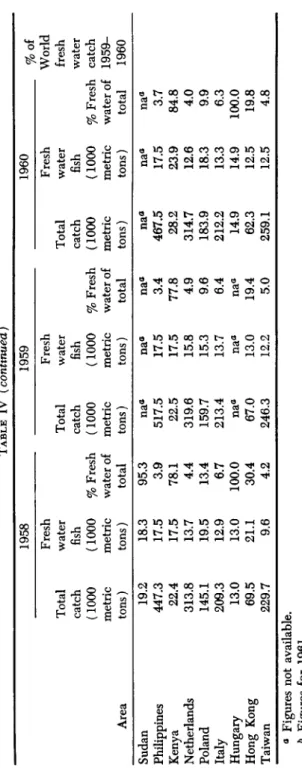
Table IV shows on one hand, those countries which entirely or to an overwhelming degree depend on fresh-water fish and, on the other
TABLE IV FRESH WATER FISH COMPARED TO TOTAL CATCH Area World China Soviet Union Indonesia India Pakistan Cambodia Congo (Belgian) Thailand United States Uganda Cameroun Tanganyika Egypt Canada Japan Peru Nigeria0 Malaya Mexico Finland
Total catch (1000 metric tons) 32,100.1 4060.0 2620.0 685.0 1064.4 283.7 160.0 136.6 196.3 2703.6 52.8 73.9 55.0 80.0 1000.7 5505.0 930.2 naa 139.5 164.0 61.5
1958 Fresh water fish (1000 metric tons) 3810.0 1560.0 460.2 264.0 308.7 192.3 142.2 131.6 48.0 65.4 52.8 55.0 50.0 48.5 38.8 40.7 30.0 naa 25.4 3.3 18.5
% Fresh water of total 11.9 38.4 17.6 38.5 29.0 67.9 89.0 96.3 24.4 3.4 100.0 74.4 90.9 60.6 3.9 0.72 3.2 naa 18.2 2.0 30.1
Total catch (1000 metric tons) 35,330.0 5020.0 2760.0 700.0 822.8 290.1 naa 154.4 204.7 2889.7 55.6 naa 60.0 85.6 1050.6 5875.0 2000.0 naa 145.9 190.0 67.4
1959 Fresh water fish (1000 metric tons) 4300.0 2274.0 465.4 300.0 238.6 196.3 naa 147.5 57.0 65.8 55.6 naa 55.0 53.1 39.0 38.6 30.0 naa 25.4 20.0 19.0
% Fresh water of total 12.2 45.3 16.9 42.8 29.0 66.6 naa 96.3 27.8 2.3 100.0 naa 91.7 62.0 3.7 0.6 1.5 naa 17.4 10.5 28.2
Total catch (1000 metric tons) 37,730.0 5800 3051.0 naa 1159.9 304.5 naa naa 220.9 2796.9 61.4 naa 60.0 88.5 928.6 6192.5 3531.4 58.6 167.1 naa 66.0
1960 Fresh water
fish (100
0 metric tons) 4370.0 2600 431.6 naa 281.7 naa naa 70.9 64.4 61.4 naa 55.0 53.8 36.6 39.5 30.0 30.0 25.4 naa 17.7
% Fresh water of total 11.6
45 14.
2 naa 24.3 naa naa 32.1 2.3 100.0 naa 91.7 60.8 3.9 0.6 0.9 51.3 15.2 naa 26.8
%of World fresh water catch 1959- 1960 100 56.2 10.3 7.0 6.0 4.5 3.7 3.4 1.5 1.4
TABLE IV (continued) co Area Sudan Philippines Kenya Netherlands Poland Italy Hungary Hong Kong Taiwan a Figures & Figures
Total catch (1000 metric tons) 19.2 447.3 22.4 313.8 145.1 209.3 13.0 69.5 229.7 not available. for 1961.
1958 Fresh water fish (1000 metric tons) 18.3 17.5 17.5 13.7 19.5 12.9 13.0 21.1 9.6
% Fresh water of total 95^3 3.9 78.1 4.4 13.4 6.7 100.0 30.4 4.2
Total catch (1000 metric tons) naa 517.5 22.5 319.6 159.7 213.4 naa 67.0 246.3
1959 Fresh water fish (1000 metric tons) naa 17.5 17.5 15.8 15.3 13.7 naa 13.0 12.2
% Fresh water of total naa 3.4 77.8 4.9 9.6 6.4 naa 19.4 5.0
Total catch (1000 metric tons) naa 467.5 28.2 314.7 183.9 212.2 14.9 62.3 259.1
1960 Fresh water fish (1000 metric tons) naa 17.5 23.9 12.6 18.3 13.3 14.9 12.5 12.5
% Fresh water of total naa 3.7 84.8 4.0 9.9 6.3 100.0 19.8 4.8
%of World fresh water catch 1959- 1960
C/5 5
3
P > d O 2 O **i3
8 >i
CAI i 2
^hand, the amounts of fresh-water fish landed by various countries. As to the relative standing, parts of eastern Europe and large sectors of Africa, including the Congo (Belgian), look less to the sea. Among countries with lengthy maritime coastlines, but nevertheless largely depending on fresh-water fish, mention should be made of Pakistan and Cambodia. The latter country, according to a special monograph (Steinberg, 1957), catches 130,000 metric tons in the interior lake Tonle Sap and, furthermore, part of the fish landed off the Gulf of Siam is of fresh-water origin. The FAO figure of 30,000 tons for this country appears to require revision. A recent estimate by Bardach (1962) fixes the figure at around 90,000 tons, as the Tonle Sap no longer yields so much.
Also in the Congo (Belgian) an overwhelming portion of the consumed fish comes from fresh-water, primarily the Congo River as well as a great number of fish ponds built on Belgian initiative in the postwar period.
Particularly notable is Egypt's dependency on local fish resources of the Nile and the part being played by its fresh-water resources. A number of other countries in tropical Africa, such as Uganda, Tanganyika, Sudan, are almost entirely dependent on fresh-water sources.
China is the only major country with extensive seacoast regions where fresh-water fish nevertheless constitutes a major part of the fish catch, accounting for close to half (45.3%) of its catch'in 1959 (Saburenkov, 1961). This relative figure is rapidly dropping as the marine catch now is expanding appreciably under the present ocean drive of mechanized fishing fleets. About the same is true of India where fresh-water fish still accounts for approximately one third of all fish marketed, but the growth of the marine catches is also now reducing its relative importance.
Sixty percent of the Chinese fresh-water harvest is cultivated (Sabu- renkov, 1961). Third on the list as to quantity is the Soviet Union.
The insignificance of fresh-water fishing in Japan and the United States is surprising (see Table IV); the figure for the latter is, however, somewhat misleading as a considerable amount of fresh-water fish is captured by sportsmen and in general is not included in the commercial statistics. In the drive to expand agricultural acreage Japan has reduced its lake and pond area. This intensification of agriculture and the general use of pesticides has further diminished the productivity of artificial ponds. As a whole, an intensified cultivation is taking place, with carp,
"ayu," and eel as leading species, and this is reflected in a slight increase in the total amount of fresh-water fish, although it is still far behind prewar figures. The carp production has fallen drastically, partly due to spray poisoning, and is now approximately one-seventh of the pro- duction level of the 1930's (see further Volume I, Chapter 4).
When analyzed in terms of absolute quantities it turns out that two- fifths of the world's fresh-water fish are caught by the Chinese and pre
sumably also consumed by them. Their lakes and rivers are contributing more fish as food than the marine fish used as human food in the United States. Second in rank stands the Soviet Union, accounting for 10%
of the world total, but this is only a fifth of the Chinese quantity. The difficulties created in the U.S.S.R. by the present expanding industrial
ization without due consideration for the mounting pollution problems, and the expanded use of water for irrigation and hydroelectric purposes, are disrupting natural fish production and reducing the catch from fresh-water sources. These problems have been discussed in detail and analyzed by Borgstrom (1959, 1961b) and Ovchynnyk (1961). Several areas report declines in their catches, such as the Caspian Sea, the Baikal, etc. To some degree this has been compensated for by the raising of fish in artificial ponds and the partial utilization of man-made reservoirs.
Indonesia is a traditional fish-cultivating nation (see Drews in Vol
ume I, Chapter 5) and accounts for more than a quarter million tons of fresh-water and brackish-pond fish. A substantial part is, however, caught in lakes and rivers. The fresh-water catch of India is of the same general magnitude, with Pakistan not far behind—each about 5%
of the world's fresh-water fish.
In most other countries fresh-water fish plays an insignificant role.
Consequently in the following discussion of the utilization pattern for fish it has not been considered necessary in each case tQ subtract the amount of fresh-water fish from the total. It should, however, be borne in mind that most of this fresh-water fish comes under the category of fresh market fish and thus slightly increases this figure in any global comparison.
Since statistical data are not available from the Chinese mainland it is not possible to include China in the following detailed anaysis.
In this particular case, a separate study would have been most en
lightening.
IV. General Survey of Disposal Channels
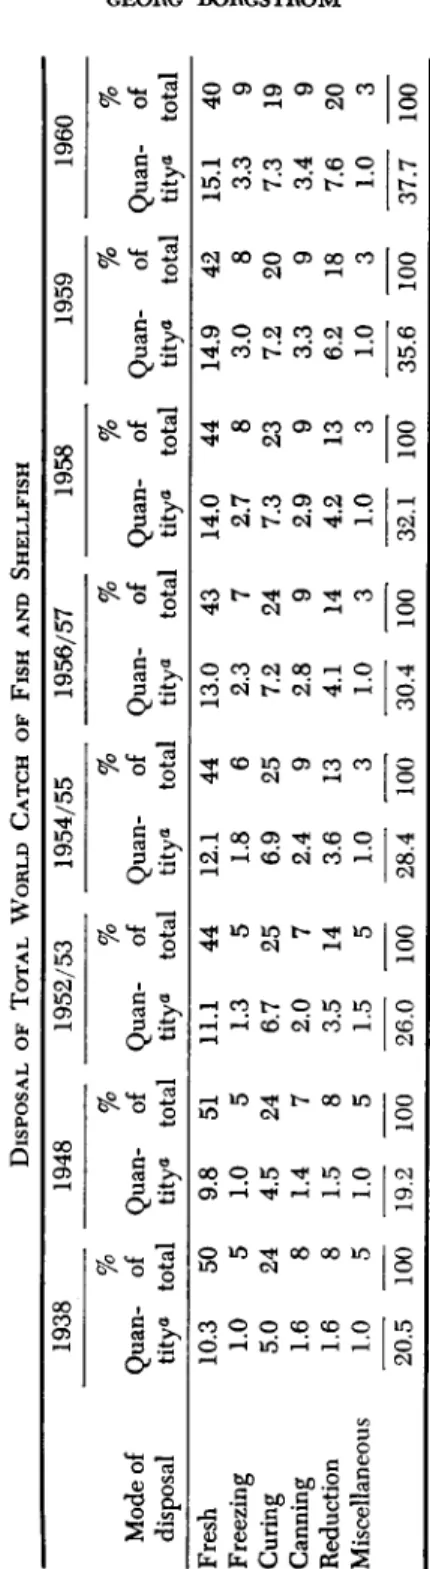
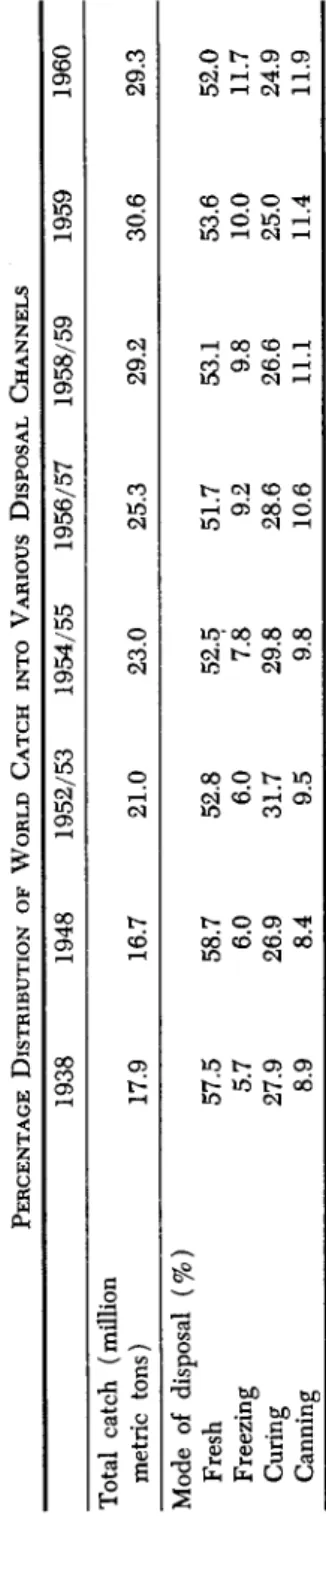
Judging on the basis of the entire world catch, the following picture emerges as to the general disposal of the aquatic harvests. About one half of the catch moves into the fresh market channel, with or without chilling. Relatively this category has shown a declining trend (see Table V), but in absolute quantities it has grown more than 5 million tons since World War II ended. Freezing and canning now take equal portions, each representing about 9% of the total in 1960, whereas curing
TABLE V DISPOSAL OF TOTAL WORLD CATCH OF FISH AND SHELLFISH 1938 194** 1952/53 1954/55 1956/57 1958 1959 1960 % % % % %~ % % % Mode of Quan- of Quan- of Quan- of Quan- of Quan- of Quan- of Quan- of Quan- o disposal titya total tity« total tity« total tity« total tity« total tity<* total tity« total titya tota Fresh Freezing Curing Canning Reduction Miscellaneous
10.3 1.0 5.0 1.6 1.6 1.0 20.5
50 5 24 8 8 5 100
9.8 1.0 4.5 1.4 1.5 1.0 19.2
51 5 24 7 8 5 100
11.1 1.3 6.7 2.0 3.5 1.5 26.0
44 5 25 7 14 5 100
12.1 1.8 6.9 2.4 3.6 1.0 28.4
44 6 25 9 13 3 100
13.0 2.3 7.2 2.8 4.1 1.0 30.4
43 7 24 9 14 3 100
14.0 2.7 7.3 2.9 4.2 1.0 32.1
44 8 23 9 13 3 100
14.9 3.0 7.2 3.3 6.2 1.0 35.6
42 8 20 9 18 3 100
15.1 3.3 7.3 3.4 7.6 1.0 37.7 a In million metric tons.
accounts for about one-fifth of the catch. The fact that no changes took place in the percentage figures for India during the entire 1950's makes its figures seem highly dubious. However, the relative importance of the various alternative channels (see Table I) in broad terms, reflect prevailing conditions.
During a major part of the 1950's, 13-14% of the world catch was used for reduction into forms which only indirectly reach the human consumer as food. Due to the increased production of Peruvian fish meal this figure has shown a dramatic jump upward, and in 1961 exceeded one-fifth of the total catch. Three percent is classified as miscellaneous, chiefly for industrial uses other than food.
In several countries the utilization pattern is determined more by the composition of the catch than by the technical development. Certain species are better adapted to be preserved by one method than another.
Salmon and tuna are ideal for canning. This is largely true also of the pilchards and sardines. Only 10% of the large South African catch used to be canned, the remainder going into the manufacturing of fish meal and fish oil. Presently most of the Walvis Bay catch (in southwest Africa) is canned, only offal being sent to reduction plants. Most of the Moroccan sardine catch catch goes to canning, a minor part to freezing for subsequent canning in France (Kreuzer, 1961).
It is interesting to note that on a global basis the relative amount of fresh fish has been reduced only slowly since 1938, although the catch now is 50% larger. This is explained by two trends. Tremendous im
provements which have taken place in the refrigeration and icing of fish have greatly enhanced the chances of first-class handling and thereby improved the quality of the marketable fish. Numerous cases from various parts of the world could be quoted to prove this particular point. Almost all countries have acquired icing establishments, refrigerated ware
houses, and refrigerated ships and holds. This will be further analyzed in Volume III, Chapter 25. Refrigerated fish carriers are being tried in warmer waters for the regular collection of catches from several fishing vessels. Such carriers operate in the Persian Gulf along a 150-mile stretch of coast in the vicinity of Abadan. On the other hand, the need for products with a longer shelf life and the important strides in the development of superior methods for freezing, curing, and canning have contributed to a vast expansion of the processing sector.
The amount of fish being processed has almost doubled, but the relative figure has grown only an insignificant 7%, from 50 to 57%.
Although this is somewhat surprising, it shows the delicate economic balance between processing costs and transportation. One vital factor which might explain this lingering preponderance of fresh market fish
is the fact that much of the expansion of fisheries has taken place chiefly in underdeveloped countries where fish is employed primarily to meet immediate urgent nutritional needs and consequently is consumed as soon as possible, allowing very little to go into excess production and planned storage for consumption in off-season periods. The lack of investment capital for processing is another factor limiting processing.
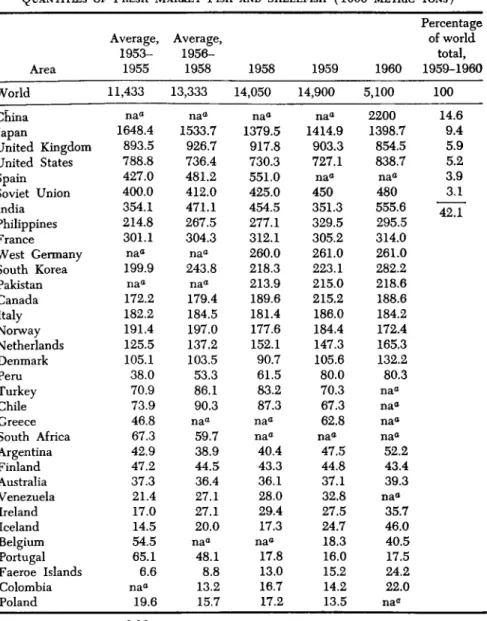
These observations are so far based on the total catch. It does, however, appear more satisfactory in analyzing these trends to make a clear separation between the amount of fish and shellfish being utilized as human food and those quantities being directed into reduction plants.
Table VI summarizes the result of such an analysis limited to the food fish. A somewhat modified picture then emerges of the relative decline in the amount of fish being utilized as fresh. Yet in the final result more than half of the world's fish catch is presently being eaten fresh, although the processing portion is rapidly reaching the 50% level.
As it has in most other food commodities, the most rapid growth is in the freezing sector; second comes canning. In spite of this advancement in alternative methods, curing still accounts for more fish than freezing and canning combined.
The most spectacular industrialization in the fish field has occurred in Peru. As late as 1939 this country had one fish-processing plant, installed in Pisco. Presently there are more than 120 plants, employing more than 10,000 and chiefly located in Callao, Lima, and Chimbote.
In 1960 the production consisted of 1.7 million cases of canned fish, 18,000 metric tons of frozen fish, 550,000 metric tons of fish meal, and 48,000 metric tons of fish oil. A major portion of this is exported (see
Section XX).
It is, nevertheless, a most noteworthy fact that fresh market fish be- tween 1953 and 1960 increased in volume no less than 4.3 million metric tons. This is, in effect, almost 40% above the total amount either frozen or canned in the entire world.
Most utilization figures in individual countries show an appreciable fluctuation from year to year. One characteristic feature of fishing is, after all, the effect that weather vagaries and biological conditions have on catch, resulting in poor and good years. In many countries the processing industry is not organized to handle unusually large quantities, and the excess is then generally moved into the reduction plants; for this reason the figures in such countries show considerable fluctuation.
These variations become less accentuated when the buffer lot, represented by what enters reduction plants, is subtracted and the analysis is made on the remainder of the fish, the bulk of which is largely moved into the field of human food. The amount of such food fish is, in effect, a far