CHAPTER 2, PART II
Shellfish Protein—Nutritive Aspects GEORG BORGSTROM
Department of Food Science, Michigan State University, East Lansing, Michigan
I. Introduction 115 II. Protein Content 116
A. General 116 B. Crustaceans 117 C. Mollusks 119 D. Meat Content 120 E. Seasonal Changes 121 F. Other Invertebrates 122 G. General Composition 122
III. Biological Value 123 IV. Amino Acid Composition 124
A. General 124 B. Crustaceans 127 C. Molluscan Shellfish 128 D. Cephalopods 129 E. Miscellaneous Invertebrates 129
F. Sulfurous Amino Acids 129
G. Lysine 130 H. Tryptophan 130 I. Tyrosine 130 J. Glutamic Acid 130 K. Free Amino Acids 131 L. Other Shellfish Products 133
V. Other Nutrients 134 VI. Digestibility 134 VII. Changes in Storage and Processing 134
A. Spoilage 134 B. Freezing 135 C. Canning 135 D. Cooking 136 E. Drying 136 F. Fermentation 137 G. Hydrolyzates 137 VIII. Shellfish Meals 138
References 139 I. Introduction
Since time immemorial shellfish has been an important source of human nutrition. The molluscan shellfish probably antedates all other foods in this respect. The tremendous waste-heaps of primitive tribes—
115
coastal American Indians, Swiss lake dwellers, Scandinavian and Siberian fur settlers—predominatingly contain shells of oysters, mussels, etc. The long empirical traditions, therefore, bear strong evidence of the special merits of this group of aquatic organisms.
Modern nutritional science has given much support to this evaluation.
Innumerable publications are available giving one or another contribu
tion to a broadened knowledge of the nutritive values of both crustacean and molluscan shellfish and also revealing the limitations and particular assets of special groups. Notwithstanding, shellfish have not received the attention they deserve on the part of most nutritionists. Very few broad and penetrating studies are available pertaining to any major group. Nevertheless, the present fragmentary information permits some conclusions of general validity and, in other cases, the reviewing may have the function of spotting inadequacies and inconsistencies.
One complication was encountered in preparing this review. Unfor
tunately, the word fish is not infrequently used to cover all aquatic organisms eaten as food, inclusive of shellfish. It was not possible to go through all the studies which convey pertinent information on shellfish.
There is, therefore, the obvious risk that some essential material and important information may be missing. This is particularly true insofar as abstracters or reviewers only occasionally index such information under the specific headings of shellfish, crustaceans, mollusks, shrimp, oysters or mussels, etc.
II. Protein Content
A. GENERAL
As a whole, the muscle tissue of shellfish usually ranges lower than that of most fish in total protein content; the crustaceans generally rate highest (27.1-22.0%), followed by the mollusks. In this latter case, mus
sels and squids (12.0%, 9.8%) rank higher than gastropods (9.9%).
Exceptions seem to be the large squid "jubia," eaten in Spain, and with a protein content of 15.7% (Ferreyra Risso, 1953), and the Japanese ear- shell (see Table I)—24.6%. These general rules were confirmed by Intengan et al. (1956), who found that crustaceans in general had a pro
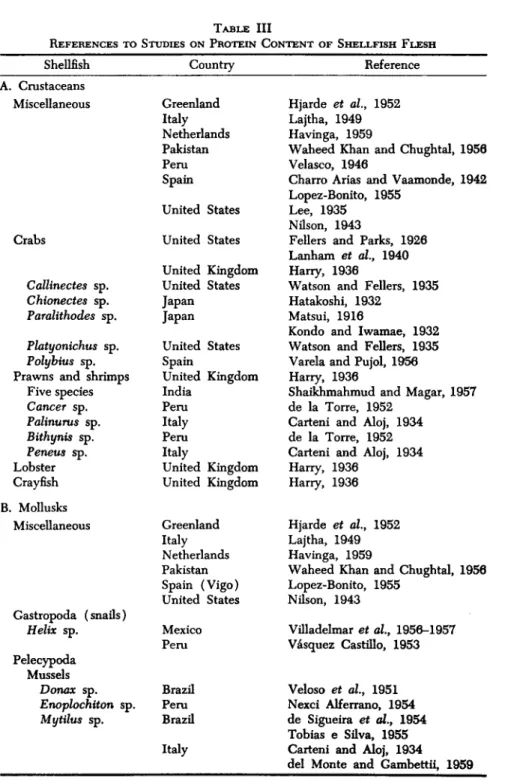
tein content equivalent to that of fish, while, on the average, molluscan shellfish give values half as large. Some selected figures further illustrate these generalizations (Table II). Table III constitutes a selection of papers giving data on the protein content of various shellfish—see also the comprehensive bibliography by Van der Rijst (1950).
On a dry basis, the often-quoted figures are 85-88% for crustaceans and 44-49% for mollusks such as oysters (Lee and Pepper, 1956). The
2. I I . SHELLFISH PROTEIN—NUTRITIVE ASPECTS 117
TABLE I
APPROXIMATE COMPOSITION OF THE M E A T OF SELECTED MARINE A N I M A L S0
Marine animal Ear-shell Octopus Oyster Clam
Sea cucumber January August
Crude protein (%) 24.6 17.1 13.1 11.3 6.5 7.7
Marine animal Whale (red meat) Dolphin
Herring Cod
Crude protein (%) 21.0 16.8 14.6 16.9
α Source: Tanikawa and Yoshitani, 1955.
TABLE II
PROTEIN PERCENTAGE IN SELECTED SHELLFISH
Species Latin name
Protein (total
N X 6 . 2 5 ) Source Crustaceans
Crab Lobster Prawn Shrimp Mollusks
Oyster Mussel
Scallop Whelk Winkle Cockle Squid Octopus
Cancer pagurus Chionectes phalangium Homarus vulgaris Leander serratus Crangon vulgaris Ostrea edulis Mytilus edulis Mytilus munahuensis Enoplochiton niger Pecten maximus Buccinum undatum Littorina littorea Cardium edule Loligo vulgaris Octopus vulgaris
22.4 19.4 19.7-20.7
22.8 22.0-23.2
8.6-12.6 8.9-11.7 11.3-19.4
24.7 17.5 17.5 18.0 13.2 14.9-19.3
17.9
Reay et al, 1946 Hatakoshi, 1932 Reay et al, 1946 Reay et al., 1946 Reay et al, 1946 Krvaric, 1953 Reay et al, 1946 Reay et al, 1946 Nexci Alferrano, 1954 Reay et al, 1946 Reay et al, 1946 Reay et al, 1946 Reay et al, 1946
de Gouveia and de Gouveia, 1951
Saavedra, 1949
Spanish crab (Polybius henslowi) has, however, a low value of 44.2%
(Varela and Pujol, 1956). A Mexican paste made of crustacean larvae and partially dried is a potent protein source—55.5%
B. CRUSTACEANS
Crustaceans range in protein content from 9.4 to 15.3%, according to Carteni and Aloj (1934). Most analytical data in numerous food compo
sition lists do, however, give higher values, listing crustaceans such as crabs, lobsters, shrimp, in the same range as mammal meat, or even higher—22-17%. This discrepancy could be due to the fact that tables
TABLE III
REFERENCES TO STUDIES ON PROTEIN CONTENT OF SHELLFISH FLESH
Shellfish Country Reference
A. Crustaceans Miscellaneous
Crabs
Callinectes sp.
Chionectes sp.
Paralithodes sp.
Phtyonichus sp.
Polybius sp.
Prawns and shrimps Five species Cancer sp.
Palinurus sp.
Bithynis sp.
Peneus sp.
Lobster Crayfish B. Mollusks
Miscellaneous
Gastropoda (snails) Helix sp.
Pelecypoda Mussels
Donax sp.
Enoplochiton sp.
Mytilus sp.
Greenland Italy Netherlands Pakistan Peru Spain
United States United States United Kingdom United States Japan
Japan
United States Spain
United Kingdom India
Peru Italy Peru Italy
United Kingdom United Kingdom Greenland Italy Netherlands Pakistan Spain (Vigo) United States Mexico Peru
Brazil Peru Brazil Italy
Hjarde et al, 1952 Lajtha, 1949 Havinga, 1959
Waheed Khan and Chughtal, 1956 Velasco, 1946
Charro Arias and Vaamonde, 1942 Lopez-Bonito, 1955
Lee, 1935 Nilson, 1943
Fellers and Parks, 1926 Lanham et al., 1940 Harry, 1936
Watson and Fellers, 1935 Hatakoshi, 1932
Matsui, 1916
Kondo and Iwamae, 1932 Watson and Fellers, 1935 Varela and Pujol, 1956 Harry, 1936
Shaikhmahmud and Magar, 1957 de la Torre, 1952
Carteni and Aloj, 1934 de la Torre, 1952 Carteni and Aloj, 1934 Harry, 1936
Harry, 1936 Hjarde et al, 1952 Lajtha, 1949 Havinga, 1959
Waheed Khan and Chughtal, 1956 Lopez-Bonito, 1955
Nilson, 1943
Villadelmar et al, 1956-1957 Vasquez Castillo, 1953
Veloso et al, 1951 Nexci Alferrano, 1954 de Sigueira et al., 1954 Tobias e Silva, 1955 Carteni and Aloj, 1934
del Monte and Gambettii, 1959
2. II. SHELLFISH PROTEIN—NUTRITIVE ASPECTS 119
TABLE III (continued)
Shellfish
B. Mollusks (continued)
Solen sp.
Venus sp.
Clams Meretrix sp.
Oysters Miscellaneous Ostrea sp.
Crassostrea sp.
Scallops Cephalopoda
Loligo sp.
Octopus sp.
Sepia sp.
Country Netherlands Italy Italy India India
New Zealand Japan Portugal Yugoslavia United States United States Italy
Peru Mexico Portugal Italy Peru Mexico Italy
Reference van de Velde, 1939
Gerritsen and van Pelt, 1943 Carteni and Aloj, 1934 Carteni and Aloj, 1934 Venkataraman and Chari, 1951 Venkataraman and Chari, 1951 Malcolm, 1927
Masumoto et al., 1932 Hatanaka, 1940
de Gouveia and de Gouveia, 1951 Krvaric, 1953
Lee and Pepper, 1956 Bell, 1937
Carteni and Aloj, 1934 Carteni and Morelli, 1936a Ferreyra Risso, 1953 Villadelmar et al, 1956-1957 de Gouveia and de Gouveia, 1951 Carteni and Aloj, 1934
Carteni and Morelli, 1936 Saavedra, 1949
Villadelmar et al, 1956-1957 Carteni and Aloj, 1934
on food composition frequently give the values referring to edible or eaten protein, while published individual papers have taken the entire soft part of the body into account. Busson et al. (1953) list crab, together with tuna, as the food with the highest protein content (for the former, 21%)·
Dried Bombay prawns of five different species show varying content of protein, 66.1-51.3% (Shaikhmahmud and Magar, 1957).
C. MOLLUSKS
Eight different mollusks were analyzed by Carteni and Aloj (1934) and showed a protein range of 8.4 to 14.0%. As mentioned above, the Japanese ear-shell is exceptionally high—24.7%. So is a Peruvian mussel
(Enoplochiton niger), with the same high value (Nexci Alferrano, 1954).
This recommends it highly as food, particularly as its nutritive value is also high.
A differentiation should be made between the body liquid of the
mussels and the body tissues as such. The liquid of oysters is quite rich in organics, albumins (2 g./liter), peptides, and mucin (Baylac, 1907).
Scallops contain less protein than beef, lamb, chicken, or fish, accord- ing to Bell's investigations (1937).
The octopus stands high in protent content—17.9% according to Peruvian analyses (Saavedra, 1949). On the other hand, Ferreyra Risso (1953) considered cephalopods largely as having lower protein figures than crustaceans.
Taxonomically, the cephalopods are subdivided into cuttlefish, carry- ing the cuttle bone, squids, and octopi. They are all used as food in various parts of the world. It is deplorable that these three major groups are not always kept apart in nutritional studies. Frequently they are used synonymously or are not correctly categorized.
The general composition of squid protein as to myosins and their characteristics was investigated by Matsumoto (1958). Their protein resembles that of fishes with certain distinctive features.
As a whole, shellfish are equal to fish in protein content, but a few contain even more protein than do fish. Several molluscan shellfish, par- ticularly gastropods, are appreciably lower in protein than fish. See Table I.
D. MEAT CONTENT
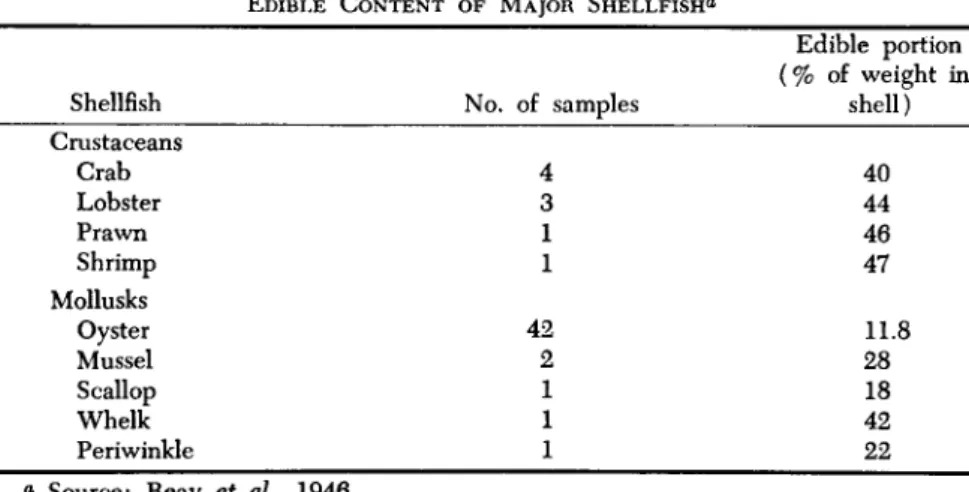
In several shellfish, more than the muscle tissues are eaten. What is termed meat is not always identical to the flesh in other animals. This has to be borne in mind when evaluating analytical data. The shells, nevertheless, constitute a major portion of the live weight (see Table IV), more so in mollusks than in crustaceans.
TABLE IV
EDIBLE CONTENT OF MAJOR SHELLFISH*1
Shellfish Crustaceans
Crab Lobster Prawn Shrimp Mollusks
Oyster Mussel Scallop Whelk Periwinkle
No. of samples 4 3 1 1 42 2 1 1 1
Edible portion (% of weight in
shell) 40 44 46 47 11.8 28 18 42 22 a Source: Reay et al.t 1946.
2. II. SHELLFISH PROTEIN NUTRITIVE ASPECTS 121
The meat content of Japanese oysters shows a sexual difference (Ma- sumoto et al., 1932). Females have 30c/c more meat and twice as much fat.
E. SEASONAL CHANGES
The composition of both crustacean and molluscan shellfish varies with season and particularly with the spawning time. Fat and protein generally build up to this major event, after which they drop.
In oysters the proportion of glycogen to protein is approximately re- ciprocal (Hatanaka, 1940). The energy content varies only slightly, attaining a maximum in late fall and early winter, with some differences between species (Masumoto et al, 1932, 1934; Tully, 1936; Krvaric, 1953).
The protein percentage increases in the spring and remains constant throughout the summer, but drops in the late fall (Krvaric, 1953).
Japanese oysters do not show the winter loss in weight and in protein (Sekine et al, 1929; Masumoto et al., 1932), probably because feeding is not arrested during the winter to the same extent as in Atlantic waters (Tully, 1936). The protein peak appears in the late summer in Pacific oysters, which appears to differentiate them from the Atlantic species.
The common blue mussel from the Vigo estuary shows a maximum amount of protein (13.4%) in the fall but a minimum (9.2%) in the spring in February (Fraga, 1958). With the scallop, the situation is almost the reverse: in the last half of April the protein figure reaches a peak and passes its maximum in the last half of November (Lopez-Bonito,
1955).
Important, too, is the relationship between fat content and protein.
In the scallop, this ratio has a maximum in February and a minimum in June.
In the oyster, there is a maximum in meat content, reached in De- cember, and a minimum in January. A second maximum comes in March, after which there is a rapid decline to a second minimum in July. The protein content closely follows this same pattern, while glycogen shows the opposite trend. Recovery takes place in early autumn, where there is more plankton in the sea, as shown in the figures in the tabulation (gram on the average per individual).
Total
weight Water Solids Lipids Protein Glycogen Loss between
June and July 5.6 4.7 0.912 0.178 0.473 0.037 Gain between
September and October 6.3 4.7 1.602 0.100 0.606 0.219
Protein accounts for more than half of the loss as well as one-third of the gain (Sekine et ah, 1930).
F. OTHER INVERTEBRATES
Sea cucumber flesh, as Table I indicates, has a protein content which is only one-third that of fish meat. Therefore, it is not looked upon as a protein source (Tanikawa, 1955), even though its aminogram compares well with that of fish meat. It may, however, have certain other merits revealed through recent research (see Section G).
The chemical composition of the meat of a sea cucumber (Stichopus japonicus) commonly eaten in Japan varies with the season. The water content (86-92% throughout the year) is greater than that of fish meat, which shows 75-85%. The amount of protein in the flesh grows, together with that of fat, from September to January and then drops in the period from February to May (Tanikawa, 1955).
Squid meat is composed of a more water-soluble protein than that of fish meat. Sea cucumbers show the opposite characteristic, having chiefly insoluble protein, viz., collagen, which dissolves in water only with diffi
culty. There is, however, some soluble protein in the network of the connective tissue (Tanikawa, 1955).
The edible part of the body of Stichopus japonicus—the body wall—
is histologically not muscular tissue, but consists mainly of connective tissue, built into a network of collagen fibers. The amount of collagen in the meat protein is about three times that in fish meat. In this structure the fibers are encased body-fluid-carrying soluble proteins, e.g., myosin and myogen. The hydrating affinity of the meat is inferior to that of fish meat. Only a minor portion of the water is bound water. Therefore, the body of Stichopus japonicus, when left in a basket, loses a major portion of its water (Tanikawa, 1955).
G. GENERAL COMPOSITION
A few studies are available on the general composition of shellfish protein. In myosin solubility, lobster protein comes closest to that of the rabbit (Dubuisson-Brouha, 1953). Whereas the water-soluble proteins and nonmyosins of several fishes were equal in amount, the water-soluble protein of squid (77-85%) constituted a far greater percentage than the amount of nonmyosin (12-20%) (Matsumoto, 1955, 1958). Although the muscle protein of squid resembles that of fish, the properties of its myosins are distinct.
Crustacean proteins frequently are bound to sugars forming gluco- proteins. Lobster protein contains 2.2% sugars, consisting of three parts glucose and eight parts of fructose, while crab protein has 2.8% sugars
2. II. SHELLFISH PROTEIN—NUTRITIVE ASPECTS 1 2 3
in a ratio of four parts glucose to one part fructose (Kondo and Sarata, 1940).
The meat of Stichopus japonicus contains a large quantity of muco- protein with chondroitin sulfuric acid as a component. In the studies of geriatrics the relation between the superannuating phenomena of muscle tissue and the decreasing of chondroitin sulfuric acid has been indicated.
The Chinese have been eating sea cucumber since ancient days; this biochemical relationship might explain its popularity (Tanikawa, 1955).
The swelling, or the degree of hydration, of a protein shows a mini- mum at the isoelectric point, and increases to either side, acid or alkaline.
This was demonstrated for fish by Tarr (1942), Noguchi et al. (1950), and Okada and Tada (1953, 1954). Takahashi (1955) showed the same effect with collagen. The swelling of fish meat has a minimum value at the isoelectric point (pH 4-5) and a maximum value at either the alka- line side (pH 10-12) or the acid one (pH 2-3). In the presence of salts, the swelling is enhanced on the alkaline side, but is reduced on the acid side (Tarr, 1942, and Okada). Meat of sea cucumbers shows no peak of protein swelling in acid solution as does that of fish (Tanikawa, 1955).
The flesh of sea cucumbers shrinks rapidly when immersed in water at temperatures between 45° and 55°C. and contracts about 50% at 70°
to 80°C. In this respect it resembles the collagen-rich fish skin (Taka- hashi, 1955), which shrinks in the temperature range of 37° to 55°C.
Fish meat shows a peak of swelling on both sides of the isoelectric point (pH 4-5). Sea cucumber differs in this respect, with no maximum in hydration in the acid region (Tanikawa, 1955). This may be explained by the aforementioned high content of collagen.
III. Biological Value
Jones (1926) found the ratio values of (gain in weight)/(gram of protein) for shrimp, clam, and oyster to be 2.2, 2.1, and 1.3, respectively. Lanham and Lemon (1938) established values (see tabu- lation) for the relative growth-promoting effect. Both oyster and shrimp exhibit good nutritive value.
100 Oyster
90 Shrimp Pilchard Red snapper
80 Cod Shad
63 Beef
Crab protein tested for the growth effect on experimental rats was superior to casein. Its biological value was on the same level as beef
(Watson and Fellers, 1935). Prawn protein had a good biological value (74) but lower than that of hake (Pujol and Varela, 1958).
The "patexo" (Polybius henslowi Leach) is a crustacean, abundant during certain months along the Galician coast of Spain. Dried, it is used as a meal. The biological value of its protein is low. Even negative values were obtained in rat experiments (Varela and Pujol, 1958).
The oyster is outstanding as one of the marine proteins best suited to man—conforming to his specific requirements in this respect. This ex- plains its use in therapeutic diets (Le Gall, 1948). Oyster protein was superior to that of seven fish studied, and surpassed shrimp. Beef was inferior when measured by the effect of extracted proteins on rat growth (protein efficiency ratio) (Lanham and Lemon, 1938). In the brackish lakes of the coastal regions of Brazil, the Brazilian mussel (Mtjtilus manuhuensis) is commonly eaten by the poor. Its protein is equal to casein in nutritive value (de Sigueira et al, 1954). Along the Peruvian coast is found another mussel (Enoplochiton niger)—"barquillo"—with a high protein content (24.7%) and of superior quality, as measured in experimental growth studies (Nexci Alfersano, 1954).
Flesh of a kind of cuttlefish ("variika") and crab ("tara bagani"), when tested against the proteins of horse, whale, and fish as to their effect on the normal growth curve of rats, compared favorably (Suzuki et al, 1912).
IV. Amino Acid Composition
A. GENERAL
Shellfish muscle tissue is generally characterized by its high content of nonprotein nitrogen (Campbell, 1934-1935). In the first and second decade of this century, a breakdown of the shellfish proteins through hydrolysis was done experimentally, together with similar analyses of other flesh tissues used as food (see Part I of this chapter). The close similarities between shellfish protein and that of other flesh products, whether vertebrate or invertebrate, were noted. Within these "two groups" deviations were few. Furthermore, shellfish protein, whether crustacean or molluscan, is composed of much the same constituents (Beach et al, 1943; Duchäteau et al, 1959) (see Table V).
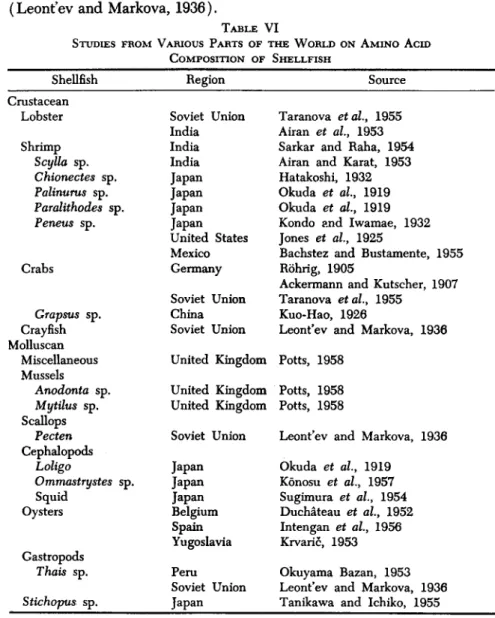
Leont'ev and Markova (1936) reported that the curves for racemization of proteins from major proteins of invertebrates were almost identical, thus constituting an indirect evidence of their similarity. This contrasts with the specific character of the pool of free amino acids. Differences in the proteins presumably exist in their molecular build-up. A list of studies from various parts of the world on the amino acid composition of shellfish is given in Table VI.
to TABLE V PER CENT CONTRIBUTION OF AMINO ACIDS TO TOTAL NITROGEN OF SELECTED PROTEINS FROM MUSCLE TissuEa o Source: Beach et al, 1943. b The Sullivan method.
X M r r
Food Pork
Argi- nine 13.3 Chicken 13.9 (white flesh) Codfish 12.6 Shrimp 13.2
Histi- dine 3.7 4.0 3.5 3.1
Lysine 10.4 10.1 10.1 10.0
Phenylal- anine 2.1 2.0 2.3 2.5
Tyro- sine 2.1 2.1 2.2 2.3
Trypto- phan 1.1 1.1 1.1 1.1
Serine 3.8 3.9 4.1 3.3
Thre- onine 3.4 3.4 3.3 2.9
Cystine'* 0.7 0.6 0.8 0.7
Methio- nine 1.9 2.0 2.2 2.0
C/D X
g 1 i
<9 8
Scallops, fresh-water crayfish, and sea cucumbers all have an amino acid composition making their protein fully comparable to casein
(Leont'ev and Markova, 1936).
TABLE VI
STUDIES FROM VARIOUS PARTS OF THE WORLD ON AMINO ACID COMPOSITION OF SHELLFISH
Shellfish Crustacean
Lobster Shrimp
Scylla sp.
Chionectes sp.
Palinurus sp.
Paralithodes sp.
Peneus sp.
Crabs
Grapsus sp.
Crayfish Molluscan
Miscellaneous Mussels
Anodonta sp.
Mytilus sp.
Scallops Pecten Cephalopods
Loligo
Ommastrystes sp.
Squid Oysters Gastropods
Thais sp.
Stichopus sp.
Region Soviet Union India India India Japan Japan Japan Japan United States Mexico Germany Soviet Union China Soviet Union United Kingdom United Kingdom United Kingdom Soviet Union Japan Japan Japan Belgium Spain Yugoslavia Peru
Soviet Union Japan
Source Taranova etal, 1955 Airan et al, 1953 Sarkar and Raha, 1954 Airan and Karat, 1953 Hatakoshi, 1932 Okuda et al, 1919 Okuda et al, 1919 Kondo and Iwamae, 1932 Jones et al, 1925
Bachstez and Bustamente, 1955 Röhrig, 1905
Ackermann and Kutscher, 1907 Taranova etal, 1955 Kuo-Hao, 1926
Leont'ev and Markova, 1936 Potts, 1958
Potts, 1958 Potts, 1958
Leont'ev and Markova, 1936 Okuda et al, 1919
Könosu et al, 1957 Sugimura et al, 1954 Duchäteau et al, 1952 Intengan et al, 1956 Krvaric, 1953
Okuyama Bazan, 1953 Leont'ev and Markova, 1936 Tanikawa and Ichiko, 1955
Crustacean protein is purported to show less tyrosine, arginine, and methionine than mammal protein does (Malikova, 1957).
Molluscan proteins showed lower values for valine, methionine, phen- ylalanine, lysine, and histidine than the muscle proteins of fish and crus
taceans (Könosu and Mori, 1959). These observations were based on hard clams and abalone.
2. II. SHELLFISH PROTEIN NUTRITIVE ASPECTS 127
Both methionine and threonine were found to be lower (30-40%
less) in both crustacean and molluscan shellfish as compared to most fish, both salt-water and fresh-water species (Hatakoshi, 1953).
B. CRUSTACEANS
Crustacean protein compares well in major amino acids with casein, beef, and egg albumen (Pottinger and Baldwin, 1940; Master and Magar, 1954).
The pattern of amino acid distribution in crustacean protein is rela- tively uniform (Kuo-Hao, 1926). Some slight diflFerences, however, were observed (Könosu et al., 1958) (see also Tables V and VII). The amount
Amino acid Glycine Alanine Valine Leucine Isoleucine Serine Threonine Methionine Cystine Aspartic acid Glutamic acid Tyrosine Phenylalanine Proline Tryptophan Arginine Lysine Histidine
AMINO ACID
Prawn 4 7 6.0 4.4 8.6 3.8 4.2 4.1 2.8 1.10 11.7 17.5 4.1 4.4 3.7 1.0 9.0 9.4 1.9
TABLE VII COMPOSITION OF
Lobster 4.6 5.9 4.5 8.6 4.1 4.9 4.4 3.2 1.3 12.3 16.9 4.1 4.7 3.4 0.9 7.4 9.5 2.1
SHELLFISH«
Blue crab 4 7 5.7 5.0 9.0 4.7 4.9 5.2 3.0 1.7 12.0 16.2 4.7 4.8 4.5 1.6 6.3 8.9 2.4
Fish 3.0-5.5 5U-7.3 5.6-9.3 7.4-9.4 5.0-7.9 4.6-5.5 5.2-6.0 3.1-3.7
—
6.2-11.5 13.4-16.9 3.5-4.6 3.4-5.2 2.9-4.2 1.1-1.4 5.9-6.9 9.9-11.8 2.2-3.9
α Source: Könosu et al., 1958.
of arginine is the most variable, ranging between 6.3% (blue crab) and 9.0% (prawn). The content of glycine, alanine, leucine, tyrosine, and phenylalanine of crustacean muscle proteins was at almost the same level as those of the ordinary muscle protein of fish. But the crustacean muscle shows a higher value of the acidic amino acids, glutamic and aspartic acids, and a lower value of valine, isoleucine, threonine, and lysine when compared with fish muscle (Table VIII). Master and Magar (1954) found no difference in lysine, nor did Taranova et al. (1955). Kuo-Hao (1926) obtained high lysine values in crabs, as did Kondo and Iwama (1932).
The histidine-arginine fraction is generally very high in crustacean shellfish (Kondo and Iwamae, 1932; Campbell, 1934-1935). Soviet studies found arginine and cystine higher in lobster and crab, exceeding the values for most fish and terrestrial meats.
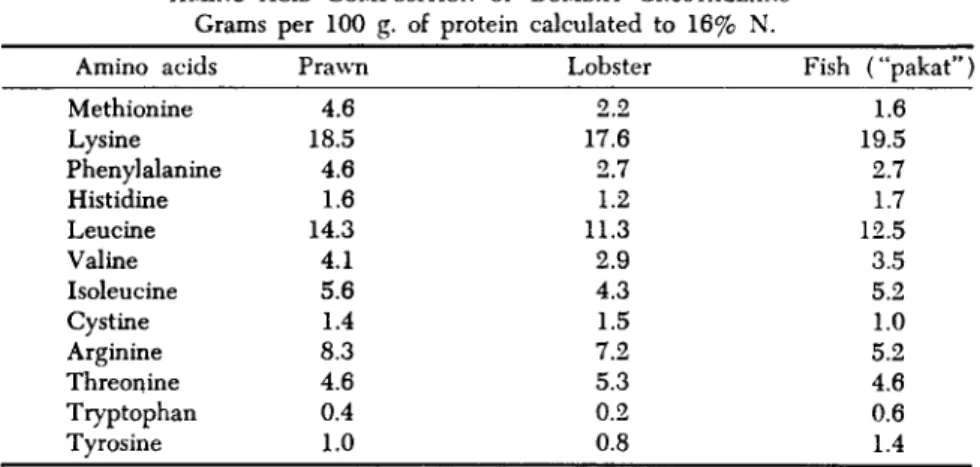
TABLE VIII
AMINO ACID COMPOSITION OF BOMBAY CRUSTACEANS0
Grams per 100 g. of protein calculated to 16% N.
Amino acids Methionine Lysine Phenylalanine Histidine Leucine Valine Isoleucine Cystine Arginine Threonine Tryptophan Tyrosine
Prawn 4.6 18.5 4.6 1.6 14.3 4.1 5.6 1.4 8.3 4.6 0.4 1.0
Lobster 2.2 17.6 2.7 1.2 11.3 2.9 4.3 1.5 7.2 5.3 0.2 0.8
Fish ("pakat") 1.6 19.5 2.7 1.7 12.5 3.5 5.2 1.0 5.2 4.6 0.6 1.4
α Source: Master and Magar, 1954.
The Indian prawn "pak" has a good aminogram and is readily di
gested (Valanju and Sohonie, 1957); in fact, it exceeds casein in this respect.
The crustacean flesh (shrimp, lobster, crab, and crayfish), as well as that of mollusks, is practically devoid of creatine. Related compounds are found in place of creatine, e.g., in crustaceans the amino acid arginine which combines with phosphorus.
C. MOLLUSCAN SHELLFISH
The first amino acid analysis reported was on a scallop. Chittenden (1875) found in the major adductor muscle of Pecten irradians a rela
tively large amount of free glycocoll. But Osborne and Jones (1909) found still more when analyzing the protein. The general amino acid composition of scallop protein closely resembled that of halibut and chicken. There was somewhat less of leucine and slightly more of phen
ylalanine and arginine.
Könosu and Mori (1959) compared the amino acid distribution of the proteins in the minced edible part of a hard clam (Meretrix meretrix lusoria Gmelin) with that of an abalone (Haliotis gigantea Gmelin), and found that they were rather uniform, but some slight differences were observed. The protein of abalone is richer in glycine, proline, and argi-
2. II. SHELLFISH PROTEIN NUTRITIVE ASPECTS 129 nine, but poorer in leucine, glutamic acid, tyrosine, and lysine. It was also found that the tryptophan content of the hard clam protein is higher.
These molluscan proteins show a lower value of valine, methionine, phen- ylalanine, lysine, and histidine than the muscle proteins of fish and crus- taceans examined in previous studies (Könosu and Mori, 1959).
D. CEPHALOPODS
Könosu et al. (1956, 1957) established that the content of essential amino acids in cuttlefish protein coincides greatly with that of teleost fish.
Squid contained larger amounts of arginine, aspartic acid, glutamic acid, and leucine and exceeded most vertebrates in this respect (Sugi-
TABLE IX
COMPARATIVE NITROGEN DISTRIBUTION IN VARIOUS FISH AND SHELLFISH M E A T0
(calculated as % of total N) Nitrogen
Total (dry Amide Humin Arginine Histidine Lysine Cystine
a Source:
matter)
fanikawa, 1955.
Squid 12.6
4.1 3.3 20.0 8.7 10.1 0.9
Octopus 15.6
4.3 1.5 17.1 4.9 9.4 0.6
Sea cucumber 9.5 3.4 11.5 11.2 9.4 0.8 0.9
Sardine 13.3
6.4 1.2 11.9 0.4 15.0 0.2
mura et al., 1954) but was lower in histidine, lysine, and methionine. No diflFerences were observed in other amino acids. It can be seen in Table IX that the content of lysine in squid not always is superior to that in fish.
E. MISCELLANEOUS INVERTEBRATES
The sea cucumber is characterized by high histidine values, but is very low in lysine and cystine (Table IX).
A compound toxic to protozoans, certain amphibia, fish, and mice was discovered in a sea cucumber common in the Caribbean, Aetinopya agas- sizi. It was named holothurin (Nigrelli and Zahl, 1952).
F. SULFUROUS AMINO ACIDS
Okuda and Matsui (1916) reported that the sulfur content of crus- tacean flesh is higher than that in fish (1.2-2.8% sulfur in dried fish).
Female crabs contain more sulfur. The sulfur in shrimp protein was studied in 1932 by Baernstein, its amount being only slightly higher than in halibut flesh.
Methionine, cystine, and cysteine were analyzed in four crustaceans from off the Peruvian coast. Both methionine (0.6-0.36%) and cystine
(0.52-0.26%) were high, while cysteine was low (0.12-0.06%) (de la Torre, 1952). Later, molluscan shellfish were investigated as to these same constituents, showing in broad lines a similar pattern. Squids, oc- topi, and mussels were studied also (Flores Castafion, 1953).
Cysteine and cystine are absent in shrimp, according to Ranke (1959).
Both crustacean and mollusks are rich in methionine. Squids and dried crustacean paste are high in methionine—approximately 3.2% of the protein, according to Villadelmar (1956-1957) (see tabulation).
Oyster (Japanese) Meretrix sp.
Madura sulcatria Squid
Methionine content (% of protein)
0.25 2.18 3.46 3.2
Source Ogata, 1951-1952 Ogata, 1951-1952 Ogata, 1951-1952 Villadelmar, 1956-1957 G. LYSINE
Lysine was reported higher in shrimp than in scallop muscles (7.7%
as against 5.8%) (Jones et al., 1925). In general, crustacean protein is high in this important acid (Master and Magar, 1954).
Most shellfish used in Mexican diets are rich in lysine; 9.2-10.2%, according to Villadelmar (1956-1957). Sea cucumbers are poor sources of lysine (Tanikawa, 1955).
H. TRYPTOPHAN
Blue crab contains 1.6% of tryptophan. This value is the highest encountered in any fish or crustacean (Könosu et al., 1956).
The content of tryptophan is higher in squids and snails than in blue crab (Villadelmar et al., 1956-1957). This was shown to be true for the large squid Loligo gahi (Ferreyra Risso, 1953).
I. TYROSINE
The large squid Loligo gahi, commonly eaten in Spain, is higher in tyrosine than most fish, namely, 0.39% of the flesh or about 2% on a dry basis (Ferreyra Risso, 1953).
J. GLUTAMIC ACID
Shellfish generally is as rich in glutamic acid as wheat flour, and consequently is a good source (Reyes, 1950). It exceeds most fish, al- though shellfish generally contain more of this amino acid than beef does.
2. II. SHELLFISH PROTEIN—NUTRITIVE ASPECTS 131
K. FREE AMINO ACIDS
The first study on free amino acids was conducted on crabs (Acker- mann and Kutscher, 1907; Suzuki, et al., 1912). In 1909, Suzuki and Yoshimura reported on free amino acids in lobster and squid. Okuda (1912) and Okuda et al. (1919) concluded that shellfish muscle is char- acterized by the lack of creatine, whereas vertebrates, including fish, commonly carry this compound. This was confirmed in later investiga- tions (Campbell, 1934-1935; Fräser et al, 1952).
Arginine shows the reverse pattern, being abundant in extracts of shellfish, both crustacean and molluscan, but lacking in vertebrate muscle tissue. It is, however, present in large quantities in the muscle protein of both vertebrates and invertebrates. Arginine unquestionably is the mother substance of creatine. This leads to the conclusion that vertebrate tissues have the power to transform arginine into creatine, while the invertebrates lack this capability.
When comparing the free amino acid pool of a gastropod, Chinese crab, and lobster, certain specific characteristics were noticed for each of these, in spite of the fact that they all carried the same fifteen amino acids (Camien et al., 1951; Florkin, 1954; Duchäteau et al., 1954). The muscle protein does not change its composition parallel with variations in the free pool. Lobster flesh has a protein with a higher content of argi- nine, glycocoll, and proline, while the muscle protein of the snail is dominated by alanine and arginine.
Free amino acids and other similar compounds play an important part in the osmotic regulation of marine invertebrates. This has been confirmed for the whole muscle of Nephrops (Robertson, 1957) and for Carcinus, where they account for over 60% of the total osmotic activity (Shaw, 1958). Fräser et al. (1952) reported that the principal free amino acids in the flesh of lobster and crabs were proline, glycine, and the re- lated taurine, with less glutamic acid and asparagine. An unidentified amino acid was found by Airan et al. (1953) in studies on East Indian lobsters.
Nonprotein nitrogen as a whole constitutes about 10% of the total N in teleosts, 20% in crustaceans and mollusks, and 30% in the elasmo- branchs. Levels of free amino acids N was 300 mg./100 g. of wet muscle in crustaceans and mollusks, while in fish it was 20-40 mg./100 g. wet muscle (Velankar and Goindau, 1958b) (see Chapter 11 by Simidu in Volume I ) .
The fifteen nonprotein amino acids present in the flesh of crustaceans occur in higher concentrations in marine forms than in fresh-water species. Among the latter, the Chinese crab Eriocheir sinensis is a
poekilo-osmotic form which exhibits concentration changes depending on the external environmental waters (Edwards et al., 1955; Florkin, 1958-1959). In sea water the concentration is higher, in particular in proline and all other amino acids, with the exception or arginine. These animals return to their original concentration in fresh water as soon as they are returned to such an environment. The species belonging to a brackish form acquires a concentration in between that of fresh and marine waters. There have been indications that the pool of free amino acids plays a role in osmotic regulation of the tissue. The ordinary fresh- water crayfish, however, which is not adapted to living in brackish water, does not show the same changes in water with a salt concentration half that of marine water; only the protein content is increased. The free amino acids remain unchanged (Duchäteau and Florkin, 1954, 1955a, b, 1956). This entire field of environmental effects on the composition of the pool of free amino acids has recently been reviewed by Waterman
(1960).
Seventeen free amino acids were found in the muscles of three kinds of mollusks, the clam (Meretrix meretrix lusoria), the little-neck clam (Tapes japonica), and the soft-shelled clam (Mya japonica), and their variations during spoilage were determined by the microbiological method. For the purpose of comparison, the same determination was made on the muscle of the mullet (Liza haematocheih). The amino acid nitrogen accounted for about 52 to 63% of the extractive nitrogen in the molluscans, but only 29% of the mullet. The main components of the free amino acids were alanine, glycine, arginine, and glutamic acid in the muscle of three shellfish, while in the fish they were glycine, histidine, and alanine (Ito, 1959).
Iced shrimps (and prawns) lose amino acids through leaching for 6 to 7 days. This in turn explains the reduced flavor (Velankar and Govin- dan, 1958a). Naturally, these losses may contribute to a somewhat lower supplementary value of these products.
True arginine was discovered in lobster muscle by Hoppe-Seyler (1933) in the D-form, not as the DL-form, which was earlier obtained from fresh-water crabs by Broude (1933). Kermack et al. (1955) encountered large amounts of free proline and glycine in fresh lobster muscle, smaller quantities of glutamine and alanine, and traces of aspartic acid, glutamic acid, histidine, lysine, threonine, and tyrosine. Camien et al. (1951) found somewhat more arginine, and less valine and leucine. In addition, Kermack et al. (1955) found taurine present to the extent of about 300 mg./100 g. wet muscle. The relatively small amount of histidine present is in striking contrast to the amount of this amino acid found in certain fish, particularly those with red meat.
2. I I . SHELLFISH PROTEIN NUTRITIVE ASPECTS 1 3 3
Free glycine was detected early by Chittenden (1875) in scallops (Pecten irradians) and later by Kelly (1904) in P. operculans. It gen- erally coexists with betaine. Large quantities have been demonstrated in starfish.
Proline is the mother substance of stachydine and has been found in lobster, squid, and shrimp.
Taurine is a common constituent of many kinds of muscles, and is not limited to molluscans, as some authors maintain, although the quan- tity predominates there. Shellfish are consequently richer than most fish in this particular compound (Okuda and Sanada, 1919) (see tabulation).
Taurine Taurine in % of in % of
Shellfish fresh flesh dry flesh Crustacea
Neptunus pelagicus 0.3 1.4 Palinurus vulgaris 0.2 0.8 Mollusks
Pinna japonica (adductor muscle) 0.5 2.4 Avicula martensii (mantle) 0.9 5.2 Source: Okuda and Sanada, 1919.
Kelly (1904) estimated that taurine made up 5% of the dry matter of Mytilus muscle, corresponding to 100 millimoles/kg. water in the whole muscle. Arginine and taurine were identified in the marine gas- tropod Patella (Ackermann and Janka, 1954).
The concentration of amino acids in the salt-water Mytilus blood is only 2.5 millimoles/kg. water, but is lower, 0.5 millimole/kg. water in the fresh-water mussel Anodonta. Much higher values are encountered in the muscle tissue: in the Mytilus muscle 166.2 millimoles/kg. total water and in Anodonta 9.5 millimoles/kg. total water, but yet far less in the fresh-water forms (Duchäteau et ah, 1952).
L. OTHER SHELLFISH PRODUCTS
In comparing the protein of muscle tissue with the chitin of crusta- ceans, basic differences have been noted. Both tyrosine and cystine are lower in chitin, when compared to muscle tissue (Airan and Thomas, 1953). In some crustaceans no arginine or cystine was found in the chitin (Airan and Karat, 1953; Airan and Thomas, 1954).
Octopine, containing chiefly arginine, has been isolated from squids, octopi and scallop muscles. Its nutritive value has not been investigated.
Further information on this and related compounds is available in Chap- ter 11, Volume I.
V. Other Nutrients
Most shellfish are rich in calcium (Malikova, 1957). Also nutritionally significant is the fact that thiaminase occurs in some shellfish, both mol- luscan and crustacean. Shrimps (Peneus sp.) and some mussels are rich in this enzyme, while it is almost absent in most crabs (Jacobsohn and Azevado, 1947). The presence of this enzyme induces abnormally low thiamine values in the muscle tissues of such shellfish after death (Lu- bitz et al, 1943).
These factors may be important in the right interpretation of the biological and nutritive value of shellfish proteins.
VI. Digestibility
The digestibility coefficient of shrimp was found to be 67. The bio
logical value of this protein was 69, and the net utilization coefficient 56.
Thus, 1 kg. of shrimp meat yielded only 126 g. of fully utilizable protein.
The corresponding figures for smoked cod flesh was 148 g. (Varela, 1955).
The digestibility of sea cucumber tissue is inferior to that of fish meat (Tanikawa, 1955).
In a comparative study covering fish and several shellfish, lobster consistently turned out to be the leading crustacean as to net utilization ratio (see Part I of this chapter) and digestibility. Octopus and ordinary mussel (Mactra helvacea) led in the molluscan group. Oyster was not tested. Squid is inferior to octopus (Pujol and Varela, 1958).
VII. Changes in Storage and Processing A. SPOILAGE
The middle section of the intestines carries glands which excrete quite potent cathepsins. Independently of bacterial attacks, a proteolytic, rather rapid breakdown takes place in ,the vicinity of the viscera in the meat of crabs (Degkwitz et ah, 1954).
During spoilage, there is a continuous increase in the concentration of leucine, isoleucine, valine, glutamic acid, aspartic acid, a- and γ-amino- butyric acid (Ranke and Bromstedt, 1954; Ranke et al, 1956), the two latter presumably being of a bacterial origin.
There are considerable changes among the free amino acids during spoilage. The total amount goes up as the mollusks spoil, the amount of free arginine falls rapidly, and glutamic acid decreases to some degree.
Other amino acids increase slightly, but the change is not considerable (Ito, 1959).
2. II. SHELLFISH PROTEIN—NUTRITIVE ASPECTS 1 3 5
Poisoning through mollusks constitutes a hazard. This is generally caused by toxic compounds emanating from dinoflagellates and is further discussed in Chapter 11 by Shewan. In other cases, mollusks may convey Colt and SalmonelL· infections. Large cleansing tanks with chlorinated water constitute an important countermeasure. In recent years there have been reports from Sweden, Mississippi, and New Jersey of oysters and clams having caused epidemics of hepatitis (Anonymous, 1961).
These problems are further elaborated in Chapter 7 of this volume. A Japanese gastropod (Nephenea arthritica) carries a poisonous salivary gland which has to be removed prior to consumption (Asano, 1951-1952).
Factors of this kind contribute to restrictions in the full use of shellfish as food.
Blackening of shrimp is due to enzyme activity, phenoloxidases form
ing melanins (Bailey, 1958). It has largely been overlooked that crus
taceans can be subdivided biochemically into two major groups as to their hypodermic amino acids and their capability of forming melanin pigments (Drilhon and Busnel, 1950). The relative importance of indi
vidual free amino acids differs somewhat. In both groups, whether they can form melanin or not, glycocoll, alanine, and valine are the leading amino acids, but the composition becomes different when the acids are listed in order of importance:
Without melanins Tyrosine Glutamic acid Aspartic acid Leucine Histidine Proline
With melanins Aspartic acid Proline
For further discussion see Chapter 8, Volume I.
B. FREEZING
Freezing had no effect on the nutritive value of crab proteins, accord
ing to Watson and Fellers (1935). The blue and the sand crab were stud
ied.
C. CANNING
In canning crab, the nutritive value of its protein was only very slightly reduced (Watson and Fellers, 1935). Both biological value and digestibility were largely maintained on a high level in the canning of blue crab, king crab and Dungeness crab (Lanham et al., 1940). In a broad comparative study it was established that the heat processing
employed in canning did not change the amino acid composition of shrimp (Dunn et al., 1949; Nielands et al., 1949).
Not infrequently, crab meat, when processed through canning, turns brown. This seems to occur at a high temperature when processed on land, but at a low temperature when prepared on floating canneries.
Only when not completely fresh raw material is used does browning occur at high temperatures.
The low-temperature treatment may give browning discolorations even in meat from newly captured specimens. In both cases the browning is due to the traditional Maillard reaction, the presence of both amino acids and reducing sugar constituting prerequisites for such a reaction.
Their amounts are generally larger in meat that browns than in normal packs. Browning is more often observed in canned products prepared from hard-shell crab than from peeled crab. Crabs kept in ice water showed less susceptibility than those held in crushed ice, presumably due to leaching.
The presence of Cu++ in crab blood (body fluid) or Fe+ + + in crab meat accelerates the browning reaction. The greater the remaining amount of blood in the meat, the greater is the degree of browning (Nagasawa, 1960).
D. COOKING
Using the proteolytic breakdown through pancreatin as a test method, it was established by Nomura (1953) that shellfish protein was more readily digested in the raw stage than in the cooked forms. This is in accordance with findings on fish, but in contrast to poultry meat and beef.
Okuda and Matsui (1916) reported that, in cooking, some volatile sulfur compounds are formed in Kamchatka crabs. As female crab con- tains more sulfur, its flesh is considered inferior for canning. Free amino acids are lost in the cooking of shrimp (Ranke, 1959).
E. DRYING
Dried flesh of a crab (Polybius henslowi) common to the northwest coast of Spain contained 44.2% of protein. Rat growth experiments showed that the digestibility coefficient of its protein was 78.7 but that the nutritive value was low.
The semidrying of prawns is a novel, more lenient method of preser- vation. Such semidried prawns retained all the essential amino acids (Chari and Venkataraman, 1957).
Dried mollusks, both fresh-water and salt-water species, are used as poultry feed. This product contains 59-76% protein with a good amino
2. II. SHELLFISH PROTEIN—NUTRITIVE ASPECTS 137 acid composition, but cystine is reported lacking (Zikeev, 1948). This particular amino acid is, however, readily synthesized by the hen.
Dried squid is a popular food in many countries. It is used as a base for soup stock. Normally this product maintains its protein quality well and also its stock of free amino acids. Yoshimatsu et al. (1958) reported the abundant presence of glycine, alanine, proline, and glutamic acid.
Betaine is also a dominant ingredient.
The fresh meat of Stichopus japonicus is difficult to dry. The hydra- ting affinity of the sea cucumber meat is comparatively weak, but the meat nevertheless is very difficult to dry (Tanikawa and Yoshitani, 1955).
This difficulty varies, depending on the drying temperature.
F. FERMENTATION
Soy sauce is not infrequently made from shellfish, particularly cepha- lopods, through autodigestion. In comparing such sauces made from octopus and squid, only minor differences were observed in the amino
TABLE X
NITROGEN DISTRIBUTION IN FLESH OF CEPHALOPODS0
Acid-soluble N Amino
Humin Arginine Histidine Lysine Cystine Total diamino Total monoamino Non-amino
Octopus % 14.6
2.5 9.4 9.9 10.6 1.0 30.8 52.4 4.9
Squid % 13.3
3.9 10.9 8.9 10.6 0.4 30.8 52.7 1.3
a Source: Fukai, 1947.
acid composition of the final products (Table X). This seems to be true of both total diamino and monoamino acids, as well as the individual major amino acids, such as arginine, lysine, and histidine (Fukai, 1947).
G. HYDROLYZATES
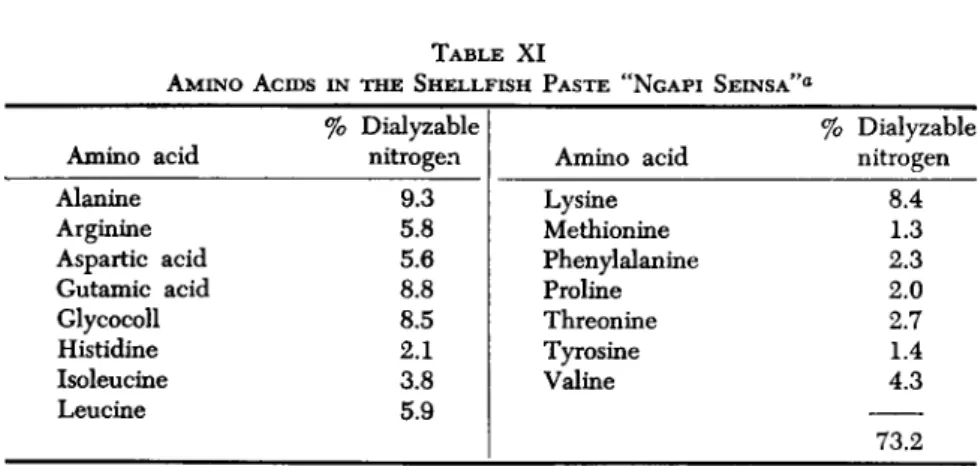
Not only fish are fermented into pastes in Southeast Asia. Several shellfish are prepared the same way through a partial enzymic hydrol- ysis—about half of the protein is split into amino acids. Several such shellfish pastes are known from the Philippines, Cambodia, Laos, Indo- nesia, and Burma. The amino acid composition of the Burmese "ngapi seinsa" makes it nutritious human food (Blass and Richard, 1952; Duchä- teau et al, 1953)—see Table XI.
TABLE XI
AMINO ACIDS IN THE SHELLFISH PASTE "NGAPI SEINSA"0
Amino acid Alanine Arginine Aspartic acid Gutamic acid Glycocoll Histidine Isoleucine Leucine
% Dialyzable nitrogen
9.3 5.8 5.6 8.8 8.5 2.1 3.8 5.9
Amino acid Lysine Methionine Phenylalanine Proline Threonine Tyrosine Valine
% Dialyzable nitrogen
8.4 1.3 2.3 2.0 2.7 1.4 4.3 73.2
a Source: Duchäteau et al., 1953.
VIII. Shellfish Meals
Crab and shrimp meal are increasingly used as animal feed, for as the corresponding industries grow, the amount of waste mounts. An efficient utilization of oflFal, shells, etc., is gradually becoming urgently needed from both the sanitary and economic points of view.
The biological value of crab meal (protein content 35%) is high (85.9). What is retained in the body is well utilized, but the digestibility (70.7) as well as the net utilization (60.2) is lower than corresponding figures for other marine organisms (Sure and Easterling, 1952). Crab meal is also a most satisfactory ingredient of chick or broiler rations (Parkhurst et al., 1942). Du Toit and Smuts (1941) placed crayfish meal (91) between that of whitefish (94) and herring (73), but Bronkhorst (1938) found crayfish meal better than fish meal. Good results with cray
fish meal were also reported by van der Vyver (1951). Crayfish waste from processing plants in the west part of the Cape province constitutes a fine supplement in the feeding of hogs (Johnston and Bartel, 1932).
Both crab and shrimp meal are good when added to soybean meal (Anonymous, 1953) or equivalent to meal scrap in growth effect on hogs (Anonymous, 1952). In the analysis of shellfish meals, erroneously high values for protein are reported, unless a correction is made for the apparent protein contributed by chitin, an N-acetylated glucosamine polysaccharide (Brown, 1959).
The ordinary blue mussel (Mytilus edulis) has emerged as a particu
larly valuable feeding-stuff in the Soviet Union. Preserved with sodium bisulfite or dried, it stays well preserved. It promotes egg production and hog growth efficiently (Kudryavtsev, 1951). Harvesting of mussels for exclusive use in the raising of pigs is even contemplated (Zambriborsö, 1956).