PYROLYSIS OF UNTREATED AND VARIOUS TORREFIED STEM WOOD, STUMP, AND BARK OF NORWAY SPRUCE
Eszter Barta-Rajnaia, Zoltán Sebestyéna, Emma Jakaba, Eszter Patusa, János Bozia, Liang Wangb, Øyvind Skreibergb, Morten Grønlic, Roger Khalilb, Zsuzsanna Czégénya
aInstitute of Materials and Environmental Chemistry, Research Centre for Natural Sciences, Hungarian Academy of Sciences, Magyar tudósok körútja 2, Budapest, H-1117, Hungary
bSINTEF Energy Research, Sem Sælands vei 11, Trondheim, NO-7034, Norway
cDepartment of Energy and Process Engineering, Norwegian University of Science and Technology (NTNU), Kolbjørn Hejes v 1B, Trondheim, NO-7491, Norway
ABSTRACT
The effect of torrefaction severity (temperature and residence time) was studied on the thermal decomposition of different parts of Norway spruce (stem wood, stump, and bark). The volatile content of the torrefied samples was characterized by pyrolysis-gas chromatography/mass spectrometry (Py-GC/MS). The tendencies of the intensities of the most characteristic pyrolysis products of the untreated and torrefied samples have been compared. The Py-GC/MS results are interpreted in terms of the chemical composition changes (cellulose, hemicellulose). It was found that the alkali ions do not catalyze the thermal decomposition of hemicellulose contrary to cellulose. The results of the Py-GC/MS analysis demonstrated that the yields of acetic acid and other compounds of low molecular mass were reduced in the pyrolyzates of each torrefied sample including the treatment at 225 °C. Principal component analysis has been used to reveal
correlations between torrefaction temperature, residence time, and product distribution of the samples. The torrefied stem wood and stump behaved similarly during torrefaction; therefore, they can be utilized together in thermochemical conversion applications. However, the torrefaction of bark requires about 25 °C lower torrefaction temperature than stem wood and stump.
1. INTRODUCTION
The World’s current energy systems are dominated by fossil fuels (coal, oil, and gas), which produce greenhouse gases, the fundamental drivers of global climate change.1-2 One way to reduce emissions would be replacing fossil fuels with renewable energy sources, such as biomass materials. Although biomass evolves the greenhouse gas CO2 during burning as well, it takes carbon out of the atmosphere while it is growing. On the other hand, fossil fuels can only be replenished on a geological time scale.
Until now, thermochemical processes have been considered as the most effective methods for lignocellulosic biomass utilization.3-6 Torrefaction, also named mild pyrolysis, is a thermochemical pretreatment method performed between 200 and 300 °C in an inert atmosphere for the partial conversion of biomass.7 Torrefied lignocellulose has improved fuel characteristics compared to the original biomass, such as reduced moisture content, and increased hydrophobicity, grindability8, and energy density9. Furthermore, compared to untreated biomass, storage properties of the torrefied material are significantly improved as biological degradation and water uptake is minimized.10
Forests are one of Europe's most important renewable resources; the European Union has approximately 182 million hectares of forests, corresponding to 42% of the European Union land area.11 As a result of afforestation programs and due to natural regeneration on marginal lands, forest cover in the European Union has increased over the past few decades.11 During harvesting
and thinning of forest, stem wood is the main product, while the other parts of the tree (including bark and stump) are considered as byproducts. According to the literature, stump constitutes 23- 25% of the stem volume of a coniferous tree12 and bark can account for 6-20% of the total volume of the stems13, therefore these byproducts represent an abundant and underutilized bioenergy potential. To estimate the usability of the torrefaction pretreatment for stem wood, stump, and bark, it is important to widen our knowledge on how the different parts of Norway spruce behave during the low temperature thermal decomposition.
Norway spruce (Picea abies) is one of the most important coniferous species in Europe; it dominates Europe’s Boreal and sub-Alpine coniferous forests, ranging from Central to Northern Europe and east to the Ural Mountains.14 Until now, several studies have been carried out on the thermal characteristics of Norway spruce stem wood during torrefaction.15-20 Most of these studies focused on the physical characterization, such as proximate and ultimate analyses, grindability, moisture adsorption, and energy content of the torrefied biomass. Contrary to stem wood, only a few research papers have been presented on the thermal decomposition of bark and stump during torrefaction.8, 12, 21-23 Two of these studies investigate only the pyrolysis kinetics of stump and bark materials.21-22 In our previous works8, 23, the thermal behavior of untreated and torrefied stem wood, stump, and bark was studied with the goal of understanding better the thermal conversion process taking place during torrefaction. The objectives of these earlier works were to study the effect of torrefaction on the physicochemical properties, grinding energy consumption, chemical composition and thermal stability of the woody biomass materials including stem wood, stump, and bark.
The objective of this further work was to investigate the effect of torrefaction temperature and residence time on the product distribution during pyrolysis of different parts of Norway spruce
(stem wood, stump, and bark). Pyrolysis-gas chromatography/mass spectrometry (Py-GC/MS) has been found to be a suitable technique to investigate the distribution of the decomposition products of the untreated and torrefied samples under fast pyrolysis conditions. 24, 25 The obtained pyrolysis data were evaluated by a statistical analysis method, i.e., principal component analysis (PCA) with the goal of revealing correlations between the temperature and residence time of the torrefaction pretreatment and the pyrolysis products distribution of the various torrefied stem wood, stump, and bark samples.
2. EXPERIMENTAL SECTION 2.1 Materials
Different parts of a representative single Norway spruce (Picea abies) tree were selected for the torrefaction study: stem wood, stump, and bark. The samples originated from a Norway spruce forest in South Norway. After harvested, the trees were divided into three parts: trunk, stump, and forest residues. The trunk was further debarked to obtain stem wood and bark. The stem wood was first cut into strips, and then further chopped into cubes with sides of 1 cm length. The bark was chipped into pieces and those with length of around 5-7 cm were used for the torrefaction experiments. The stump was shredded into pieces and the pieces with length of 3-5 cm were torrefied. The untreated and torrefied samples were ground by a cutting mill to <1 mm particle size, then were further ground in a Retsch MM301 cryomill to obtain homogeneous, representative samples for the Py-GC/MS experiments.
The physicochemical properties, grinding energy consumption, chemical composition, and thermal stability of the same untreated and torrefied stem wood, stump, and bark samples were investigated in detail and published in our previous papers.8, 23
2.2 Torrefaction experiments
The torrefaction experiments of the different parts of Norway spruce were carried out in a batch tube reactor placed in an electrical furnace in nitrogen atmosphere using flow rates of 1 L min-1. Approximately 80 g of the untreated samples were heated up at a heating rate of 15 °C min-1 to three final temperatures (225, 275, and 300 °C). The residence time for one sample at each final temperature was 30 and 60 min, respectively. More details about the torrefaction setup and experiments can be found in our previous paper.8, 23
2.3 Pyrolysis-gas chromatography/mass spectrometry (Py-GC/MS)
Py-GC/MS measurements were carried out in a CDS Pyroprobe 2000 equipped with a platinum coil and quartz sample tube. The pyrolyzer was coupled to an Agilent 6890/5973 GC/MS instrument. Approximately 0.6 mg samples were pyrolyzed at 550 °C for 20 s in a quartz tube using helium carrier gas. The pyrolysis temperature was selected on the basis of our earlier TG/MS experiments.23 The pyrolysis products were separated on an Agilent DB-1701 capillary column (30 m × 0.25 mm i.d., 0.25 µm film thickness). The pyrolysis interface and the GC injector were held at 280 °C. The GC oven was programmed to hold at 40 °C for 4 min and then increase to 280
°C at a rate of 6 °C min-1. The mass range of m/z 14-500 was scanned by the mass spectrometer in electron impact mode at 70 eV. The identification of the pyrolysis products was based on NIST and Wiley mass spectral libraries and literature data. Three replicate experiments were carried out for each sample. The relative amounts of the compounds were estimated using the averages of the peak areas of the total ion current chromatograms normalized for the sample mass. The standard deviation of the triplicate measurement was calculated for each compound and was typically 10 - 20 % of the peak area.
2.4 Principal component analysis
Due to the large number of samples, principal component analysis (PCA) has been used to carry out linear data reduction for the purpose of pattern visualization.26 In this work, PCA has been applied to illustrate similarities and differences between the Py-GC/ MS data of the untreated and torrefied stem wood, stump and bark samples. The calculation is based on the normalized peak areas of the pyrolysis products. Those compounds were eliminated from the calculation where the relative standard deviation was more than 20% for two or more samples. Some of the loadings characterized the same properties and therefore the model could be simplified by omitting the redundant compounds. Finally, 21 pyrolysis products have been used in the calculation.
3. RESULTS AND DISCUSSIONS 3.1 Py-GC/MS results
Pyrolysis-gas chromatography/mass spectrometry has been applied to reveal the changes in the pyrolysis product distribution of the samples after torrefaction. The pyrolysis temperature was selected to 550 °C on the basis of our earlier TG/MS experiments23, which indicated that this temperature was adequate for the almost complete decomposition of the organic materials.
3.1.1 Comparison of the untreated stem wood, stump, and bark samples
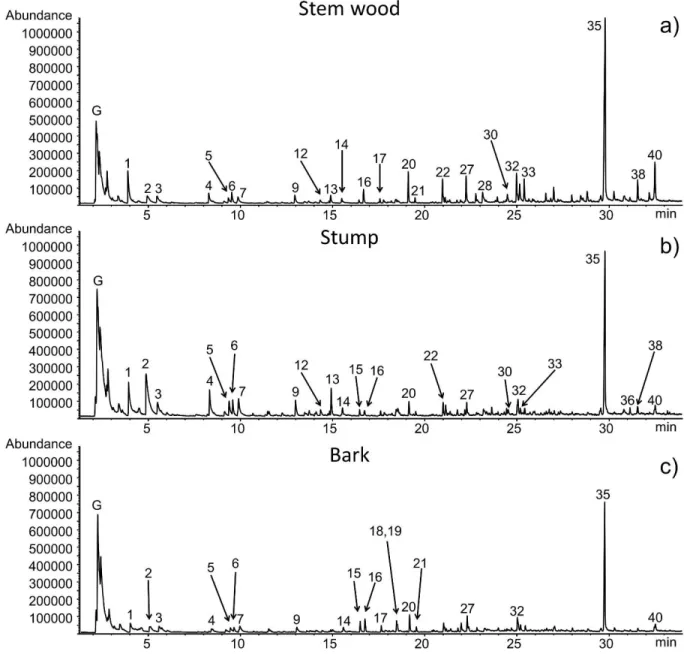
Figure 1 shows the pyrograms of the untreated stem wood, stump, and bark samples, while Table 1 lists the identification and the possible origin of 40 main decomposition products based on mass spectral libraries and literature data.27-30 In Figure 1, the unresolved peaks at lower retention times (denoted by G) represent the evolution of gaseous and vapor products of low molecular mass, such as methane, carbon dioxide, and water, which may be formed by the scission of different functional
groups of numerous components. Comparison of the pyrograms of untreated stem wood, stump, and bark (Figure 1) shows that the main pyrolysis products seem to be similar.
Acetic acid (Peak #2), 3-hydroxypropanal (Peak #4), furfural (Peak #7), and 4-hydroxy-5,6- dihydro-(2H)-pyran-2-one (Peak #13) are the most typical decomposition products of hemicellulose under inert atmosphere. In Figure 1, the comparison of the three pyrograms displays that untreated stump releases the highest amount of acetic acid (Peak #2), and 3-hydroxypropanal (Peak #4), which is in agreement with our earlier chemical composition results8 (Figure 2a) showing that stump has the highest hemicellulose content among the studied materials. The main decomposition product of cellulose during pyrolysis is levoglucosan (Peak #35), which is an anhydroglucose and can be considered as the monomer of cellulose. Stem wood releases the highest yield of levoglucosan (Figure 1), which has the highest cellulose content among the three untreated samples (Figure 2a). Another characteristic thermal decomposition product of the cellulose component is hydroxyacetaldehyde (Peak #1). As can be seen in Table 1, other carbohydrate products are also observed from the three untreated samples, which may originate from both cellulose and hemicellulose. As Figure 1 and Table 1 illustrate, several lignin monomeric compounds were identified in the chromatograms of the stem wood, stump and bark samples. Smaller differences in the thermal behavior of the untreated stem wood, stump, and bark samples during pyrolysis can be explained by their different composition as discussed below.
Figure 1. Pyrograms of untreated (a) stem wood, (b) stump, and (c) bark samples.
Numbered peak identities are given in Table 1. G: unresolved peak of gaseous and low molecular mass products.
Table 1. The main decomposition products released during the Py-GC/MS experiments of untreated stem wood, stump, and bark samples. Peak numbers refer to the peaks in Figures 1 and 7b. Possible origin of the identified compounds: C: cellulose; H: hemicellulose; CH: carbohydrate (cellulose and/or hemicellulose), L: lignin.
No.
Ret.
time (min)
Compounds
Most abundant ions
Molar mass
Possible origin
1 3.81 Hydroxyacetaldehyde 31, 29, 32, 60 60 CH
2 4.92 Acetic acid 43, 45, 60 60 H, L
3 5.44 1-Hydroxy-2-propanone 43, 74 74 CH
4 8.03 3-Hydroxypropanal 43, 73, 74 74 CH
5 9.35 Butanedial 58, 57, 29 86 CH
6 9.55 2-Hydroxybutanal-3-one 43, 102 102 CH
7 9.86 Furfural 96, 95, 39, 67 96 CH
8 11.43 1-Acetyloxypropane-2-one 43, 96, 67 116 CH
9 12.96 1,2-Cyclopentandione 98, 55, 42, 69 98 CH
10 13.70 5-Methyl-2-furancarboxaldehyde 110, 109, 53 110 CH
11 14.01 3-Methyl-2-cyclopenten-1-one 96, 67, 53 96 CH
12 14.37 (5H)-Furan-2-one 55, 84, 54 84 CH
13 14.92 4-Hydroxy-5,6-dihydro-(2H)-pyran-2-one 114, 58, 29 114 CH
14 15.50
2-Hydroxy-3-methyl-2-cyclopentene-1- one
112, 69, 55, 83 112 CH
15 16.42 Phenol 94, 66, 65, 39 94 L, CH
16 16.70 Guaiacol 109, 124, 81 124 L
17 17.58 2-Methylphenol 108, 107, 79 108 L
18 18.42 3-Methylphenol 108, 107, 79 108 L
19 18.47 4-Methylphenol 108, 107, 77 108 L
20 19.15 4-Methyl-guaiacol 138, 123, 95, 77 138 L
21 19.49 2,4-Dimethylphenol 122, 107, 121 122 L
22 20.99 Carbohydrate 69, 57, 43 CH
23 21.04 Ethylguaiacol 137, 152 152 L
24 21.14
4-Hydroxy-3-methyl-(5H)-furanone or 3-Methyl-2,4-furandione
114, 56, 84, 42 114 CH
25 21.38 4-Ethyl-3-methylphenol 121, 136, 77 136 L
26 21.77 1,4:3,6-Dianhydro-α-D-glucopyranose 69, 57, 41, 98 144 C
27 22.27 4-Vinylguaiacol 150, 135, 107 150 L
28 23.22 5-Hydroxymethyl-2-furaldehyde 97, 126, 41, 69 126 CH
29 23.40 Catechol 110, 64, 81, 92 110 L
30 24.52
2-Hydroxymethyl-5-hydroxy-2,3- dihydro-(4H)-pyran-4-one
144, 87, 97 144 CH
31 24.98 4-Methylcatechol 124, 123, 78 124 L
32 25.04 trans-Isoeugenol 164, 149, 131 164 L
33 25.45 Vanilline 151, 152, 81 152 L
34 29.59 1,6-Anhydro-α-D-galactopyranose 60, 57, 73 162 H
35 29.79
1,6-Anhydro-β-D-glucopyranose (Levoglucosan)
60, 57, 73 162 CH
36 30.88 Anhydrosugar 73, 57, 60, 69 CH
37 31.20 Anhydrosugar 43,73, 60, 57 CH
38 31.61 Anhydrosugar 69, 45, 73 CH
39 32.24 trans-Coniferyl alcohol 137, 180, 124, 91 180 L
40 32.57 Coniferaldehyde 178, 135, 147, 107 178 L
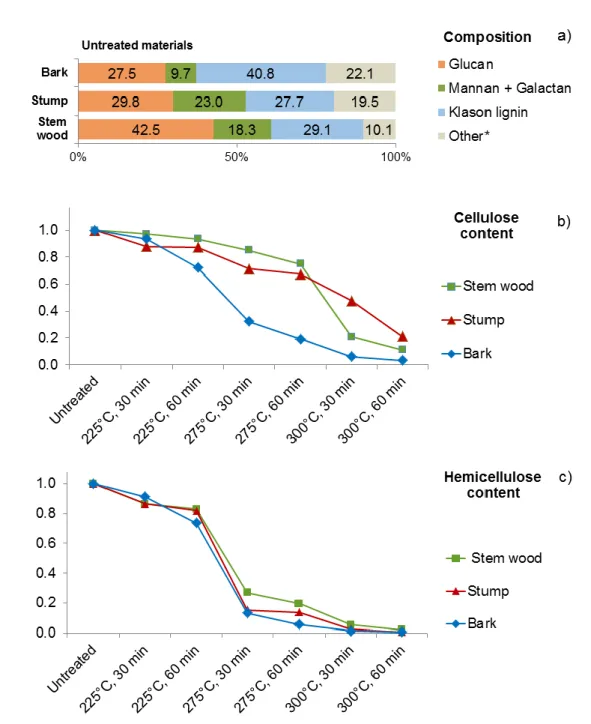
Figure 2. (a) Chemical composition of the untreated stem wood, stump, and bark materials8 and (b) relative amount of cellulose (glucan) and (c) hemicellulose (mostly sum of mannan and
galactan) content of the torrefied stem wood, stump, and bark samples as a function of
torrefaction severity (temperature and residence time). (*The sum of unquantified components includes extractives, acid-soluble lignin, and acid soluble minerals.)
3.1.2 Comparison of the torrefied stem wood, stump, and bark samples
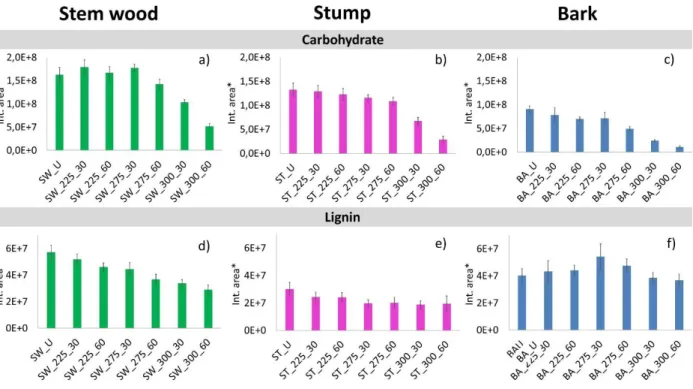
In order to study the thermal degradation process of the variously torrefied stem wood, stump, and bark samples, 40 main pyrolysis products (Table 1) were organized into groups of carbohydrates (sum of cellulose and hemicellulose) and lignin decomposition products and the relative peak areas of these compounds were plotted in Figure 3. The relative peak areas were normalized to unit sample mass. Furthermore, the mass loss during torrefaction was also taken into account to provide a reasonable comparison of the untreated and treated samples. In our previous work8, the chemical composition of untreated and torrefied stem wood, stump, and bark was determined by acidic hydrolysis and subsequent high-performance liquid chromatography analysis. Figures 2b and c present the variation of the relative amount of glucan, and sum of mannan and galactan in the torrefied samples, which reflects the changes in the relative amounts of cellulose and hemicellulose in the samples, respectively. The presented data are normalized to the measured glucan or sum of mannan and galactan content of the thermally untreated samples. The decreasing carbohydrate yields indicate the progress of the thermal decomposition of cellulose and hemicellulose during torrefaction at various temperatures. It should be emphasized that cellulose and hemicellulose degraded partly to volatile products and partly to a carbonized residue. The amounts of the released volatile compounds were determined by weighing the samples before and after torrefaction and were included in the calculations. The carbonized residue remains in the Klason lignin during the determination of the composition. Therefore, the amount of this fraction increased as a function of torrefaction temperature, as discussed in the previous paper8.
As can be seen in Figure 3, the relative intensities of the carbohydrate decomposition products are higher during the pyrolysis of untreated and torrefied stem wood and stump than that of the bark sample, which is in agreement with the higher cellulose and hemicellulose content of the stem wood and stump materials (Figure 2a). As Figures 3a, b, and c show, the carbohydrate content of the stem wood and stump samples does not decrease significantly up to 275 °C torrefaction temperature, while in case of the bark sample the degradation of the carbohydrate components is significant at 275 °C torrefaction temperature and 60 min residence time. These observations may point to that the thermal stability of cellulose in the bark sample is lower compared to the stem wood and stump samples due to the well-known fact that alkali ions (especially potassium) have a catalytic effect on the decomposition mechanism of cellulose.31-33 The bark sample has more than an order of magnitude higher potassium content than the stem wood and stump samples8. The results obtained by chemical composition analysis (Figure 2b) and Py-GC/MS (Figure 3a, b, and c) support that potassium has a catalytic effect on the cellulose decomposition, which indicates lowered thermal stability of the cellulose content in the bark sample, by about 25 °C compared to the stem wood and stump samples. Bark has the highest lignin content (Figure 2a); however, it did not evolve more lignin monomeric compounds than stem wood (Figures 3d and e). This result can be explained by the catalytic effect of the potassium, which leads to the cleavage of functional groups and enhanced carbonization accompanied by the reduced formation of lignin monomeric compounds34.
In the following sections, the relative peak areas of the main hemicellulose, and cellulose as well as lignin decomposition products of the untreated and the torrefied stem wood, stump, and bark samples will be discussed in detail.
Figure 3. Sum of relative peak areas of carbohydrate and lignin pyrolysis products of the studied stem wood, stump, and bark samples. (*Relative peak areas are normalized to unit sample mass.
The mass loss during torrefaction8 is also taken into account.)
Cellulose and hemicellulose derived pyrolysis products of torrefied stem wood, stump, and bark samples
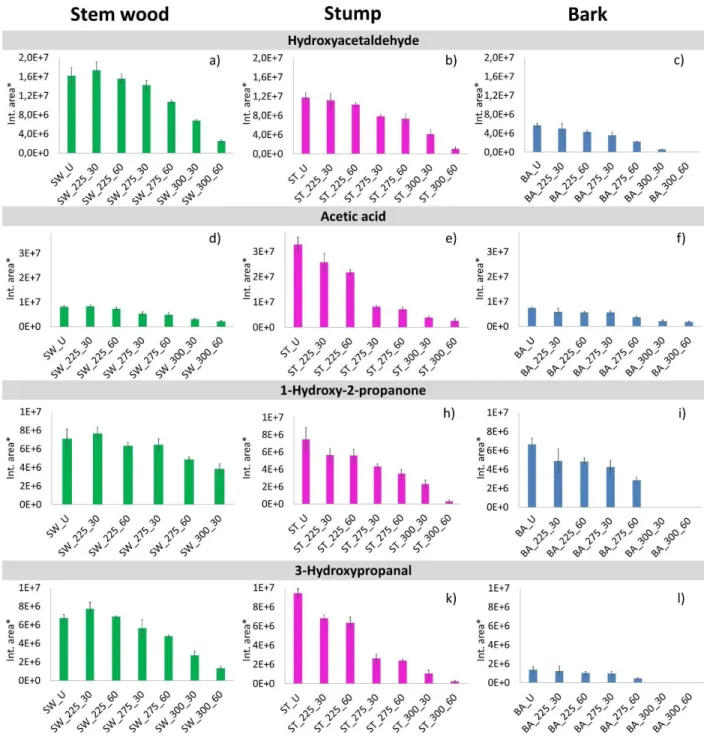
As discussed above, the peaks at lower retention times in Figure 1, such as hydroxy acetaldehyde (Peak #1), acetic acid (Peak #2), 1-hydroxy-2-propanone (Peak #3), and 3-hydroxypropanal (Peak
#4) correspond to the main smaller molecular mass decomposition products of hemicellulose and cellulose, which are formed by fragmentation of the sugar units. The relative peak areas of these volatile pyrolysis products of all studied samples are presented in Figure 4. As can be seen, the yields of these carbohydrate products decreased with increasing torrefaction temperature and residence time for each sample in agreement with the results of Chen et al.35 Hydroxyacetaldehyde is a thermal decomposition product of cellulose and hemicellulose, which is moderately reduced
in the stem wood, stump, and bark samples after torrefaction at 225 °C (Figures 4a, b, and c). The decreasing evolution of acetic acid (Figures 4d, e and f) confirms the scission of the most labile acetate groups from the hemicellulose chains of the samples after torrefaction.
As can be seen in Figure 4, the yield of all these four products further decreased after torrefaction at 275 °C, while after torrefaction at 300 °C, the majority of these low molecular weight products disappeared from the bark and reduced markedly from stem wood and stump samples. The changes of the main smaller molecular mass products of hemicellulose and cellulose are in agreement with the chemical composition (Figure 2) results.
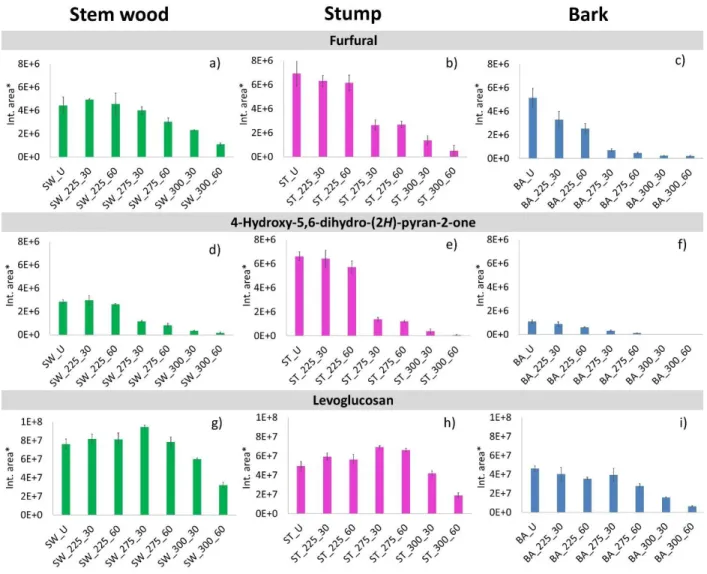
Among the carbohydrate-derived products detected in the pyrolyzates of the samples at higher retention times (Table 1), the characteristic ones were furfural (Peak #7), 4-hydroxy-5,6-dihydro- (2H)-pyran-2-one (Peak #13), and levoglucosan (Peak #35). The relative peak areas of these decomposition products are shown in Figure 5.
Furfural originates from both cellulose and hemicellulose. Its intensity is significantly reduced from the torrefied bark samples after torrefaction at 225 °C, while in case of stem wood and stump, the intensity of furfural is reduced only after torrefaction at 275 °C (Figures 5a, b, and c) due to the decreased carbohydrate content (Figures 2 b and c). The yield of 4-hydroxy-5,6-dihydro-2H- pyran-2-one (Peak #13) decreased similarly in the torrefied samples (Figures 5d, e, and f), which also confirms a reduction of the carbohydrate content during torrefaction. As can be seen in Figure 2c, the hemicellulose content significantly decreased in the samples torrefied at 275°C and only a small amount of hemicellulose remained in the samples torrefied at 300 °C. Therefore, the decreased pyrolysis yield of furfural and 4-hydroxy-5,6-dihydro-2H-pyran-2-one reflects dominantly the reduction of the hemicellulose content during torrefaction at 275 and 300 °C.
The main decomposition product of cellulose during pyrolysis is an anhydroglucose, levoglucosan (1,6-anhydro-β-D-glucopyranose, Peak #35). As Figures 5 g, h, and i show, the yield of levoglucosan started to reduce after torrefaction at 275 °C for 60 min in the bark sample, while in case of the stem wood and stump samples it was not decreased significantly after torrefaction at 300 °C for 30 min.
Comparing the changes of cellulose and hemicellulose contents of the samples as a function of torrefaction temperature (Figures 2b and c), it can be concluded that hemicellulose (measured as the sum of mannan and galactan) is thermally less stable than cellulose during torrefaction. As Figure 2c shows, the relative amount of hemicellulose changed similarly in the stem wood, stump, and bark samples as a function of increasing torrefaction temperature and residence time with no measurable impact of the different potassium contents of the samples. On the other hand, the catalytic influence of potassium on the thermal stability of cellulose is reflected in the significantly decreased cellulose content of the bark sample of high potassium content at 275 °C torrefaction temperature (Figure 2b). The combined results of Py-GC/MS (Figures 5g, h, and i) and chemical composition analysis (Figure 2b) confirm the catalytic effect of potassium on the cellulose decomposition during torrefaction.
Lignin derived pyrolysis products of torrefied stem wood, stump, and bark samples
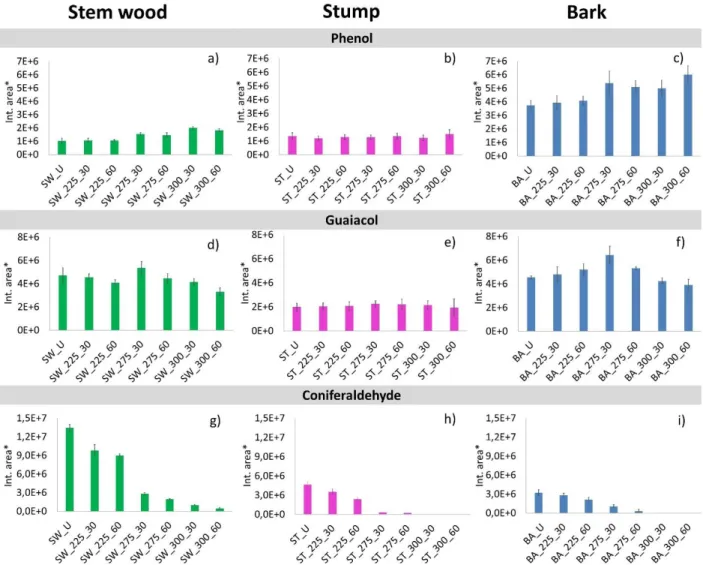
Phenolic compounds dominate the pyrograms of stem wood, stump, and bark samples after 16 min retention time (Figure 1, Table 1), demonstrating the presence of lignin component in the samples.
As can be seen in Figure 6, the intensity of phenol (Peak #15) is significantly higher among the decomposition products of untreated and torrefied bark than for the stem wood and stump samples.
This observation indicates the high lignin content of bark (Figure 2a), and the catalytic effect of
alkali ions on the cleavage of functional groups. The intensity of phenol from untreated and torrefied stem wood and stump is quite similar in agreement with their relative lignin content. The relative intensity of phenol and guaiacol does not change significantly by the torrefaction temperature. Similar tendencies have been observed by Pelaez-Samaniego et al.24 for phenolic pyrolysis products of torrefied wood samples after DCM extraction. Coniferyl aldehyde has a propenyl side group on the aromatic ring; hence it reflects the original lignin structure. As shown in Figures 6g, h, and i, coniferyl aldehyde was present in the pyrolysate of each sample after torrefaction up to 275 °C for 60 min. The decreasing tendency of coniferyl aldehyde yield with increasing torrefaction temperature and residence time indicates the progress of side-group scission of lignin during the thermal treatment.
The comparison of the changes in carbohydrate and lignin contents of the samples (Figure 2-6) revealed that stem wood and stump behaved similarly during torrefaction, while the thermal decomposition of the bark sample is different due to the higher potassium content of the bark, which has a catalytic effect on the cellulose decomposition. Therefore, we may conclude that the stem wood and stump materials can be utilized together in a thermochemical conversion application. Applying lower torrefaction temperature is recommended for bark because of the significant catalytic effect of its high potassium content.
Figure 4. Relative peak areas of hydroxyacetaldehyde (Peak #1), acetic acid (Peak #2), 1- hydroxy-2-propanone (Peak #3), and 3-hydroxypropanal (Peak #4) evolved from untreated and
torrefied stem wood, stump, and bark samples. (*Relative peak areas are normalized to unit sample mass. The mass loss during torrefaction8 is also taken into account.)
Figure 5. Relative peak areas of furfural (Peak #7), 4-hydroxy-5,6-dihydro-(2H)-pyran-2-one (Peak #13), and levoglucosan (Peak #35) evolved from untreated and torrefied stem wood, stump, and bark samples. (*Relative peak areas are normalized to unit sample mass. The mass
loss during torrefaction8 is also taken into account.)
Figure 6. Relative peak areas of phenol (Peak #15), guaiacol (Peak #16), and coniferaldehyde (Peak #40) evolved from untreated and torrefied stem wood, stump, and bark samples. (*Relative
peak areas are normalized to unit sample mass. The mass loss during torrefaction8 is also taken into account.)
3.2 Principal component analysis of the stem wood, stump, and bark samples
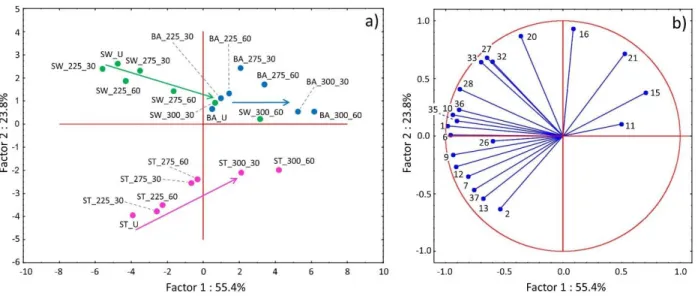
Principal component analysis (PCA) has been applied to illustrate the correlations between the composition of pyrolysis products and the torrefaction temperature and residence time. In the PCA calculation, the first principal component (Factor 1) described 55% of the total variance and the second component (Factor 2) described 24% of the total variance; these two factors were sufficient
to characterize the major differences between the studied samples. It can be seen in the score plot (Figure 7a) that Factor 1 differentiates the untreated, the mildly and the severely torrefied samples.
As a function of Factor 2, the untreated stem wood, stump, and bark samples are found in different parts of the score plot. After torrefaction pretreatments, the difference between the bark samples and the stem wood and stump samples decreases. This difference is certainly due to the different chemical composition of the samples; which causes the different intensities of the pyrolysis products of the stem wood, stump, and bark samples. The numbers in the loading plot (Figure 7b) correspond to the peak numbers given in Table 1. The decomposition products of carbohydrates (Peak #1, #6, #35, #10, #9) correlate mainly with Factor 1, while the lignin decomposition products (Peak #16, #20, #21, #27, #32, #33) contribute mainly to Factor 2. The PCA calculations revealed that the pyrolysis product distribution changed to a greater extent in the samples torrefied at 275- 300 °C temperature range, than at 225 °C.
Figure 7. Results of principal component analysis based on MS ion intensity data obtained from Py-GC/MS measurements of untreated and torrefied stem wood, stump and bark samples.
Numbers refer to the decomposition products listed in Table 1.
4. CONCLUSION
Comparative Py-GC/MS analysis of untreated and variously torrefied Norway spruce stem wood, stump, and bark materials has been performed with the aim of understanding the structural changes of the hemicellulose, cellulose, and lignin components taking place during torrefaction. The relative amount of cellulose, hemicellulose and lignin pyrolysis products measured by Py-GC/MS well reflected the results of the compositional analysis based on acidic hydrolysis and subsequent HPLC analysis. The joint interpretation of the changes in the pyrolysis product distribution and the chemical composition supports the assumption that the alkali ions do not catalyze the thermal decomposition of hemicellulose as opposed to cellulose. The Py-GC/MS analysis showed that the yields of acetic acid and other lightweight compounds were lower in the pyrolyzate of torrefied stem wood, stump, and bark samples than in the untreated samples. The PCA analysis revealed that mostly the yield of carbohydrate decomposition products correlates with the severity of torrefaction confirming that carbohydrates decompose to the greatest degree during torrefaction.
The differences between the stem wood, stump and bark samples show relationship with the amount of the lignin pyrolysis products. The torrefied stem wood and stump behaved similarly during torrefaction; therefore, they can be utilized together in thermochemical conversion applications. In comparison to stem wood and stump, bark undergone more intensive degradation during torrefaction, which have considerably different physicochemical properties and conversion behaviors.
AUTHOR INFORMATION
Corresponding author
* Zsuzsanna Czégény Tel.:+36-13826510
E-mail address: czegeny.zsuzsanna@ttk.mta.hu
Postal address: Magyar tudósok körútja 2, Budapest, H-1117, Hungary Author Contributions
The manuscript was written through contributions of all authors. All authors have given approval to the final version of the manuscript.
Funding Sources
National Research, Development and Innovation Office (NKFIH) (TNN 123499 project) European Regional Development Fund (VEKOP-2.3.2-16-2017-00013 project)
Research Council of Norway (BioCarb+, GAFT and CARBO-FERTIL projects)
ACKNOWLEDGEMENT
The authors are grateful to the National Research, Development and Innovation Office (NKFIH) for financing the TNN 123499 project. The research within project No. VEKOP-2.3.2-16-2017- 00013 was supported by the European Union and the State of Hungary, co-financed by the European Regional Development Fund. The Norway team acknowledges the financial support from the Research Council of Norway and a number of industrial partners through the project BioCarb+ (“Enabling the Biocarbon Value Chain for Energy”, Grant No. 228726/E20), GAFT (“Gasification and FT-Synthesis of Lignocellulosic Feedstocks”, Grant No. 244069/E20) and CARBO-FERTIL (Implementing Biochar-Fertilizer Solution in Norway for Climate and Food Production Benefits, Grant No. 281113/E50).
ABBREVIATIONS
BA, Bark; ST, Stump; SW, Stem wood; BA_U, Untreated bark; SW 225_60, Torrefied stem wood obtained by torrefaction at 225 °C for 60 minutes isothermal period; HPLC, High-performance liquid chromatography; PCA, Principal Component Analysis; Py-GC/MS, Pyrolysis-gas chromatography/mass spectrometry.
REFERENCES
(1) Volkart, K.; Mutel, C.L.; Panos, E. Integrating life cycle assessment and energy system modelling: Methodology and application to the world energy scenarios. Sustain. Prod. Consum.
2018, 16, 121-133.
(2) Zhu, Y.; Si, Y.; Wang, X.; Zhang, W.; Shao, J.; Yang, H.; Chen, H. Characterization of hydrochar pellets from hydrothermal carbonization of agricultural residues. Energ. Fuel. 2018, 32, 11538–11546.
(3) Bhaskar, T.; Pandey, A. Advances in thermochemical conversion of biomass. In: Recent advances in thermo-chemical conversion of biomass; Pandey, A., Bhaskar, T., Stocker, M., Sukumaran, R.K., Eds.; Elsevier, Amsterdam, 2015, pp: 3-30.
(4) Akhtar, A.; Krepl, V.; Ivanova, T. A combined overview of combustion, pyrolysis, and gasification of biomass. Energ. Fuel. 2018, 32, 7294-7318.
(5) Chen, T.; Ku, X.; Lin, J.; Fan, L. New pyrolysis model for biomass particles in a thermally thick regime. Energ. Fuel. 2018, 32, 9399-9414.
(6) Rony A.H.; Mosiman D.; Sun Z.; Qin D.; Zheng Y.; Boman J.H.; Fan M. A novel solar powered biomass pyrolysis reactor for producing fuels and chemicals. J. Anal. Appl. Pyrol. 2018, 132, 19- 32.
(7) Brachi, P.; Chirone,R.; Miccio, M.; Ruoppolo, G. Fluidized bed torrefaction of commercial wood pellets: Process performance and solid product quality. Energ. Fuel. 2018, 32, 9459-9469.
(8) Wang, L.; Barta-Rajnai, E.; Skreiberg, Ø.; Khalil, R.; Czégény, Zs.; Jakab, E.; Barta, Zs.;
Grønli, M. Effect of torrefaction on physiochemical characteristics and grindability of stem wood, stump and bark. Appl. Energ. 2018, 227, 137-148.
(9) Zhang, C.; Ho, S.H.; Chen, W.H.; Xie, Y.; Liu, Z.; Chang, J.S. Torrefaction performance and energy usage of biomass wastes and their correlations with torrefaction severity index. Appl.
Energ. 2018, 220, 598-604.
(10) Chen, W.H.; Peng, J.; Bi, X.T. A state-of-the-art review of biomass torrefaction, densification and applications. Renew. Sustain. Energ. Rev. 2015, 44, 847-866.
(11) The European Commission, EU Science HUB, Forest resources in the EU and the EU Forest Strategy, www.ec.europa.eu/agriculture/forest_en, 2018.08.14.
(12) Tran, K.Q.; Luo, X.; Seisenbaeva, G.; Jirjis, R. Stump torrefaction for bioenergy application.
Appl. Energ. 2013, 112, 539-546.
(13) Liepiņš, J.; Liepiņš, K. Evaluation of bark volume of four tree species in Latvia. Res. Rural Develop. 2015, 2, ISSN: 1691-4031.
(14) The European Commission, EU Science HUB, www.ec.europa.eu/jrc/en/research-
(15) Normark, M.; Pommer, L.; Gräsvik, J.; Hedenström, M.; Gorzsás, A.; Winestrand, S.;
Jönsson, L.J. Biochemical conversion of torrefied Norway Spruce after pretreatment with acid or ionic liquid. Bioenerg. Res. 2016, 9, 355-368.
(16) Maryandyshev, P.A.; Chernov, A.A.; Popova, E.I.; Eseev, M. K.; Lyubov, V.K. Isothermal and morphological studies of the torrefaction of spruce wood. Solid Fuel Chem., 2018, 52 (3), 153- 162.
(17) Tapasvi, D.; Khalil, R.; Skreiberg, Ø.; Tran, K.Q.; Grønli, M. Torrefaction of Norwegian birch and spruce: An experimental study using Macro-TGA. Energ. Fuel. 2012, 26, 5232-5240.
(18) Chang, S.; Zhao, Z.; Zheng, A.; He, F.; Huang, Z.; Li, H. Characterization of products from torrefaction of sprucewood and bagasse in an auger reactor. Energ. Fuel. 2012, 26, 7009-7017.
(19) Branca, C.; Di Blasi, C.; Galgano, A.; Broström, M. Effects of the Torrefaction Conditions on the fixed-bed pyrolysis of Norway Spruce. Energ. Fuel. 2014, 28, 5882-5891.
(20) Strandberg, M.; Olofsson, I.; Pommer, L.; Wiklund-Lindström, S.; Åberg, K.; Nordin, A.
Effects of temperature and residence time on continuous torrefaction of spruce wood. Fuel Proc.
Technol. 2015, 134, 387-398.
(21) Tran, K.Q.; Bach, Q.V.; Trinh, T.T.; Seisenbaeva G. Non-isothermal pyrolysis of torrefied stump – A comparative kinetic evaluation. Appl. Energ. 2014, 136, 759-766.
(22) Barta-Rajnai, E.; Várhegyi, G.; Wang, L.; Skreiberg, Ø.; Grønli, M.; Czégény, Zs. Thermal decomposition kinetics of wood and bark and their torrefied products. Energ. Fuel. 2017, 31 (4), 4024-4034.
(23) Barta-Rajnai, E.; Wang, L.; Sebestyén, Z.; Barta, Zs.; Khalil, R.; Skreiberg, Ø.; Grønli, M.;
Jakab, E.; Czégény, Zs. Comparative study on the thermal behavior of untreated and various torrefied bark, stem wood and stump of Norway spruce. Appl. Energ. 2017, 204, 1043-1054.
(24) Pelaez-Samaniego, M.R.; Yadama, V.; Garcia-Perez, M.; Lowell, E.; McDonald, A.G. Effect of temperature during wood torrefaction on the formation of lignin liquid intermediates. J. Anal.
Appl. Pyrol. 2014, 109, 222–233.
(25) Pelaez-Samaniego, M.R.; Yadama, V.; Garcia-Perez, M.; Lowell, E. Abundance and characteristics of lignin liquid intermediates in wood (Pinus ponderosa Dougl. ex Laws.) during hot water extraction. Biomass Bioenerg. 2015, 81, 117-128.
(26) Wold, S.; Esbensen, K.; Geladi, P. Principal component analysis, Chemom. Intell. Lab. Syst., 1987, 2, 37-52.
(27) Faix, O.; Meier, D.; Grobe, I. Studies on isolated lignins and lignins in woody materials by pyrolysis-gas chromatography-mass spectrometry and off-line pyrolysis-gas chromatography with flame ionization detection, J. Anal. Appl. Pyrol. 1987, 11, 403-416.
(28) Faix, O.; Meier, D.; Fortmann, I. Thermal degradation products of wood – A collection of electron-impact (EI) mass spectra of monomeric lignin derived products, Holz Roh Werkst. 1990, 48, 351-354.
(29) Faix, O.; Meier, D.; Fortmann, I. Thermal degradation products of wood – A collection of electron-impact (EI) mass spectra of polysaccharide derived products, Holz Roh Werkst. 1991, 49, 299-304.
(30) Genuit, W.; Boon, J.J.; Faix O. Characterization of beech milled wood lignin by pyrolysis- gas chromatography-photoionization mass spectrometry, Anal. Chem. 1987, 59, 508-513.
(31) DeGroot, W.F.; Shafizadeh, F. The influence of exchangeable cations on the carbonization of biomass. J. Anal. Appl. Pyrol., 1984, 6, 217-232.
(32) Jakab, E. Analytical Techniques as a tool to understand the reaction mechanism. In: Recent advances in thermo-chemical conversion of biomass; Pandey, A; Bhaskar, T; Stocker, M;
Sukumaran, R.K., Eds.; Elsevier, Amsterdam, 2015, pp: 73-106.
(33) Safar, M.; Lin, B.-J.; Chen, W.-H.; Langauer, D.; Jo-Shu Chang, J.-S.; Raclavska, H.;
Pétrissans, A.; Rousset, P.; Pétrissans, M. Catalytic effects of potassium on biomass pyrolysis, combustion and torrefaction. Appl. Energ. 2019, 235, 346-355.
(34) Jakab, E.; Faix, O.; Till F. Thermal decomposition of milled wood lignins studied by thermogravimetry/mass spectrometry. J Anal. Appl. Pyrol. 1997, 40-41, 171-186.
(35) Chen, W.-H.; Wang, C.-W.; Kumar, G.; Rousset, P.; Hsieh, T.-H. Effect of torrefaction pretreatment on the pyrolysis of rubber wood sawdust analyzed by Py-GC/MS. Biores. Technol.
2018, 259, 469-473.
FIGURE CAPTIONS
Fig. 1. Pyrograms of untreated (a) stem wood, (b) stump, and (c) bark samples. Numbered peak identities are given in Table 1. G: unresolved peak of gaseous and low molecular mass products.
Fig. 2. (a) Chemical composition of the untreated stem wood, stump, and bark materials8 and (b) relative amount of cellulose (glucan) and (c) hemicellulose (mostly sum of mannan and galactan)
content of the torrefied stem wood, stump, and bark samples as a function of torrefaction severity (temperature and residence time). (*The sum of unquantified components includes extractives, acid-soluble lignin, and acid soluble minerals.)
Fig. 3. Sum of relative peak areas of carbohydrate and lignin pyrolysis products of the stem wood, stump, and bark samples. (*Relative peak areas are normalized to unit sample mass. The mass loss during torrefaction is also taken into account.)
Fig. 4. Relative peak areas of hydroxyacetaldehyde (Peak #1), acetic acid (Peak #2), 1-hydroxy- 2-propanone (Peak #3), and 3-hydroxypropanal (Peak #4) evolved from untreated and torrefied stem wood, stump, and bark samples. (*Relative peak areas are normalized to unit sample mass.
The mass loss during torrefaction is also taken into account.)
Fig. 5. Relative peak areas of furfural (Peak #7), 4-hydroxy-5,6-dihydro-(2H)-pyran-2-one (Peak #13), and levoglucosan (Peak #35) evolved from untreated and torrefied stem wood, stump, and bark samples. (*Relative peak areas are normalized to unit sample mass. The mass loss during torrefactionis also taken into account.)
Fig. 6. Relative peak areas of phenol (Peak #15), guaiacol (Peak #16), and coniferaldehyde (Peak #40) evolved from untreated and torrefied stem wood, stump, and bark samples. (*Relative peak areas are normalized to unit sample mass. The mass loss during torrefaction is also taken into account.)
Fig. 7. (a) Score plot and (b) loadings plot of principal component analysis based on MS ion intensity data obtained from Py-GC/MS measurements of untreated and torrefied stem wood, stump and bark samples. Numbers refer to the decomposition products listed in Table 1.