Fernando Martins−
Roberto Sabbatini
How are firms’ wages
and prices linked: survey evidence in Europe
MNB OccASiONAL PAPERS 102.
2012
MNB OccASiONAL PAPERS 102.
2012
Fernando Martins−
Roberto Sabbatini
How are firms’ wages
and prices linked: survey evidence in Europe
This paper contains research conducted within the Wage Dynamics Network (WDN). The WDN is a research network consisting of economists from the European Central Bank (ECB) and the national central banks (NCBs) of the EU countries. The WDN aims at studying in depth the features and sources of wage and labour cost dynamics and their implications for monetary policy. The specific objectives of the network are: i) identifying the sources and features of wage and labour cost dynamics that are most relevant for monetary policy and ii) clarifying the relationship between wages, labour costs and prices both at the firm and macroeconomic level. The Hungarian research projects conducted within the WDN are published either in the MNB Working Papers series or as MNB Occasional Papers. Some of the studies are also available as ECB Working Paper.
Published by the Magyar Nemzeti Bank Publisher in charge: dr. András Simon Szabadság tér 8−9., H−1850 Budapest www.mnb.hu
ISSN 1585-5678 (online) Occasional Papers 102.
How are firms’ wages and prices linked: survey evidence in Europe*
(Hogyan függ össze a vállalatok árképzése és bérezése? Eredmények egy európai felmérésből)
Written by**: Martine Druant, Silvia Fabiani, Gábor Kézdi, Ana Lamo, Fernando Martins, Roberto Sabbatini
Budapest, July 2012
* This paper has been prepared in the context of the Eurosystem Wage Dynamic Network (WDN) research project. We are very grateful to Giuseppe Bertola, Alan Blinder, Alan Krueger, Juan F. Jimeno, Hervé le Bihan, Julian Messina, Paolo Sestito, Frank Smets and seminar participants at the Bank of Spain and at the 2009 AEA meeting for their useful comments and suggestions. We also thank all members of the WDN survey group for their fruitful cooperation and to Rebekka Christopoulou for her remarkable data assistance. The opinions expressed in the papers are those of the authors and do not necessarily reflect the views of the institutions they belong to.
** Affiliation: National Bank of Belgium (Martine Druant), Bank of Italy (Silvia Fabiani and Roberto Sabbatini), Central European University and Magyar Nemzeti Bank (Gábor Kézdi), European Central Bank (Ana Lamo), Bank of Portugal and Universidade Lusíada of Lisbon (Fernando Martins).
Corresponding author: silvia.fabiani@bancaditalia.it.
Published by the Magyar Nemzeti Bank Publisher in charge: dr. András Simon Szabadság tér 8−9., H−1850 Budapest www.mnb.hu
ISSN 1585-5678 (online)
Abstract
5introduction
61 Data and sample
82 Price and wage adjustment: frequency, timing and interaction
102.1 How often are prices and wages adjusted? 10
2.2 The timing of adjustment 14
2.3 The interaction between wage and price adjustment 17
3 A firm level analysis of price and wage policies in a multivariate framework
213.1 Ordered probit estimation 22
3.2 Disentangling the simultaneous relationship of price and wage rigidity 26
conclusions
29Appendix 1 − The survey
31Appendix 2 − The WDN survey questionnaire
34Appendix 3 − computing expected durations
41Appendix 4 − The frequency of price and wage changes: marginal effects
44References
46This paper presents new evidence on the patterns of price and wage adjustment in European firms and on the extent of nominal rigidities. It uses a unique dataset collected through a firm-level survey conducted in a broad range of countries and covering various sectors. Several conclusions are drawn from this evidence. Firms adjust wages less frequently than prices: the former tend to remain unchanged for about 15 months on average, the latter for around 10 months. The degree of price rigidity varies substantially across sectors and depends strongly on economic features, such as the intensity of competition, the exposure to foreign markets and the share of labour costs in total cost. Instead, country specificities, mostly related to the labour market institutional setting, are more relevant in characterising the pattern of wage adjustment. The latter exhibits also a substantial degree of time-dependence, as firms tend to concentrate wage changes in a specific month, mostly January in the majority of countries. Wage and price changes feed into each other at the micro level and there is a relationship between wage and price rigidity.
Keywords: survey, wage rigidity, price rigidity, indexation, institutions, time dependent.
JEL: D21, E30, J31.
A tanulmány az európai vállalatok ár- és béralkalmazkodási gyakorlatáról, valamint a nominális merevségek mértékéről ismertet új tényeket. A tanulmány egyedi adatbázist használ, amely egy számos országban lekérdezett és különböző ter- melési szektort lefedő vállalati kérdőíven alapul. Az adatok alapján több következtetés is levonható. A vállalatok ritkábban változtatnak béreiken, mint áraikon: az előbbiek átlagosan 15 hónapig, míg az utóbbiak körülbelül 10 hónapig maradnak változatlanok. Az árak merevségének mértéke jelentősen eltér a szektorok között, és nagyban függ olyan közgazdasági tényezőktől, mint a verseny erőssége, a külföldi piacoknak való kitettség, valamint a munkaerő költségének teljes költsé- gen belüli hányada. Ezzel szemben a bérek alkalmazkodási mechanizmusa országfüggő, és főként a munkapiaci intézmé- nyek befolyásolják. A bérmeghatározásra szintén jellemző a dátumhoz kötöttség, mivel a vállalatok zömmel egy adott hónapban változtatják béreiket, az országok többségében januárban. Az ár- és bérváltozások kölcsönösen hatnak egymás- ra mikro szinten, és az ár- és bérmerevségek között is kapcsolat van.
Összefoglaló
This paper studies the frequency, timing and interaction of wage and price changes across firms, covering several economic sectors and a broad range of European countries. It provides new micro-founded evidence for models of wage and price staggering that have become very popular in New Keynesian DSGE models. The important role of labour markets in generating price rigidity in structural models is discussed for instance in Altissimo et al. (2006). By incorporating real wage rigidities, i.e. the slow adjustment of real wages to underlying market conditions, in the framework of a New Keynesian Philips Curve, these models seem to fit better the data. Approaching the analysis of price and wage dynamics simultaneously can also shed light on the impact of recent changes in labour market institutions on wage and labour cost dynamics. For example, it can provide useful insights on the sources behind the substantial degree of wage moderation observed in a number of European countries, which in turn could be potentially useful in terms of implications for monetary policy and structural reform.
This paper uses a new and unique cross-country dataset − unprecedented by international standards in terms of both geographical and sectoral coverage − based on an ad-hoc survey on wage and pricing policies at the firm level. The survey was developed within the Wage Dynamics Network (WDN), a research network grouping 23 central banks in the EU and coordinated by the European Central Bank. It was carried out by 17 national central banks (12 of which belonging to the euro area and 5 new EU member states) between the end of 2007 and the first half of 2008, on the basis of a harmonised questionnaire that aimed at uncovering specific features of firm’s price and wage setting policies and their relationships.
Overall, more than 17,000 firms were interviewed, belonging to different size classes and operating in different sectors of the economy. The uniqueness of this survey is at least twofold. First, its country coverage: given the large heterogeneity of labour markets across European countries, the harmonised questionnaire allows to widen our understanding of the effects of different labour market institutions and policies in price and wage setting practices. Second, the scope and richness of the information collected. In addition to collecting information on both price and wage setting and adjustments, the survey collects information on firm’s characteristics such as the sector of activity, its size, the structure of the product market in which it operates, the intensity of competitive pressures on this market, the structure of its labour force and institutional features potentially affecting its wage and labour policies.
The use of surveys to investigate pricing policies was pioneered by the seminal work of Blinder (1991) and Blinder et al.
(1998) and led to similar analyses in other countries as well as in the euro area, in the context of a previous research network grouping central banks of the Eurosystem, the Inflation Persistence Network (IPN; for the results, see Fabiani et al., 2007). The survey on which this paper is based can be regarded as the “natural” follow-up to some of the evidence on price behaviour revealed by the IPN (Altissimo et al., 2006; Fabiani et al., 2007). Indeed one of the most interesting finding of studies based on micro quantitative and survey data (see Álvarez et al., 2006; Dhyne et al., 2007; Vermeulen, et al., 2007; Fabiani et al., 2006) is the substantial heterogeneity in the degree of price stickiness across products and sectors, related among many other factors to the variability of input costs and the cost structure at the firm and sectoral level. This evidence, albeit anecdotic, raises the question of whether the observed dispersion in the frequency of price changes is the result of wage inertial behaviour, placing firms’ wage setting policies at the heart of our research interests.
In the existing literature, surveys focused on wage setting at the firm level are mostly aimed at disentangling the existence and the reasons of downward wage rigidity; seminal works in this field are those by Blinder (1991), Agell and Lundborg (2003), Campbell and Kamlani (1997) and Franz and Pfeiffer (2006). This paper enriches this line of research by exploring other dimensions of wage setting, focusing explicitly on how firms set and adjust prices and wages and on the relationship
between wage and pricing policies and adjustments.1 In particular, it aims at providing answers to the following questions:
(i) How often are prices and base wages changed in Europe? Are adjustments synchronized or not and do they tend to take place in specific months of the year? (ii) Are there significant differences across firms, sectors and countries regarding the frequency and timing of wage and price changes and their relationship? If such differences are indeed present, how do they eventually relate to institutional and structural features such as the nature of wage negotiations, the presence of forms of indexation of wages to prices, the intensity of competitive pressures, the structure of the workforce, or the labour intensity of production as suggested by the IPN results?
The structure of the paper is the following. Section 1 briefly presents the WDN survey and the data collected. Section 2 focuses on descriptive evidence on the frequency and timing of price and wage changes at the firm level, their relationship and the variation across countries and sectors. Section 3 investigates, within a multivariate econometric analysis, the role of various explanatory factors of price and wage changes at the firm level. Section 4 summarizes the main findings.
1 Other studies produced in the context of the WDN investigate different dimensions of the survey. Babecký et al. (2008) focus on nominal and real wage rigidity by examining not only the issue of flexibility in base wages but also alternative margins of labour costs adjustment at the firm level.
Bertola et al. (2008) analyse firms’ dominant adjustment strategies in reaction to unanticipated changes in demand, costs and wages and investigate some possible determinants underlying this choice. Galuscak et al. (2008) deal with the issue of wages of newly hired workers and investigate the relative importance of internal, external and institutional factors in this particular market.
The data used for this paper is a subset of the dataset collected by the WDN survey. It concentrates on 15 countries for which fully harmonised data are available; namely: Austria, Belgium, Czech Republic, Estonia, France, Greece, Hungary, Italy, Ireland, Lithuania, the Netherlands, Poland, Portugal, Slovenia and Spain. Although the national surveys were organized and carried out by each national central bank, the questionnaire and the target population of firms were very similar across countries. A “core questionnaire” was developed in a co-coordinated fashion within the WDN and was adopted by all participant countries with at most minor modifications.2 Country-level micro data were pooled together into a common dataset. It covers firms employing more than 5 employees and operating in manufacturing, construction and services (trade, market services and financial intermediation).3
Sample size, sampling probabilities and non-response patterns vary across countries as well as across sectors and firms’
size within countries. In general, studies based on survey data need to handle this heterogeneity. We adopt employment- adjusted weights, where the weight attached to each firm in the sample refers to how many employees that observation represents in the population.4
Tables 1 and 2 present the sample composition by country, sector and firm size. Table 2 also shows the distribution based on the number of employees represented by the sample. The total number of firms is just below 15,000, representing almost 48 million employees. By design, the sample is relatively balanced across firm size categories, and its sectoral distribution closely follows that of employment.
Table 1
Sample composition by country
country Number of firms %
AT 548 3.67
BE 1,420 9.5
CZ 399 2.67
EE 366 2.45
ES 1,769 11.84
FR 2,011 13.46
GR 401 2.68
HU 1,959 13.11
IE 848 5.68
IT 952 6.37
LT 333 2.23
NL 1,068 7.15
PL 896 6.0
PT 1,320 8.84
SI 650 4.35
Total 14,940 100
2 An exception is Germany, where the data collected are not fully comparable. This explains why Germany is not included in our sample.
3 See Appendix 1 for details on the survey and on national samples and Appendix 2 for the questionnaire. Questions labelled as “non-core” refer to those questions that countries had the option not to include in their national questionnaires.
4 The weights are defined as the sum of all employees in the population in a sampling category (by country, sector, firm size category, perhaps region) divided by the number of observations (firms) in that category. They can also be thought of as the product of three fractions: the intended sampling probability, the response rate, and employees per firm. They add up to total employment in the population the sample represents.
Table 2
Sample composition by sector and size and the employment population represented (a) Number of observations
5-19 20-49 50-199 >200 Total
Number of firms:
Manufacturing 887 1,271 2,267 1,778 6,203
Construction 378 312 337 114 1,141
Trade 1,189 737 793 362 3,081
Market services 1,350 1,060 1,045 726 4,181
Financial services 108 35 78 113 334
Total 3,912 3,415 4,520 3,093 14,940
Employees (thousands):
Manufacturing 2,209 4,202 5,124 7,793 193,28
Construction 832 605 657 341 2,435
Trade 2,928 2,496 1,971 2,405 9,800
Market services 2,545 2,638 3,056 6,797 1,5036
Financial services 162 86 255 531 1034
Total 8,677 10,026 11,063 17,67 47,633
(b) Percentages
5-19 20-49 50-199 >200 Total
Number of firms:
Manufacturing 5.9 8.5 15.2 11.9 41.5
Construction 2.5 2.1 2.3 0.8 7.6
Trade 8.0 4.9 5.3 2.4 20.6
Market services 9.0 7.1 7.0 4.9 28.0
Financial services 0.7 0.2 0.5 0.8 2.2
Total 26.2 22.9 30.3 20.7 100
Employees:
Manufacturing 4.6 8.8 10.8 16.4 40.6
Construction 1.7 1.3 1.4 0.7 5.1
Trade 6.1 5.2 4.1 5.0 20.6
Market services 5.3 5.5 6.4 14.3 31.6
Financial services 0.3 0.2 0.5 1.1 2.2
Total 18.2 21.0 23.2 37.5 100
An advantage of this survey is that firms were directly asked about a number of features referring to the institutional setup within the firm or to the environment where it operates (e.g. the degree of competition or the existence of a policy at the firm level that adjusts wages to inflation). Information on these features is rarely available in administrative and other datasets. On the other hand, the survey suffers from several shortcomings inherent in ad hoc surveys, such as low rates of response and potential misunderstandings in interpreting the questions. Moreover, results may be influenced by the specific economic situation prevailing in each country at that time interviews were carried out (around the end of 2007 and the beginning of 2008).
The adjustment mechanism of prices and wages followed by firms plays a crucial role on the transmission of economic shocks. In particular, the degree of price and wage rigidity determines the speed of adjustment of the economy and the amount of the related costs. A deep understanding of the extent and sources of rigidity is therefore of major importance for assessing the effects of monetary policy and calibrating macroeconomic models for policy analysis.
Despite the relevance of the issue, available empirical evidence, comparable across countries and sectors, on the stickiness of wages is rather scarce. Concerning price adjustment, instead, studies conducted within the IPN revealed a somewhat high degree of stickiness in the euro area, as measured by the frequency of price changes, especially when compared to the United States. This finding was supported consistently by evidence based on both survey data (Fabiani et al., 2007) and quantitative micro consumer and producer price data (Dhyne et al., 2007; Vermeulen et al., 2007). Another important and robust result of these studies was the substantial heterogeneity of the frequency of price changes across products and sectors, which appears to be related, among other factors, to the variability in the cost structure at the firm and sectoral level, in particular in the relative importance of labour costs.5
The information on price and wage adjustment collected by the WDN survey contributes to fill the gap related to the lack of data on wage policies at the firm level and to address the issue of the degree of price and wage stickiness simultaneously.
In the rest of this section we present some descriptive evidence on three different aspects related to this issue: i) the frequency of wage and price changes; ii) the prevailing mechanism of adjustment (time vs. state dependence) and its timing; and iii) the extent to which wage changes feed into price changes and vice versa.
2.1 HOW OFTEN ARE PRicES AND WAGES ADJuSTED?
The frequency of price and wage changes provides a rough measure of the extent of nominal rigidities which are, among other things, an essential ingredient in the calibration of standard DSGE models with staggered adjustment mechanisms that are widely used for monetary policy analysis (see, among others, Woodford, 2003; Gali et al., 2003; Smets and Wouters, 2003).
On this issue, the WDN survey explicitly asked firms about the frequency of price changes for their main product (see Appendix 2, question 31) and of wage changes for their main occupational group (question 9). In the former case, firms could choose between the following range of categories: daily, weekly, monthly, quarterly, twice a year, once a year, less frequently than once a year, other. The frequency of wage adjustment was instead tackled through three separate questions capturing different types of wage changes: those due to factors unrelated to tenure and/or inflation, those due to tenure and those due to inflation. The exact wording of the question in each case is the following: “How frequently is the base wage of an employee belonging to the main occupational group in your firm typically changed?”. Respondents could choose from the options: more than once a year; once a year; once every two years; less frequently than once every two years; never/don’t know.
5 Consumer price data and survey results show that prices are changed least often in the services sector. Producer price data suggest that the frequency of price changes is highest for those products that have not undergone many transformations and, hence, whose costs are closely linked to the typically rather volatile raw material prices. A similar heterogeneity across sectors is found in the United States.
frequency, timing and interaction
In the analysis of the answers concerning price setting, we aggregate the first three options, on the one hand, and the fourth and fifth, on the other, and end up with four categories: daily to monthly, quarterly to half-yearly, yearly and less frequent than yearly. As for wages, we aggregate the third and fourth categories into a single one, which we label as “less frequently than once a year”. In order to simplify the description of results, in the rest of this paper we consider a synthetic measure, defined as the highest frequency of firm-level wage change among the three types described above (due to factors unrelated to tenure and/or inflation, due to tenure; due to inflation).
Tables 3 and 4 show that in general price adjustments are more frequent than wage adjustments. About half of the firms change prices once a year or less frequently; a quarter do it more often, while the remaining ones do not report any particular pattern. Wages are changed less frequently: for 85 percent of firms once a year or less often, only for 12 percent more often.
The disaggregation by sector and country reveals a substantially higher dispersion in the frequency of price adjustment across sectors than across countries, whereas the opposite is true in the case of wage adjustment. Firms in manufacturing and market services adjust prices much less often that those in trade and financial services, while construction is the sector with the highest fraction of firms reporting no regular pattern in price revisions (Table 3).6 As regards wages, the cross- sectoral variation is lower. Wage changes are least frequent in trade and business services, more frequent in manufacturing and most frequent in construction. Even in this latter sector, though, 60 percent of the firms report adjustments at the yearly frequency and only 22 percent at a higher frequency.7
When looking at differences across countries, the top panel of Table 4 shows that the variability in the frequency of price changes is lower than across sectors. Poland, Lithuania, Ireland and the Netherlands are the countries with the highest
6 When interpreting the results concerning financial services, a note of caution regards, on the one hand, the concept of price, which might be difficult to capture for respondents, and, on the other, the fact that in most countries interviews were carried out in a period of exceptional turbulence on international financial markets.
7 A comparable analysis has been done by size classes, as defined in Section 1. Differences in frequencies of price and wage changes by firms’ size turn out to be negligible.
More frequently than
once a year Yearly Less frequently than once
a year Never/don’t know
Total 12.1 59.5 25.6 2.9
Manufacturing 12.3 59.1 26.5 2.1
Construction 21.5 59.9 15.6 3.0
Trade 10.8 58.3 27.3 3.6
Market services 10.9 60.7 24.9 3.5
Financial services 15.6 59.8 23.1 1.5
Standard deviation 4.5 0.9 4.7 0.9
Notes: Figures weighted by employment weights, rescaled excluding non-responses.
Table 3
Frequency of price and wage changes across sectors
(percentages)
PRicES Daily to monthly Quarterly to half
yearly Yearly Less frequently than
once a year No pattern
Total 9.2 15.4 39.2 7.4 28.5
Manufacturing 5.3 16.1 43.4 7.8 27.3
Construction 7.6 20.4 29.5 7.2 35.2
Trade 22.9 20.3 27.4 3.2 26.1
Market services 5.4 10.4 44.3 9.8 29.9
Financial services 14.8 18.4 23.0 5.4 36.7
Standard deviation 7.6 4.1 9.7 2.5 4.7
WAGES (for any reason)
WAGES (for any reason) More frequently
than once a year Yearly Less frequently than once
a year Never/don’t know
Total 12.1 59.5 25.6 2.9
Euro area 11.4 59.5 26.4 2.7
Austria 6.8 84.2 5.9 3.1
Belgium 22.0 64.8 9.8 3.4
France 19.7 74.1 5.2 1.1
Greece 33.9 56.4 9.7 0.0
Ireland 14.6 71.2 9.9 4.3
Italy 4.2 26.9 64.6 4.3
Netherlands 10.8 70.1 17.0 2.1
Portugal 5.9 82.2 8.4 3.5
Slovenia 27.2 65.6 5.9 1.3
Spain 11.9 84.1 2.5 1.5
Non-Euro Area 14.0 59.5 23.2 3.3
Czech Republic 11.5 64.1 23.0 1.4
Estonia 19.9 64.4 10.5 5.2
Hungary 2.6 75.0 12.2 10.2
Lithuania 42.1 44.0 7.5 6.4
Poland 13.6 56.3 28.2 1.9
Standard deviation 11.2 15.4 15.4 2.6
Notes: Figures weighted by employment weights, rescaled excluding non-responses. The split up between frequencies of wage changes has to be interpreted differently for Greece, as the options never/don’t know were not allowed in the Greek questionnaire.
Table 4
Frequency of price and wage changes across countries
(percentages)
PRicES Daily to monthly Quarterly to half
yearly Yearly Less frequently than
once a year No pattern
Total 9.2 15.4 39.2 7.4 28.5
Euro area 9.0 12.9 40.8 5.1 32.1
Austria 11.6 13.2 37.3 4.9 32.9
Belgium 8.5 12.2 43.9 6.1 28.9
France 5.5 14.3 49.3 4.2 26.6
Greece 3.6 18.2 40.8 6.6 30.8
Ireland 14.8 15.4 33.6 6.7 29.1
Italy 8.9 12.9 32.3 6.5 39.3
Netherlands 12.7 16.0 44.4 5.6 21.4
Portugal 7.9 12.2 44.2 2.1 33.6
Slovenia 7.7 17.2 37.5 6.2 26.4
Spain 10.4 7.7 47.3 3.1 31.2
Non-Euro Area 9.9 22.5 35.0 13.6 18.6
Czech Republic 9.7 12.6 36.3 8.5 32.7
Estonia 5.1 18.4 32.5 8.8 34.7
Hungary 6.1 10.3 45.2 8.6 28.0
Lithuania 8.9 27.8 20.4 11.0 30.3
Poland 11.1 27.7 34.2 16.8 10.2
Standard deviation 3.0 5.7 7.5 3.5 6.7
fraction of firms revising prices more than once a year, whereas Hungary, Spain and France are those with the lowest; for the whole euro area, this fraction is 22 percent, about ten percentage points lower than for the non-euro area aggregate.
Substantial cross-country variation is instead observed in the case of wages (bottom panel in Table 4). Lithuanian, Greek and Slovenian firms adjust base wages most frequently, followed by Belgium, France and Estonia, while Hungary, Italy and Portugal are the countries with the lowest fraction of firms changing wages more often than yearly. The modal frequency is one year in all countries except Italy and Lithuania. Despite the large differences across individual countries, the frequency distribution is broadly similar when one compares the euro-area and non-euro area aggregates.
Overall, the higher dispersion in the frequency of price adjustment across sectors than across countries suggests that product market characteristics (e.g. the degree of competition, the exposure to foreign competitive pressures, the cost structure, etc.) are important determinants of firms’ pricing behaviour and potential sources of the degree of price stickiness. Conversely, the strong heterogeneity across countries that emerges with regard to wage change frequencies is a sign that the institutional setting, in particular the bargaining mechanisms, their coverage and their degree of centralisation, may be important forces behind the rigidity of wages. For instance in Italy, though expected inflation is embedded in wage negotiations, the latter are mostly centralised and carried out every two years; hence, firms consistently report very rare infra-annual wage adjustments.
The evidence on the frequency of adjustment discussed so far can also be summarised through an alternative measure of nominal rigidity, i.e. the number of months for which prices and wages remain unchanged (“duration”). The computation of the duration indicator is still based on the answers concerning the frequency of price and wage changes but requires additional specific assumptions. In particular, whereas most of those answers directly translate into durations (e.g. “once a year” translates into a duration of 12 months), a few of them refer to intervals (e.g. “less frequently than once every two years”). In order to impute expected durations in these latter cases, we assume that the underlying distribution of durations is lognormal (with different moments for prices and wages), we estimate the parameters of the distributions from the other answers, and compute the conditional expectations for these categories.
The results on duration should, therefore, be regarded as approximations, as the imputations are based on untestable distributional assumptions (see Appendix 3 for details). The impact of these assumptions on the estimates reported below is, however, quite negligible, as they concern only a minority of answers.8 Another important qualification is that price durations are not computed for around one-fourth of firms that report “no pattern” to the question on the frequency of price changes. A similar omission applies to wage changes, since wage durations are not computed for firms that report
“never/don’t know” to the question on the frequency of wage changes; however, in this case it is much less relevant since it concerns only 3 percent of the firms.
Table 5 shows that wages in European firms remain unchanged, on average, longer than prices (15 months against around 10). The estimate for prices is in line with the evidence emerged from the studies conducted within the IPN, which point to marginally longer durations: 11 months on the basis of survey data and around 13 months on the basis of micro-consumer price data. This slight difference might be related to both the fact that the sample of countries for which data are available is larger in the WDN survey and that the period in time to which data refer is different.
Looking at sectoral differences, our results reveal that prices set by manufacturers and business services firms tend to remain unchanged on average for just less than one year, whereas those set in trade and financial services seem to be more flexible, with durations of 7 and 8 months, respectively. Conversely, average wage durations vary much less across sectors, with a low of 13 months in construction to a high of 15 in trade. No remarkable differences emerge in price durations between euro area and non-euro area countries. In the case of wages, the relatively higher duration recorded for the euro area aggregate is entirely due to Italy, where wages remain unchanged for around 2 years, consistently with the wage bargaining institutional setup (see Du Caju et al., 2008), whereas in all the remaining countries average duration is almost 12 months.
8 The robustness of the results reported below has been assessed by computing duration measures under alternative assumptions concerning the number of months corresponding to the frequency intervals that do not directly translate into a point estimate. These robustness tests are not shown here but are available from the authors upon request.
2.2 THE TiMiNG OF ADJuSTMENT
In addition to the frequency of price and wage adjustment, and partly related to it, another indicator that signals the presence and extent of nominal rigidities is the nature of the adjustment itself. In order to account for the fact that individual firms do not continuously change their prices and wages in response to all the relevant shocks that hit them, in the literature firms’ strategies are modelled either as a time-dependent process, where the timing of the adjustment is exogenously given and does not depend on the state of the economy, or as a state-dependent one. In presence of frequent shocks, the former might lead to stickier prices and wages than the latter, provided that the time frame is quite large and the cost of adjustment is low enough. Hence, which of the two approaches reflects better firms’ actual behaviour has important implications for monetary policy makers.9
In particular, the degree of bunching of wage setting decisions may have an impact on the transmission of monetary policy decisions to the real economy. For instance, Olivei and Tenreyro (2008) show that in Japan, where most firms set their wages between February and May, in what is known as “Shunto”, a monetary policy shock occurring in the first part of the year should produce a smaller impact on real activity, since this is a period of more flexible wages, than a shock occurring later in the year. Olivei and Tenreyro (2007) derive similar results for the U.S. where wage changes concentrate at the turn of the year; they find that monetary policy shocks that take place in the second half of the year have insignificant effects on aggregate activity.
9 According to IPN results, firms’ price setting is characterized by elements of both time and state dependence: on average 34 percent of firms use purely time-dependent rules, whereas around two-thirds adopt a mixed strategy (as in Sheshinski and Weiss, 1977). Most price adjustments occur at the beginning of the year (January) and after the summer period (especially in September).
Table 5
Estimated average duration of price and wage spells
(months)
Prices Wages
Total 9.6 14.9
Manufacturing 10.2 14.9
Construction 9.1 13.3
Trade 6.7 15.3
Market services 10.9 14.9
Financial intermediation 7.7 14.4
Euro area 9.6 15.0
Austria 9.1 12.5
Belgium 9.9 12.6
Spain 9.7 11.9
France 10.1 12.0
Greece 10.2 11.9
Ireland 8.5 12.8
Italy 9.5 20.3
Netherlands 9.1 13.9
Portugal 9.5 12.9
Slovenia 9.6 11.8
Non-Euro area 9.6 14.7
Czech Republic 9.7 14.6
Estonia 10.0 12.7
Hungary 10.7 13.8
Lithuania 8.4 11.4
Poland 9.5 15.4
Notes: Figures weighted by employment weights, rescaled excluding non-responses.
With a view on obtaining more empirical evidence on these issues, in the WDN survey firms were asked to specify whether their wage and price changes take place with no predefined pattern or are concentrated in particular month(s) (see Appendix 2, questions 10 and 32). The results reported in Figure 1 show that time-dependent wage adjustment is significantly more widespread as a rule adopted by firms than time-dependent price adjustment. Indeed, the fraction of firms that typically change wages in specific months is 54 percent, whereas in the case of prices it amounts to 35 percent. Among these firms, there appears to be a considerable degree of synchronisation in the timing of both price and wage change, with significant clustering in January. In the case of wage adjustment, smaller peaks also appear in July and April.
Looking at the sectoral dimension, the variability in the adoption of regular time-dependent rules in price revisions is quite remarkable, consistently with the high dispersion found in the frequency of the revisions themselves. The concentration in particular months is least common in financial services and more widespread in market services (Figure 2); in all sectors January is the month when the largest part of price changes occurs. Conversely, the pattern of concentration of wage
Figure 1
Timing of wage and price changes at the firm level
(percentages of firms reporting to change wages/prices in a particular month)
30 20 10 0 10 20 30
Dec.
Nov.
Oct.
Sep.
Aug.
July June May Apr.
Mar.
Feb.
Jan.
54% of firms change wages in a typical month 35% of firms change prices in a typical month Notes: Figures weighted by employment weights, rescaled excluding non-responses.
Figure 2
Time-dependent price and wage adjustment across sectors
(percentages of firms reporting to change wages/prices in a particular month)
Prices Wages
0 10 20 30 40 50 60
Total Manufacturing Construction Trade Market services Financial services Total Manufacturing Construction Trade Market services Financial services
Notes: Figures weighted by employment weights, rescaled excluding non-responses.
changes is very similar across sectors, although slightly below average in construction and trade. Also in this case, wage adjustments occur mostly in January in all sectors, though July also has some significance in manufacturing and market services and more staggering across different months is detected in financial services. While in all sectors wage changes are generally more time-dependent than price changes, the difference is particularly pronounced in financial intermediation, where only 12 percent of firms follow this type of rule for prices, as against 59 percent for wages.
The finding that time-dependent adjustment mechanisms are more widespread for wages than for prices might be related to the existence of wage indexation mechanisms in some countries, as well as to the presence of institutional arrangements within the firm itself or at the national or sectoral level. Indeed, the cross-country differences in both the incidence of time-dependence and the timing of wage changes are quite remarkable. Lithuania is the country with the lowest fraction of wage changes concentrated in specific months (17 percent); at the other extreme Portugal has the highest fraction (94 percent). This indicator of relative wage rigidity is consistent with the respectively high and low frequency of wage adjustment found in the two countries (see Section 1). More generally, the percentage of firms that adopt time-dependent wage rules exceeds 70 percent in Spain, the Netherlands, France and Greece and is overall much higher for euro area countries (61 percent) than for non-euro area ones (34 percent), possibly in relation to the more widespread diffusion of collective bargaining agreements and indexation clauses in the euro area.
There appears to be a significant geographical variability also in the timing of wage adjustments. Although in all economies the majority of time-dependent wage changes occur in January, other specific months are indicated by relatively large shares of firms: July in Belgium, France and Lithuania; May in Austria; August in Slovenia, April in Ireland and September in Greece. These country-specificities in the time-patterns of wage change are confirmed both by micro wage data available at an infra-annual level and by the analysis of collective agreements carried out in the context of the WDN (see Du Caju et al., 2008), showing that the monthly pattern of wage changes is linked to the timing of wage negotiations.10 Some variation across countries can also be observed in the pervasiveness of time-dependent pricing, albeit less pronounced than in the case of wages (Figure 3). Overall, the fraction of euro area firms that carry out price adjustments with a regular timing is higher than in non-euro area countries as a whole (42 vs 17 percent, respectively). In all economies, most price changes occur in January.
Figure 3
Time-dependent price and wage adjustment across countries
(percentages of firms reporting to change wages/prices in a particular month)
Wages Prices
Total AT BE FR GB IE IT NL PT SI SP CZ EE HU LT PO Euro Area Non-Euro Area Total AT BE FR GB IE IT NL PT SI SP CZ EE HU LT PO Euro Area Non-Euro Area 0
10 20 30 40 50 60 70 80 90 100
Notes: Figures weighted by employment weights, rescaled excluding non-responses.
10 The peak in the frequency of wage change in the beginning of each year emerges also from other studies conducted within the WDN on the basis of micro quantitative data for a number of individual countries (Knell and Stiglbauer, 2008 for Austria; Heckel et al., 2008 for France, Lünnemann and Wintr, 2008 for Luxembourg).
2.3 THE iNTERAcTiON BETWEEN WAGE AND PRicE ADJuSTMENT
Having assessed the degree of rigidity of wages and prices as captured by the frequency and the nature of the adjustment process, we focus explicitly on the interaction between wage and pricing policies at the firm level. In this context we address both the issue of whether firms’ wage and price adjustment are related (and the causal link between the two) and the extent to which they actually feed into each other.
The WDN survey provides direct information on various aspects of this relationship, such as the link between price and wage changes at the firm level, the response of the former to wage shocks, the existence and nature of internal policies adjusting wages to inflation and the frequency of wage changes due to inflation.
One of the findings stemming from the analysis in Section 2.2 is that there appears to be some broad synchronisation between the timing of price and wage changes, with peaks in January in both cases. Indeed, when looking at individual firms, it turns out that around half of those that change prices in January also adjust wages in the same month. This evidence is confirmed by the fact that, when explicitly asked about how the timing of price changes relates to that of wage changes within their company (see Appendix 2, question 33), around 40 percent of firms acknowledge the existence of some relationship between the two (Figure 4). However, only 15 percent state that this relationship is relatively strong.
For half of them decisions on price changes follow those on wage changes. The opposite holds for another 3 percent, while decisions are simultaneous in the remaining 4 percent. The patterns with respect to intensity and direction of the relationship are very similar across sectors and across countries.
Figure 4
The relationship between wage and price changes at the firm level
(percentages)
0 10 20 30 40 50 60
No link Link but no particular pattern
Decisions are taken simultaneously
Price changes follow wage
changes
Wage changes follow price
change Notes: Figures weighted by employment weights, rescaled excluding non-responses.
The finding that the majority of firms (60 percent) does not explicitly recognise a direct relationship between their
“typical” price and wage change decisions does not automatically imply that the two policies are not related. Indeed, other pieces of evidence arising from the WDN survey suggest that wages and prices feed into each other at the micro level.
The existence and extent of the pass-through of wages into prices can be gauged by analysing the strategies firms declare to implement in reaction to shocks. Indeed, when asked to assess the relevance of different adjustments policies to a common permanent unexpected increase in wages about 60 percent of firms reported that they would increase prices (see Table 6 and ECB, 2009). The possible options they could choose among where: i) a reduction in (other) costs; ii) an adjustment of prices; iii) a reduction of profit margins; iv) a reduction in output.
In a study also based on the WDN survey, Bertola et al. (2008) argue that the pass-through of wages into prices is particularly strong in firms with a high labour share, confirming previous evidence from the IPN that prices are stickier in sectors typically characterised by a high incidence of labour costs. Conversely, the extent to which wages feed into prices is
inversely related to the intensity of competitive pressures faced by the firms, their exposure to foreign markets and their size.11 Additional empirical evidence, based on alternative data and methods, of wage changes having a substantial impact on price dynamics at the firm level is rather limited. Studies carried out in the context of the WDN, focused on national micro data, find in general a significant but very low elasticity of prices to wages or labour costs (see Loupias and Sevestre, 2008; Rosolia and Venditti, 2008; Carlsson and Nordstrom Skans, 2008).
Table 6
Adjustment strategies to shocks
(firms answering “relevant” or “very relevant”, percentages)
cost-push shock Wage shock Demand shock
Reduce (other) costs 67.6 59.0 78.0
Adjust prices 65.6 59.2 50.5
Reduce margins 53.5 49.8 56.6
Reduce output 21.4 22.5 49.9
Notes: Figures weighted by employment weights, rescaled excluding non-responses. Greece is excluded from all the calculations and in addition Italy and Spain are excluded in the case of a demand shock.
Turning to the evidence concerning the impact of prices on wages, an important element is the extent and speed to which wage changes in the firms are related to the general inflationary outlook. The existence and strength of this relationship is determined both by companies internal strategies adapting wages to inflation and by the characteristics of the national institutional settings, in particular the presence or not of indexation rules. The nature of these mechanisms − specific to the firm or set at the national level, formal or informal, forward or backward looking − is, hence, of extreme relevance from a policy perspective. Two questions on this issue were included in the survey (see Appendix 2, questions 6 and 7).
Firms were first asked whether or not they have an internal policy that adapts changes in base wages to inflation. If so, they had to report whether the adjustment (a) is automatic or not, (b) is subject to a formal rule, (c) refers to past or expected inflation (“backward” or “forward” looking).
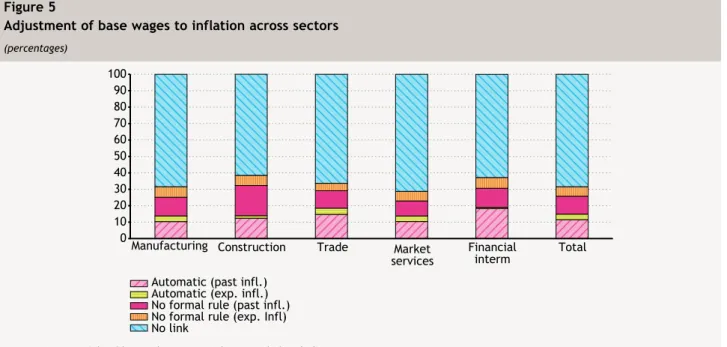
Figure 5 shows that on average only one-third of the firms have an internal policy adapting wages to inflation. Among them, nearly half adopt an automatic indexation mechanism, mostly of a backward looking nature, while the other half takes inflation into account without applying any formal rule. There is some variability across sectors: the existence of an internal indexation policy is less common in market services and more widespread in financial intermediation and construction.
11 All these results are confirmed by the multivariate regression analysis reported in Section 3.
Figure 5
Adjustment of base wages to inflation across sectors
(percentages)
0 10 20 30 40 50 60 70 80 90 100
Manufacturing Construction Trade Market
services Financial Total interm
Automatic (past infl.) Automatic (exp. infl.) No formal rule (past infl.) No formal rule (exp. Infl) No link
Notes: Figures weighted by employment weights, rescaled excluding non-responses.
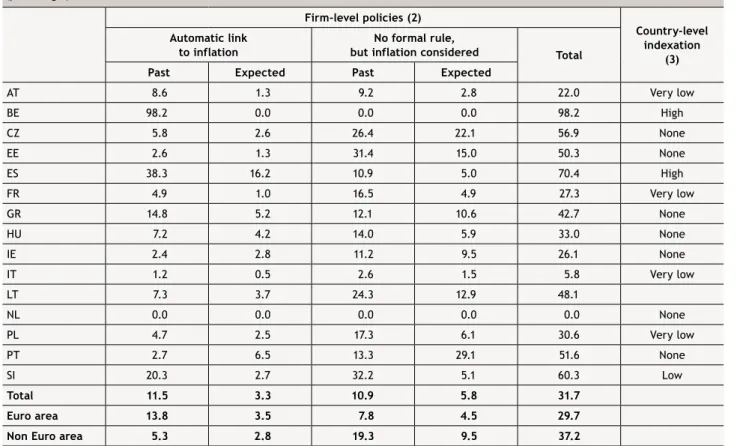
Table 7 summarises the information on formal and informal indexation mechanisms at the firm level across countries. It shows that the adjustment of wages to inflation is very common in Belgium and Spain (98 and 70 percent, respectively), where automatic indexation mechanisms are prevalent. Dutch and Italian firms, on the other hand, do not (or do it only marginally) adapt wages to inflation. In the remaining countries these internal mechanisms, mostly informal, are used to some extent. Expected inflation is more relevant for wage setting than past inflation only in Portugal.12 Overall, informal policies that link base wages to inflation are more widespread in non-euro area countries than in euro area ones, while the opposite holds in the case of formal automatic adjustment mechanisms.
The firm-level evidence reported so far complements information available from other sources on indexation at the country and sectoral level. The dataset on wage bargaining institutions collected within the WDN (see Du Caju et al., 2008) provides an overview of existence and coverage of formal wage indexation mechanisms across countries, developing a summary indicator of country-level indexation. According to this measure, reported in the last column of Table 7, workers are to some extent covered by formal wage indexation clauses in only seven of the countries examined here, coverage being particularly high in Belgium and Spain, low in Slovenia and very low in Austria, France, Italy and Poland.
Table 7
Adjustment of base wages to inflation: country overview (1)
(percentages)
Firm-level policies (2)
country-level indexation
(3) Automatic link
to inflation
No formal rule,
but inflation considered Total
Past Expected Past Expected
AT 8.6 1.3 9.2 2.8 22.0 Very low
BE 98.2 0.0 0.0 0.0 98.2 High
CZ 5.8 2.6 26.4 22.1 56.9 None
EE 2.6 1.3 31.4 15.0 50.3 None
ES 38.3 16.2 10.9 5.0 70.4 High
FR 4.9 1.0 16.5 4.9 27.3 Very low
GR 14.8 5.2 12.1 10.6 42.7 None
HU 7.2 4.2 14.0 5.9 33.0 None
IE 2.4 2.8 11.2 9.5 26.1 None
IT 1.2 0.5 2.6 1.5 5.8 Very low
LT 7.3 3.7 24.3 12.9 48.1
NL 0.0 0.0 0.0 0.0 0.0 None
PL 4.7 2.5 17.3 6.1 30.6 Very low
PT 2.7 6.5 13.3 29.1 51.6 None
SI 20.3 2.7 32.2 5.1 60.3 Low
Total 11.5 3.3 10.9 5.8 31.7
Euro area 13.8 3.5 7.8 4.5 29.7
Non Euro area 5.3 2.8 19.3 9.5 37.2
Notes: (1) Since some firms use a number of different methods of adjustment to inflation, the total may not be equal to the sum of the four methods.
(2) Figures weighted by employment weights, rescaled excluding non-responses. (3) Percentage of workers covered by wage indexations clauses: Very low: 1-25%; Low: 26-50%; Moderate: 51-75%; High: 76-100% (Source: Du Caju et al., 2008).
Overall, information obtained from the WDN firm-level survey and the analysis of national wage bargaining systems suggest that, though formal or institutional indexation mechanisms are not a common feature across Europe, price developments are an important factor entering firms’ wage policies in many countries. Indeed, in the Czech Republic, Estonia, Greece, Hungary, Ireland and Portugal, inflation is taken into account by a significant fraction of firms without relying on automatic or formal rules.
12 In the case of Germany, firms were not explicitly asked whether or not they have a policy that adapts changes in base wages to inflation. Nevertheless, when asked about the two main factors that determined the most recent wage increases, 27 percent of German firms replies that inflation was one of them.
A final piece of evidence provided by the WDN survey on how inflation developments affect firms’ wage decisions concerns the frequency of wage adjustments due to inflation. Figure 6 shows that inflation stands out as the prevalent factor triggering frequent wage adjustment (at an annual or infra-annual frequency). Sectoral heterogeneity is quite limited in contrast with the variability across countries which is, instead, remarkably large (Figure 7):13 while in Austria, Belgium and Spain over 80 percent of firms change wages annually or more frequently due to inflation, in Italy only 15 percent do that (60 percent report that they never adopt this policy).14
13 The Netherlands was not considered as Dutch firms do not adapt wages to inflation.
14 Data for Greece here have a slightly different interpretation, as the option “never/don’t know” was not allowed in the Greek questionnaire, the percentages are within the firms that actually change wages due to inflation.
Figure 6
Frequency of wage changes
(percentages)
0 10 20 30 40 50 60 70 80 90 100
For any reason Apart from
tenure or inflation Due to tenure Due to inflation More frequently than once a year
Yearly
Less frequently than once a year Never/don’t know
Notes: Figures weighted by employment weights, rescaled excluding non-responses.
Figure 7
Frequency of wage changes due to inflation across countries
(percentages)
0 10 20 30 40 50 60 70 80 90 100
More frequently than once a year
AT BE CZ EE ES FR GR HU IE IT LT PL PT SI Total EA
Yearly
Less frequently than once a year Never/don’t know
Notes: Figures weighted by employment weights, rescaled excluding non-responses.
In this section we investigate, within a multivariate framework, the potential factors that may lie behind the frequency of price and wage changes at the firm level. We account for differences that could be country, sector or firm size specific and focus on the features that could potentially affect firms’ strategies. Some of them reflect the institutional setup, like the degree of wage indexation and the nature and coverage of collective bargaining, both at the firm and the country level. Other differences are related to the economic and technological environment, such as the degree of product market competition, the firms’ exposure in terms of external trade, labour intensity and the characteristics and composition of the labour force (share of white collars, of high skill workers, of permanent jobs, etc.). The factors considered in this analysis are described below.
Intensity of product market competition. Whereas in the theoretical literature the relationship between market power and price stickiness is not clear-cut, there is an ample number of studies providing empirical evidence on the issue.
Carlton (1986) and Hall et al. (2000) find that more competitive firms tend to adjust prices faster that firms facing less elastic demand. Geroski (1992) shows that price reaction to shocks is faster in more competitive industries. Álvarez and Hernando (2007) analyze the relationship between price flexibility and competition, focusing on euro area manufacturing and services industries. They conclude inter alia that price setting strategies of the most competitive firms give them greater room of manoeuvre to react to shocks.
From an empirical viewpoint, measuring the degree of competition and in particular disentangling a situation of perfect competition and price taking agents from one of imperfect competition is not straightforward. This difficulty is even more pronounced in the context of survey data, where only qualitative information at the firm level is available, whereas the typical measures adopted in the literature rely on quantitative sectoral indicators or, at the micro level, on measures such as the number of competitors or the firm’s market share. The information provided by the WDN survey allows constructing a number of proxies for the intensity of competitive pressures faced by the firms. The first is the relevance of competitors’
pricing strategies; firms are asked (Appendix 2; question 30) to report the likelihood that a price reduction by competitors leads to a similar reaction by them. The second measure is based on the firms’ own assessment of the intensity of competition in their reference market (question 29).15 Since this indicator, which would be the preferred candidate to be used in our empirical analysis, is not available for 4 countries, we have to rely primarily on the first proxy. However, we will show below that our results are robust to the choice of the competition measure.
Finally, as a large number of the firms included in the WDN survey operate on foreign markets, to capture the specific competitive pressures faced by them, we construct an indicator of the firm’s international exposure, proxied by the share of exports on total sales (question 27).
Share of labour costs in total costs − Evidence arising from studies carried out in the context of the IPN, based both on survey firm-level information and on quantitative producer prices micro data (see Fabiani et al., 2007, and Vermeulen et al., 2007) suggests a negative relationship between the incidence of labour on total costs and the frequency of price adjustment. The WDN survey allows addressing this potential relationship by directly asking firms the fraction of their total costs due to labour (question 40).
15 Based on the IPN results, questions on these more standard measures (number of competitors and the market share) were not included in the WDN survey, to reduce the burden on the firms. Indeed, in the survey studies conducted within the IPN the indicator based on firms’ reaction to competitors’ pricing strategies, proved to be highly correlated with the standard measures (see Fabiani et al., 2007).