PhD Thesis
Colour Perception Related Aspects of Self-Luminous Displays
Gábor Kutas
Supervisors: Peter Bodrogi, János Schanda
Information Science and Technology PhD School University of Pannonia
Veszprém
2009
COLOUR PERCEPTION RELATED ASPECTS OF SELF-LUMINOUS DISPLAYS (KÉPMEGJELENÍTŐ ESZKÖZÖK SZÍNÉSZLELÉSSEL KAPCSOLATOS KÉRDÉSEI)
Írta:
Kutas Gábor
Készült a Pannon Egyetem Informatikai Tudományok Doktori Iskolája keretében Témavezetők: Dr. Bodrogi Péter, Prof. Dr. Schanda János
Elfogadásra javaslom igen / nem
………
(aláírás) A jelölt a doktori szigorlaton 100 % -ot ért el,
Az értekezést bírálóként elfogadásra javaslom:
Bíráló neve: Prof. dr. Endrédy Ildikó igen / nem
………
(aláírás) Bíráló neve: Dr. Michael R. Pointer igen / nem
………
(aláírás)
A jelölt az értekezés nyilvános vitáján ………%-ot ért el.
Veszprém, ………
a Bíráló Bizottság elnöke A doktori (PhD) oklevél minősítése…...
………
Az EDT elnöke
Table of Contents
KIVONAT... 5
ABSTRACT... 6
ZUSAMMENFASSUNG... 7
PREFACE... 8
CHAPTER I ... 10
1. Introduction ... 10
1.1. From the Retina to Colour Perception... 11
1.2. Stages of Colour Perception... 12
1.3. Quantifying Colour – Towards the System of Colorimetry ... 13
1.4. Appearance of Colours... 16
1.5. The Colour Size Effect Revisited... 17
1.5.1. Small Field Phenomena... 17
1.5.2. Medium Field Investigations... 17
1.5.3. Large Field Effects... 18
1.5.4. Peripheral Colour Vision... 19
1.5.5. Recent Research... 19
1.6. Novelty of the Present Work... 21
1.6.1. Questions to Be Answered ... 22
2. Experiment I ... 26
2.1. Experimental Set-up... 26
2.1.1. Stimuli and Viewing Conditions ... 26
2.1.2. Procedure ... 30
2.1.3. Subjects ... 31
2.2. Results and Discussion... 31
2.2.1. A Mathematical Model Fitted To Present Dataset ... 36
3. Experiment II... 42
3.1. Experimental Set-up... 43
3.1.1. Stimuli and Viewing Conditions ... 43
3.1.2. Procedure ... 46
3.1.3. Subjects ... 47
3.2. Results and Discussion... 47
3.2.1. An Advanced Mathematical Model Fitted ... 52
4. General Discussion ... 56
4.1. The Immersive Colour Stimulus – Related or Unrelated? ... 57
4.2. Why CIELAB Space? ... 61
4.3. Hunt Model Calculations ... 62
4.4. Immersive Colours – Complex Stimuli... 66
4.5. Further Thoughts, Limits and Constraints of the CIELAB Model Presented ... 66
CHAPTER II... 70
1. Introduction ... 70
1.1. Pixels, Sub-pixels... 70
1.2. Raster vs. Vector Computer Graphics... 72
1.3. Sub-pixel Rendering – the Colour Fringe Error ... 74
1.4. Wide Gamut Displays ... 76
1.5. Recent Three-primary Sub-pixel Architectures and Rendering Methods ... 78
2. Principles for the Design of Sub-pixel Arrangements ... 79
2.1. Minimal Colour Fringe Error ... 79
2.2. Modulation Transfer Function ... 79
2.3. Isotropy ... 80
2.4. Luminance Resolution ... 80
2.5. High Aperture Ratio... 81
3. Novel Architectures ... 82
4. Colour Image Rendering Method for the Multi-Primary Arrangements ... 88
5. Chapter Summary ... 91
SUMMARY... 93
THESES... 94
TÉZISEK... 96
ACKNOWLEDGEMENTS... 98
REFERENCES... 99
K IVONAT
Képmegjelenít ő eszközök színészleléssel kapcsolatos kérdései
A disszertációban a szerző a modern képmegjelenítő eszközöket érintően a színtudomány és az informatika közös területein mutat be eredményeket. Egyfelől az irodalomból színi mérethatásként ismert jelenség egy speciális esetét vizsgálja, mikor egy homogén önvilágító felület színingere teljes mértékben kitölti a megfigyelő látómezejét. A színingert egy nagyképernyős plazma képmegjelenítő segítségével állítja elő. Megmutatja, hogy bár sem a CIE szabványos színingermérő észlelői, sem a színterek, színmegjelenési modellek, és ezek irodalomban található – a színinger méretén alapuló – kiterjesztései nincsenek ellátva a jelenség előrejelzésének képességével, a teljes belemerülés jól leírható eltolódásokat okoz a színészlelésben. Tanulmányozza a színi adaptáció és a háttér fénysűrűségi szintjének a jelenségre vett hatását, és végül bemutatásra kerül egy, a teljes belemerüléssel vizsgált színinger színészleletével ekvivalens színészleletű, színmegjelenés tekintetében jól definiálható környezetben értelmezett színingert megadó modell is. A dolgozat ezen túlmenően foglalkozik a lapos képmegjelenítők színkészletének – több mint három alapszíninger bevezetésével történő – kibővítésére irányuló igényekkel. Olyan tervezési elveket, és új lehetséges struktúrákat mutat be, melyek szakítanak a hagyományosan az azonos alapszíningereket sávosan egymás mellé rendező formációval, továbbra is fenntartva az alpixeles képalkotás lehetőségét egy olyan alpixeles képalkotó algoritmussal, mely a színinger-metrikát és az emberi vizuális rendszer működési sajátosságait figyelembe véve csökkenti az ekkor jelentkező úgynevezett színes rojtozódási hibát (colour fringe error).
A BSTRACT
Colour Perception Related Aspects of Self-Luminous Displays
In the dissertation results connected to the investigation of modern display devices are shown in the common fields of colour science and information technology. On the one hand, a special case of the known colour vision phenomena called colour size effect (colour perception changes due to the stimulus size) is investigated, where a single homogenous colour stimulus totally fills in the observer’s visual field. This is obtained by being exposed to an immersive self-luminous stimulus provided by a large plasma display panel. It is shown that, though, neither recent colorimetric observers, colour spaces, colour appearance models, nor their size dependent extensions found in literature are invested with predicting the immersive colour phenomenon, it yields well-describable shifts in the perception of colours. The effect of chromatic adaptation and background luminance is also studied, and finally a colour perception prediction model is outlined, introducing an equivalent colour to the colour appearance of the immersive scene in a well-defined situation of colour appearance. On the other hand, there is a demand that these new flat displays be capable of exhibiting an advanced set of colours with multi-primary philosophy, i.e. employing more than three primary colours to additively mix colour stimuli. Design principles and possible novel formations of the pixels and sub-pixels are shown that condemn the neighbouring-same-primary sub-pixel arrangement, maintaining the possibility for sub-pixel rendering, involving a novel approach to sub-pixel rendering algorithms based on colorimetry and the properties of the human visual system, thus decreasing the so called colour fringe error.
Z USAMMENFASSUNG
Farbwahrnehmungsbezogene Aspekte selbstleuchtender Bildschirme
In der Dissertation werden Ergebnisse in Zusammenhang mit der Untersuchung moderner Bildschirme behandelt, die auf dem gemeinsamen Feld der Farbenwissenschaft und Informationstechnologie erreicht wurden. Einerseits wird ein von der Literatur als Farbgrößenwirkung bekanntes spezielles Phänomen untersucht, wo die homogenen Farbreize des Selbstleuchters das Gesichtsfeld des Beobachters in vollem Maße ausfüllen. Die Farbreize werden mit einem großen Plasmabildschirm dargestellt. Es wird gezeigt, dass, obwohl weder die Farbmesstechnische Normalbeobachter von CIE, noch die Farbräume, Farberscheinungsmodelle oder deren, in der Literatur befindliche, von der Größe des Farbreizes abhängenden Erweiterungen, mit der Prognostizierfähigkeit der Erscheinung ausgestattet sind, das volle Eintauchen gut beschreibbare Verschiebungen in der Farbwahrnehmung verursacht. Es wird die auf die Erscheinung ausgeübte Wirkung der Farbadaptation und der Leuchtdichtenstufen des Hintergrundes untersucht, und zum Schluss wird ein Modell eingeführt, das mit Rücksicht auf die Farberscheinung einen, in einer genau definierten Umgebung interpretierbaren, Farbreiz angibt, dessen Farbwahrnehmung mit der Farbwahrnehmung des bei vollem Eintauchen untersuchten Farbreizes äquivalent ist. Neben den vorhergehenden werden Anforderungen für die Erweiterung des Farbbestandes von Flachbildschirmen mit mehr als drei Primärvalenzen behandelt. Es werden solche Entwurfsprinzipen und neue mögliche Strukturen vorgestellt, die mit der Formation brechen, bei der die Primärvalenzen traditionell wie Streifen nebeneinander geordnet werden. So kann die Möglichkeit der Bilddarstellung mit Subpixeln durch einen solchen Algorithmus beibehalten werden, der mit Rücksicht auf Farbmetrik und Wirkungseigenheiten des menschlichen visuellen Systems den so genannten Farbfransenfehler (colour fringe error) reduziert, der bei solchen Bedingungen auftritt.
P REFACE
On modern display devices
The history of electronic displays or information displays goes back to the end of the 19th century. In 1897 German physicist Karl Ferdinand Braun invented the cathode-ray tube (CRT), which is an evacuated glass envelope containing an electron gun (a source of electrons) and a fluorescent screen, usually with internal means to accelerate and deflect the electrons. When electrons strike the fluorescent material applied to the inner side of the screen, their energy is transformed and light is emitted. The rendering of an image on a CRT by deflecting an electron beam requires the glass envelope be large, deep, therefore heavy, and relatively fragile. Besides the energy consumption, this is one of the important drawbacks of the more than 100-year-old technology. Classically, attributable to its age also, CRT is an analogue system. The development of imaging technologies and the digital world of information display has caused CRTs to be largely displaced recently by flat plasma screens (PDP), liquid crystal displays (LCDs), digital lens projection (DLP), OLED displays, and other technologies without disadvantages addressed above.
The mass production of the modern colour displays started at the end of the past century, although, e.g. the basic reflective liquid crystal technology is already 40 years old.
Standard LCDs employ a static background light source and visualize colour information by filtering the light output of that lamp by the aid of numerous tiny colour filters arranged in a matrix form on the whole surface of the screen. Light intensity at a certain location of the screen depends on the polarization angle of the transited light controlled by the spatial arrangement of the liquid crystal cells, which are capable of rotating it enabling the light to pass through the outer polarizing filter or to be completely blocked by it. Plasma displays and CRTs have one common property, namely, that the colour output we see is the light emission of fluorescent materials. The difference is that fluorescent material for PDPs is
stimulated by ultraviolet radiation emitted by the high-voltage-excited ion stage gas mixture (plasma) while returning into a stable stage. The UV emission is located directly next to the fluorescent material this is the reason why plasma display technology has a negligible depth, i.e. a third dimension. The LCD technology neither requires the overall size of a CRT display assuming an equal effective screen area. The screen of both technologies is completely flat instead of the common spheroid or cylindrical shape CRT screen, therefore the collective noun for the modern display devices: flat panel displays (FPD).
Beside the colorimetric examination of these devices playing upon their technological specialities to advance colour science is also an important question. For entertaining purposes and home cinema applications one basic industrial aim was to increase the size of the screen of the devices far beyond what the possibilities of the CRT technology allows offering a still flat screen. In one hand in colour science it is a known phenomenon that colour perception of the same physical stimulus differs if the size of the colour patch varies. By the aid of these novel devices the study of the colour vision phenomenon size effect, as known in technical literature, became possible even for the yet not investigated scales for self-luminous homogenous patches: up to the visual angle of 100° and beyond.
On the other hand from a different point of view these modern display devices employ a discrete number of elementary screen parts to present visual information called pixels.
Another industrial demand regarding these equipments is to increase their capabilities to reproduce colour, namely, to be able to represent more colour tones the human visual system (HVS) can detect. The claim for an extended size gamut for colour display devices requires increasing the number of basic colours from the common three-stimulus design the displays use to additively mix colour information, too. This points toward spatial arrangement and colour rendering method topics, which are critical when displaying an image built up from lines, typographic fonts, and other graphical objects.
The aim of this thesis is to introduce and connect this macro world (the effects of increased physical size) and micro world (the elementary building blocks) of modern display devices in terms of the latest expectations, achievements, and results of colour science, which, due to their information carrying role, are an organic part of today’s popular and comprehensive field concerning the computerized world: information technology.
C HAPTER I
Colour Appearance of Self-luminous Immersive Scenes
1. Introduction
Colours are present in our everyday life. The visible part of electromagnetic radiation reaching the eye is transformed into brain signals to which the brain forms several perceptual answers including colour perception. The quality of colour perception is not restricted to the spectral composition and the intensity of the radiation. There are several other factors affecting colour perception. Besides the effects of the viewing situation (if it is dark, dim, or average), the surrounding colours (known as contrast phenomena in literature), the structure of the surface of the coloured object (e.g. in certain cultures and archaeological styles to exterior façade paints some grain is added to create a coarse wall finish) or the type of illumination (a separate field in colour science called colour rendering of different types of light sources deals with this topic), the size of the colour stimulus is also of significant importance. Most often, physiological reasons originating from the cone density and cone distribution of the human retina are assigned to this effect, and, depending on the size of the visual field, small field, medium field, and large field phenomena can be distinguished, starting from “minutes of arc” domains up to the complete immersion of the observer in the colour stimulus, yielding a different colour perception from the generally treated as “medium size” colour stimulus of the same spectral composition.
The perceptual changes related to the changing visual angle of the colour stimulus have been known for a long time, and the first reports trace back to the 19th Century. According to the best knowledge of the author, the first reference on the colour size effect in technical literature was published by Maxwell, in 1856, who experienced that the same blue colour exhibited a different colour perception if it was viewed on different areas of the retina.1
1.1. From the Retina to Colour Perception
The primary organ for vision is the eye. Instead of a detailed description of its construction, here, I would like to concentrate on the retina, which or of which connections possibly play an essential role in the phenomenon described in this chapter of the work.
Section 1.1 and the two forthcoming sections (1.3, and 1.4) are mainly based on two excellent books2,3 and one book chapter4 that deal with the fundamentals of colour vision and measurement.
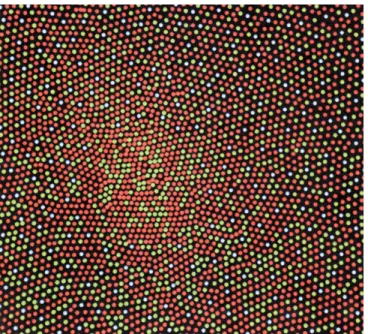
Figure I/1. A schematic representation of the cone distribution of the retina with false colouring (Image reproduced from Ref. 3). Note the lack of blue-denoted S cones in the dense middle part.
The incoming light passes through the cornea and the lens and is projected inverted to the back part of the eye-ball covered by a light sensitive tissue called retina. Though, this tissue envelops the most interior part of the eye-ball it does not provide a very wide field of view due to the diverse sensitivity over its area. Human colour vision is restricted to 80° of visual field and only motion detection and achromatic stimuli perception takes place outside this domain. Approaching to the optical axis of the eye both colour vision and the perception of fine details increase. The most accurate vision is in the fovea comprising the central 1°30’ area of the retina. Within this, there is another dedicated region called foveola. There is a pigmented area around the fovea (about 4°) called the macula lutea (or the yellow spot), which acts as a colour filter. Owing to individual variations in the
pigmentation of this layer, the spectral sensitivity of individual observers differs. From the viewpoint of colorimetry it has a special meaning, which will be dealt with later.
A normal retina includes several layers of neural cells. The processing chain starts with the light sensitive photoreceptors of the tissue – the rods and cones. (Recently a new type of sensor has also been discovered serving for maintaining the biological routine but due to its irrelevance in colour vision a further introduction to it is disregarded.) Rods and cones derive their names after their typical shape, although, it is their functionality that makes the basic difference between them only. Rods work at so called scotopic level (luminance less than 0.001 cd/m2), which is a dark visual situation and cones serve vision under photopic circumstances, which is a typical daylight situation (luminance is larger than 3 cd/m2). The ability of the human visual system to switch between these two mechanisms makes us capable to see under a wide range of light levels.
Spectral sensitivity of rods and cones also differ. Rods have peak sensitivity at approximately 507 nm. There are three types of cone peak spectral sensitivities extended to the whole visible electromagnetic spectrum. They are most commonly referred to as L, M, and S cones after the initials of the wavelength domains they are most typically sensitive in – long (most sensitive at around 570 nm), medium (540 nm), and short (420 nm) wavelengths. Thank to the three different types of cones we see in colour. Since there is only one type of rod this functionality of the HVS is colour-blind.
Apart from the unlike sensitivities the spatial distribution of the photoreceptors are also different in the retina. There are no rods in the fovea. They are mainly located outside the 10° area of the optical axis at the periphery. S cones are relatively sparsely spread throughout the retina compared to either L or M cones and they are completely absent in the foveola. The relative overall ratios of the cones are L:M:S=40:20:1. Figure I/1 gives a schematic representation of the cone distribution of the retina with false colouring.
1.2. Stages of Colour Perception
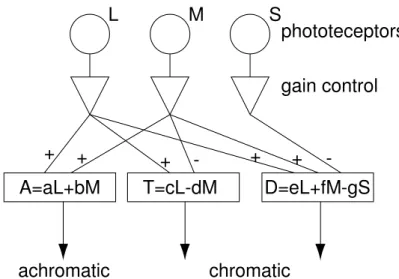
The first step of colour sensation is the photochemical process creating electric signals after absorbing the incoming photons. Without going into a detailed description of the procedure it is only mentioned that there is a physiological evidence that as a second step the signals of the final colour sensation are pre-processed in the level of the retina (layers of the bipolar, amacrine, and ganglion cells) yielding a primary luminance like signal and two colour information signals.5 These three signals – corresponding to the concept of Hering’s opponent colours theory6 – are the basic ones of the modern opponent-colours
theory: one component for the luminance like information (L+M signal), and two for red- green (L-M signal), and yellow-blue (L+M-S signal). A schematic wiring that leads to these responses is given in Figure I/2. The third step towards colour perception is mental processing, which is the least known field among all in colour science. This final level also adds e.g. the colour memory-related (cognitive) segment of colour constancy. Colour constancy is the phenomenon, due to which in certain illumination conditions (daylight or the more yellowish incandescent artificial light) we perceive a white sheet of paper white, regardless to its absolute chromaticity. A physiological answer can be the increased bleaching of cone pigments stimulated more or selective gain control between the different channels. The mental aspect comes into question when well-known objects are under investigation: a banana for instance can be displayed exhibiting even an extraordinary green colour and observers will still see the banana yellow.7 Along this mental processing evolve the perceptual attributes of colours, too. The hue, brightness, and saturation concepts develop. These are the attributes we think when we try to describe, explain or recall a colour stimulus and it is evident that there is no physiological analogy at either level-one or level-two processing.
A=aL+bM T=cL-dM L
achromatic chromatic
gain control phototeceptors
+ + + - + + -
M S
D=eL+fM-gS
Figure I/2. Schematic wiring of the encoding of the cone signals into opponent colour signals.
1.3. Quantifying Colour – Towards the System of Colorimetry
The basis of modern photometry was established in 19248 when the International Commission on Illumination (CIE) standardized the spectral luminous efficiency function,
V(λ), for photopic vision. This function is used as a weighting function to convert radiometric quantities to into photometric ones. V(λ) is not one of the cone responsivities and according to the opponent-colour theory discussed in the previous section it corresponds most closely to the “luminance channel” signal, i.e. to the signal produced by the additive effect of the L and M cone signals. Fixing V(λ) to quantify the luminance of colours was the first step along establishing a system of colorimetry. There is another luminous efficiency function for scotopic vision called V’(λ) but in colorimetry at light levels above levels of “rod intrusion” (light levels, below which rods contribute to the luminance and brightness sensation) their influence can be neglected, and will not be discussed here.
After setting up V(λ) there was a demand to specify a system that meets the requirements of the Grassman’s laws of additive colour mixing and trichromacy to be able to tell if two metameric stimuli match for an average observer in colour. The idea was to determine the quantity of three pre-fixed additive primary colours needed to match a certain stimulus. After the experiments of Wright9 and Guild10 CIE standardized a set of colour matching functions (CMFs) assuming real red, green, and blue monochromatic primaries (RGB). The amounts of these primaries needed to achieve a match are called tristimulus values. For practical reasons (to eliminate negative CMF values and to directly embed V(λ) into the colour system) applying a linear transformation to the primaries in 1931 the CIE 2° standard observer was defined, today known as CIE 1931 colorimetric observer. This system assumes imaginary (not real) primaries (XYZ) but assures that to match any natural colour stimulus, only positive amounts are needed from them. Since the CMF of primary Y is the V(λ) function itself, noted as y(λ), tristimulus value Y means the luminance of the stimulus. As the former name refers to it, the use of the CIE 1931 colorimetric observer requires that the colour samples to be matched be viewed under approximately 2° of visual angle on a medium intensity neutral background.
The presence of the yellow spot around the fovea was already noted previously. Its pigmentation affects corneal level spectral sensitivity of the cones and has an effect on colour perception for visual angles considerably larger than 4°. In 1964, CIE standardized a supplementary set of colour matching functions based on the extensive work of Stiles and Burch11 as well as Speranskaya12 employing a 10° visual field. The system is called CIE 1964 colorimetric observer often referred to as the 10° observer. Since for these visual angles rod vision takes place to relatively high luminance levels,13 below of which the
system is not additive the CIE 1964 colorimetric observer has not been coupled to the photometric system.
The colour of a stimulus can be specified by a triplet of independent measures according to the criteria of the trichromatic matching. This is due to the existence of three different retinal colour sensors, the cones, or to the three antagonistic signals described in Figure I/2. Geometrically this means that colours must be systematized in three dimensions if represented along some logic. This was discovered – however – already much before the above discussed trichromatic system has been introduced. It was first recognized by the Finnish-born astronomer Forsius, in 1611, who constructed a three dimensional representation of colours. The CIE XYZ system is three dimensional, but suffers from the fact that to small colour differences highly different numerical values belong in the red, or green, or blue part of the chromaticity diagram, which is a two-dimensional representation of the colours, obtained by a normalization that eludes luminance. Chromaticity coordinates are denoted by lowercase x, y, z values, where
= + + x X
X Y Z , =
+ + y Y
X Y Z , =
+ + z Z
X Y Z ,
therefore x+ +y z= 1 holds for any colour stimulus. After considerable research on perceptual uniformity of chromaticity, the CIE 1976 Uniform Chromaticity Scales (UCS) diagram was constructed defining u’ and v’ uniform chromaticity coordinates, applying the following transformation to x, y:
4
-2 12 3
= + +
u' x
x y ,
9
-2 12 3
= + +
v' y
x y .
Also, to deal with colour differences the CIE recommended two alternative more equidistant colour spaces in 1976: CIELAB and CIELUV.
Generally, colour order systems and colour spaces have a common property, namely, they arrange colours three-dimensionally according to the logic corresponding to the second and third level of processing introduced already at the end of Section 1.1. One axis represents the relative luminance/lightness correlate of the stimulus (achromatic content) and the other two axes are for the red-green and the yellow-blue component (chromatic content). In the CIE 1976 (L* a* b*) colour space the L*, a*, and b* coordinates construct
a Cartesian space. Achromatic content is represented by the L* value called the CIE 1976 lightness, which is the derivative of relative luminance. Redness-greenness is approximated by a* and yellowness-blueness by b*. The cylindrical representation of the a*-b* plane for CIELAB gives C*ab (chroma) and hab (hue) polar coordinates. Lightness and chroma are relative to the peak white of the visual situation (called the reference white), which is embedded in the model as a quasi chromatic adaptation. The Euclidean distance of two colours in this space is called CIELAB colour difference denoted by ∆E*ab. Colour difference calculations in this dissertation, if not stated otherwise, are based on this metric.
1.4. Appearance of Colours
In any scientific field it is essential to be aware of the precise meaning of the terminology (termicus technicus) contained by the technical vocabulary of the discipline. If one takes the International Lighting Vocabulary14 in her/his hands and seeks the definition of colour,* it will be obvious that accurate knowledge of the terminology of colour science is outstandingly important. So far, there is no implicit definition for colour that does not contain examples.
Everyone knows what colour is, but how can one interpret it has he or she never seen it? How can we define colour? What are the meanings of e.g. warm, pale, clean etc.
colours? To be able to correctly communicate on the topic throughout this work the two most essential concepts must be separated first, namely colour stimulus and colour perception. Colour stimulus is the measurable physical quantity, characterized by the spectral power distribution of the electromagnetic radiation reaching the observer’s eye or the derived tristimulus values. Colour perception is, however, the evolving mental sensation, described by so called colour perception attributes affected by several factors, such as the visual situation (average light level), the chromaticities of the reference white (e.g. incandescent or daylight), the level of chromatic adaptation etc. It is also important to be familiar with the most important terms that should be used when describing the colour perception of a stimulus: unrelated colour, related colour, hue, brightness, lightness, colourfulness, chroma, saturation. Exact definitions of the International Lighting Vocabulary14 are listed in the Appendix of the thesis. The understanding of the difference
* “Attribute of visual perception consisting of any combination of chromatic and achromatic content. This attribute can be described by chromatic colour names such as yellow, orange, brown, red, pink, green, blue purple, etc., or by achromatic colour names such as white, grey, black, etc., and qualified by bright, dim, light, dark, etc., or by combination of such names.”
between related and unrelated colours is essential to realize the basic differences between certain perceptual attributes of colours.
CIE has also a recommended colour appearance model15 called the CIE 2002 colour appearance model or CIECAM02, in which the correlates of the above attributes are quantified for different visual conditions (dark, dim or average). One among the many colour appearance models published to quantify the perceptual attributes of colours, the Hunt model2 (used in a later section), is capable of predicting the absolute appearance of unrelated colours, too.
1.5. The Colour Size Effect Revisited
After briefly introducing the colorimetric basics required to understand what knowledge is beyond when we talk about colour measurements I would like to turn back to the size effect phenomenon how and since when it has appeared in technical literature and what the first observations and statements of the problem were.
1.5.1. Small Field Phenomena
As visual angle becomes excessively small (1'-5'), due to the absence of the S-cones in the foveola (it is often said to be “blue colour blind”), colour stimuli seem to loose some of their colour components16, and, at approximately 1', only intensity perception remains, and the reflected light from a coloured object seems completely achromatic if viewed foveally.
With the regress of visual angle, first, yellow tones tend to appear white, and then, at approximately 3' blue seems to be black. Blue-green and red tones keep their original appearance the furthermost with the reduction of size.17,18 At about 3', colour discrimination ability is in complete accordance with that of observers being diagnosed of colour deficiency (tritanopic dichromacy). As Burnham19 reported, a related fact of foveal tritanopia was first observed by König.20
1.5.2. Medium Field Investigations
Another phenomenon reported in connection with the field size of a colour stimulus was first observed by Hering,21 in 1893 (also reported by Burnham19). When comparing monochromatic yellow light with a mixture of red and green lights, matching was no longer present when the subtended visual angle decreased, as the mixed light appeared to exhibit more red colour. Later, during anomaloscope matchings, these findings were confirmed22-24 and the reverse effect25 was also demonstrated, namely, by increasing the
viewing distance of constant size stimuli, more red component was needed to achieve a match with monochromatic yellow. This effect takes place between 1°-25° of visual angle.
In the same domain of visual angles (1°-25°) possibly the most valuable, yet anecdotic, phenomenon from the viewpoint of this work was first investigated by Marshall and Guilford.26 Their goal was to investigate a common remark of their observers to their simultaneous colour matching experiments of larger paint samples. Their subjects claimed that they experience no difference if the colour of larger samples is assessed employing the standard size mid-grey mask, provided with the Munsell Book of Colour, or discarding the use of it. After conducting the experiments Guilford concluded that only black and white changed in Munsell value as size was varied. But this phenomenon remained an open question because of the inconsistent results. A possible reason of unsuccessfully investigating the chromatic changes of colours of the different sizes may have been the use of colours with the highest chroma at the gamut boundaries of the Munsell Book of Color where there was no choice to detect any shift towards colours of e.g. greater chroma. After these early works, colour size effect findings were generally quantified by the colorimetric terms (chromaticity, excitation purity) as well as perceived colour attributes (hue, lightness, and chroma) but spread in literature really seldom later.
Actually, this is the domain (1°-25°) that contains the critical 4° frontier and where colour measurements should be split according to the CIE recommendations to a ‘small’
and a ‘large field’ region. Note that, in this Section, introducing a comprehensive grouping of the perceptual derivation of colours along the variation of the stimulus size, field size categories do not coincide with the expressions ‘small’ and ‘large’ field domains often used by the CIE referring to the use of the 2° or the 10° colorimetric observers.
1.5.3. Large Field Effects
Perceived properties coloured surfaces of field sizes as large as 22° and 77° were matched with that of a 2° field, and, as the result of modifying the field size, primarily a change in excitation purity was identified.19 Burnham concluded that the change is of greater magnitude if field size is increased to 22° from 2° than to 77° from 22°, and, for certain colours, the experienced excitation purity rise stopped or even a drop was observed. It must be noted that neither chromatic adaptation nor separation of the large stimulus was controlled. These factors may be important if unlimited time exposure is allowed for the observers to the large stimulus, nevertheless, their unimportance for short term durations (up to 8 s) in terms of the size phenomenon will be reflected later in this work. In another
work of the same author the size effect was found to be similar to that of increasing the illumination over the colour samples,27 namely, colours seem brighter and more colourful if their size is enlarged.
1.5.4. Peripheral Colour Vision
When studying the size effect, it is important to review the results achieved in the extensive research of human peripheral vision. If objects are not seen centrally then their projected image on the retina will be off-foveal. It is well-known that the perception of colours at the periphery differs from that in the centre of vision (i.e. in the fovea).28,29 Here, besides of the desaturation of colours, hue shifts also take place with the increase of eccentricity (due to the decreased activity of the L−M channel).30,31 With the increase of the physical size of the stimuli, it is possible to achieve a fovea-like colour perception, up to eccentricities of 20°. However, even the larger stimuli fail to produce fully saturated hues at 40°.32 Also the surround conditions proved to have an effect on the colour perception in the periphery.33 A vital phenomenon regarding the appearance of extra-foveal colours is rod intrusion that is the contribution of the rod photoreceptors in the evolving colour sensation.34-39 The major difference between the colour size effect and peripheral colour appearance is that, though, regarding the size effect, colour stimuli are projected to off-axis retinal regions, too, basically they are observed centrally. In this case an
„integration” of the regionally different perception within the uniform patch may occur – to „finalize” the perceived colour of the patch. Sometimes, the large patch is perceived yet to be inhomogeneous. But, despite the major difference between the two phenomena the contribution of the peripheral parts of the retina for colours viewed immersed suggests that the overall perceptual changes may show some similarities with the peripheral colour vision phenomena.
1.5.5. Recent Research
Concerning the possible physiological reasons causing the colour size effect, some of them were verified (e.g. the absence of S-cones in the foveola) and others were disproved (e.g.
the theory of independent yellow receptors in the retina25) in the past.
Recently, with the advance and the widespread use of new experimental techniques, such as colour matching on computer-controlled colour monitors or the magnitude estimation technique and the new imaging devices, such as calibrated colour displays providing large size self-luminous stimuli, it has been possible to begin a more extensive
research on the colour size effect in terms of more sophisticated and powerful tools in colour science, such as CIELAB and particularly the colour appearance models (CAMs).
Both the small field and the large field effect have been revisited.40-47 As colour is more and more instrumental in transmitting information, colour naming under different illumination levels for small visual fields have also been investigated.48 On the one hand, authors concluded for the case of the small field (smaller than 1°) that the colour of small objects became more and more achromatic with the decrease of size40 and, on the other hand, authors agreed that for larger samples (i.e. larger than 2°), the perceived colour seemed to exhibit more lightness, and, the perceptual correlates related to chromaticness i.e. chroma and saturation also increased.41,43
The revision came basically from the architectural field49 and aimed to find out what hides behind the anecdotic phenomenon that the interior and exterior wall surfaces of houses do not match the expectations after the paintwork – if the paint was previously selected from a swatch collection of the manufacturers. In Anter’s work,49 thousands of outdoor observations of traditional Swedish houses gave a large dataset matching their perception with NCS cards (on the Natural Colour System see e.g. Ref. No. 2). Results showed some consistent variation patterns in the relationship between the inherent colour (the “real” colour matched with directly laying the NCS sample onto the surface of the wall) and the “approximate perceived colour” (viewed from a distance) of painted facades observed under specific conditions such as “full daylight”. The most obvious and pervasive tendency was that the perceived colour of the facade had less blackness than the inherent colour (average difference: 11 NCS units, statistically significant). The perceived colour of yellowish brown, red, yellowish green, and blue facades had more chromaticness than the inherent colour (average difference: 4 NCS units, statistically significant). The perceived colour had more whiteness than the inherent colour (average difference: 7 NCS units, statistically significant) except red. The often significant hue shifts between the perceived colour of the facade and its inherent colour, where also a consistent variation pattern was found, depended much on the kind of the inherent colour. Above findings have been explained by several different factors related to the nature of these outdoor observations.
The illumination of the facades (blue sky, overcast sky, or different phases of daylight, with or without haze) may differ significantly from that of the colour sample (daylight simulator). The level of illumination may be different (e. g. 1000 lx for the sample and 20000 lx for the outdoor facade observation). Chromatic adaptation (or even colour constancy) may be incomplete. The different levels of illumination may cause differences
in perceived colourfulness and hue shifts may come into play (Bezold-Brücke effect). The proximal field and the surround may also be different for the facades (soil, paving, vegetation, and other buildings) and small colour samples (white paper). Though it was not stated explicitly that the differences between the physical size of the colour sample and the façade may be attributed to the perceptual mismatch, it can be assumed that this was a typical practical instance of the size effect of colours in the medium angular domain (viewing distances were 4 m, 50 m, and for longer distances up to 1300 m).
The colour appearance changes of a real room42 and the colour perception of different visual fields43,44 (2°-50°) of surface colours were also investigated and modelled in comparison to standard size samples. Observers assessed the colour appearance of several fully painted rooms using small (2°) matching samples (both reflective and CRT matching) and different size painted fields on walls, too. A correction method based on CIELAB space and later an LMS cone signal based formula44 was suggested embedding the size of the stimulus as a factor and another one for predicting the appearance of the completely painted rooms.42 Mainly lightness and chroma changes were found to significantly alter with size. Hue was usually found to be unchanged. The overall average colour difference between the colorimetric and the perceived colour of the patches reached values up to 18 CIELAB units depending on size and were decreased to around 9 units by the use of the formulae. Indeed, with the increase of the visual angle, both CIELAB and the LMS model performances decreased and the CIELAB model did not converge to the room appearance model at all, which would have been expectable as a transient behaviour. It is susceptible that for larger visual angles the applied experimental techniques employing surface colours to asses their appearance owing to their perceptual complexity may not comprise enough control.
1.6. Novelty of the Present Work
The author of the present work believes that for large colour stimuli the viewing situation in computer controlled environment and the set of displayable colours offer better inspection. A new psycho-physical experimental design can be introduced, which is different from a static visual situation and more appropriate to be used resulting in a more precise description of the large-field domain of the colour size effect. Temporal control of the large-size colour stimuli seems to be able to e.g. exclude or reduce chromatic adaptation and throw new light upon the phenomenon; therefore a more ‘sterile’
experimental setup is able to be built, with more focus on the effect of large size. In this
chapter, this near-immersive self-luminous aspect is investigated by simulating an almost immersed scene by the aid of a large plasma display panel (PDP) extended by a viewing chamber of mirrors and a typical cathode-ray tube (CRT) monitor. The possible underlying visual functionalities are also reflected on. These functionalities might have been neglected when observing surface colours in real illuminated painted rooms due to the diverse colour appearance in such situations. Considering the experimental set-ups of previous and recent surface colour researches, the author’s opinion is that, though it better resembles real situations, the complex scene has a noisy influence on the appearance of the colour of the walls of the painted rooms. The mixed illumination situation, possible shadows, textures of the surface, structural inhomogeneity may all confuse the single effect of the stimulus size, and therefore distract its essence and the possibility to trace its origin. This is one possible reason why the studies reviewed above had largely deviating outcome and that the overall average error of the predictions of the models built upon the experimental results decreased only to approximately ∆Eab*=9 from 18.
It was already described in Section 1.3 that the CIE 1931 colorimetric observer contains the colour matching functions (CMFs) of an average trichromatic observer, collected from colour matching experiments where the subtended visual angle of the matching fields was 2°, owing to the fact that there is no influence of rods in a viewing field of 2° in the human retina. To apply this model correctly, the background should be neutral and of medium intensity. Colour appearance models usually assume a 2° colour sample size in a 10° background and a set of parameters defining the viewing situation.
Experimental data e.g. for CIECAM02 were collected with set-ups satisfying the above conditions. From the cited references42-47 it is apparent that (though, they were not considered to) neither the CIE observers nor CIECAM02 was designed to predict the effect acquired by visual experiments using different experimental techniques to assess the appearance of colour stimuli observed at 20° of visual angle and above. In the rest of the work the term ‘immersive scene’ refers to a general photopic viewing situation where a homogenous colour stimulus fills the visual field of the observer centrally or even totally, here simulated by what subjects were exposed to when observing the PDP by leaning to the opening of the booth.
1.6.1. Questions to Be Answered
In the two forthcoming Sections (2 and 3) two separate experimental series are discussed, correction formulae are introduced for (almost completely) immersive self-luminous
scenes and several questions are intended to be answered in connection with the colour perception of exceptional size stimuli, such that:
1. How systematic is the size effect regarding self-luminous stimuli, in terms of the correlates of these perceptual attributes in a defined colour space (e.g. CIELAB hue and/or chroma)?
Can a mathematical correction formula be given to predict, which attributes of colours change as it has been previously given for the surface colours? Is it sufficient to extend the recently suggested size-dependent model, or a new one should be developed for extremely large scales? Are these shifts uniform (independent) or are they cross-related? Is it possible to separate the perceived lightness change of the sample from its hue? I.e. do the same shifts occur for red tones as for instance bluish colours?
2. Does the 2° or the 10° observer yield a closer match to the colour appearance of the large stimulus?
It is likely that, perceptually, the 10° sample is closer to the extremely large area, as the CIE recommends it above 4° of visual angle. Since the difference between the colour matching functions of the 1931 and the 1964 colorimetric observers is negligible compared to the expected magnitude of the size effect (literature data) simply using 10° CMFs
instead of the 2° ones may not yield sufficient results either, though it seems reasonable that it performs better. No literature data was found that a 10° matching ends up with a better result for large stimuli, in either size-effect related studies.
3. Does the luminance of the background of the samples affect the phenomenon?
Can the prediction be made more accurate if the standard size patches are presented on an achromatic background of the same luminance as the large sample? The increasing size of the stimuli may trigger some contrast effects, too. Samples becoming larger tend to behave as unrelated colours regarding that their latitude inhibits the visual system to compare them to any other stimuli in the visual field, while for small samples it is effortless. Comparing the large colours with colorimetrically the same small sample on a same luminance neutral background suggest that their perception will be closer than on a different luminance background.
4. Related or unrelated colours are the case?
Though, the colour of the immersive stimulus is in itself an unrelated one, if it is compared to a related colour, what are the major attributes observers judge, match and relate? Will either physical measure of the immersive colour correlate with either perceptual attribute of the visually matching related colour stimulus?
5. Is the examination in terms of the perceptual colour attributes the best approach to understand what changes exactly if a colour stimulus is large?
Any systematic shifts at other levels of the visual process should be searched for, by referring directly to the origin of the phenomenon. If the effect creates systematic shifts in the perceived attributes of colours (e.g. lightness, chroma) then it can be suspected to take place in the later process (third stage) of the HVS, while if it creates regular modifications in the single LMS or the LMS-combined opponent signals then an earlier, near-retinal process could be responsible for it.
For peripheral colour perception phenomena, the critical region starts at 20°-25° off- foveal vision. Accordingly, for a 50° centrally viewed stimulus peripheral colour
perception influences are not intense (since the stimulus laterally ends at 25°). It was also reported that, for mediums size samples, peripheral colour perception phenomena can be suppressed and the same appearance can be obtained at 20° eccentricity than foveally if the size of the off-axis stimulus is physically increased.32 For a large (50°) homogenous field compared to a smaller off-axis patch can be considered an increased size peripheral stimulus, which further minimizes the possible peripheral influences. It is suspicious, however, that above this critical lateral visual angle (20°-25°), peripheral phenomenon, i.e.
opponent signal structure changes may affect the colour perception of centrally viewed stimuli that cannot be predicted any longer merely by the extension of the size dependent model44 for broader visual angles. (50° was the maximum visual angle during the
observations, of which results the size-dependent models introduced in Refs. 43 and 44 were built on.)
6. Is this effect related to chromatic adaptation?
The size phenomenon for exceptional size surfaces was thought to be an adaptation effect.
In former experiments, this factor was discarded and there was no control of the viewing time (the time in which observers were exposed to the large stimuli). It is straightforward that the increased amount of adaptation might result in a fading of the chromatic content of
the stimuli if viewed continuously due to the bleaching of the cone pigments (practically the HVS’s effort to energy minimum). But the opposite was reported, namely, the
perceptual increase of chromatic content was observed for colour stimuli with the advance of their size.
The practical applications that would require modelling the colour size effect are numerous. There is an industrial demand to be able to predict the colour appearance of the same colour if applied on an indoor surface or on a façade surface of large size. Though, alluding to the size phenomenon through this architectural example was previously claimed to be inaccurate due to the mixed presence of several other effects, it is one of the major causes that are accountable for the visual mismatch of the dissimilar size stimuli.
Other applications for self-luminous stimuli include the more deliberate design of the display colours of large computer controlled colour devices that provide a large field. The newly set up Technical Committee No. 1-68 of the International Commission on Illumination is currently studying this phenomenon.
In the rest of this thesis, the term ‘large’ stimulus will be used for the near-immersive colour (extending almost the whole visual field) and ‘standard size’ or ‘small size’ colour for the 2° or the 10° matching field.
Data analysis and statistical calculations in the thesis as well as graphs and diagrams were prepared by the aid of Microsoft Office Excel spreadsheet program and SPSS for Windows application.
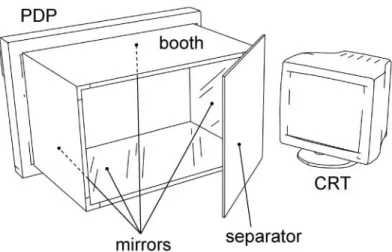
Figure I/3. Illustration of the experimental setup: the PDP with the mirrored booth, the separator and the CRT.
2. Experiment I
In this section, the first part of the comprehensive research50 of the author on the perceptual mismatch of the large field self-luminous stimuli with their small field equivalent is introduced. As an experimental method, the short time colour memory matching technique was used. This was accomplished between a standard size stimulus and a homogeneous large colour stimulus. Two colour monitors were used at a time, a cathode-ray tube (CRT) monitor and a plasma display panel (PDP). 16 test colours were selected carefully in a random manner, to cover the colour gamut of the devices. Observers were presented the 16 colours almost immersed and their task was to reproduce their perception on the other monitor under controlled circumstances. The psycho-physically measured values of the visually matching small and large colours were compared. It will be discussed what properties of the colours change in case of the almost immersive presentation.
2.1. Experimental Set-up
2.1.1. Stimuli and Viewing Conditions
The two computer-controlled colour monitors used were the following: a diagonally 54 cm Hewlett Packard P1100 CRT monitor and a Panasonic TH-42PHD plasma display panel (PDP) having a diagonal of 106 cm. The two devices were set up next to each other on a table. The angle between their screens was 110° (see Figure I/3).
The PDP served to show the large test field. To achieve a quasi-immersion by filling the whole visual field of the observers, a wooden viewing booth was set up in front of the PDP. The inner surface of the booth was covered by mirrors (2 walls, floor, and ceiling).
The depth of the viewing booth was 50 cm. The visual field of the screen of the PDP itself subtended 85° (horizontal) and 55° (vertical), from the viewing distance of 50 cm (the edge of the booth). In order to achieve a more uniform viewing field, and because of the short viewing distance, the screen of the PDP was covered by a neutral density diffusion filter.
The standard size stimuli to be matched to the large stimuli were displayed on the CRT monitor. The entire screen of the CRT monitor (with the achromatic background) subtended a 39°×30° (horizontal × vertical) viewing angle. The viewing distance for the CRT was 60 cm. To exclude light reflections from either device, a separator was mounted
between the two displays, see Figure I/3. The separator was a board covered by black matte paper. To ensure natural binocular viewing, there was no chin rest for the observers but positioning their head to the right side of the separator helped them maintain the correct viewing distance from the matching stimuli to view it under the desired angles on the CRT monitor.
The CRT and the PDP displays were driven by two different video controllers in two separate computers. The large stimuli were pre-set throughout the whole experiment, and only the matching stimuli presented on the CRT were adjustable. Measuring the luminance of a full-screen white at 9 evenly distributed points resulted in a mean value of Y=68.6cd/m2 (STD=1.8 cd/m2) and this homogeneity was considered acceptable for the purpose of this research. Although, the CRT proved to be colorimetrically stable, in the evaluation of the results, instead of a model-predicted output, only in-situ measured values of the displayed test stimuli and the observer’s matching answers were considered. A calibrated PhotoReserach™ 705 spectroradiometer* was used to carry out these in-situ spectral measurements. Specifications of this instrument are listed in Table I/1.
Table I/1. Specifications of the PR-705 spectro-radiometer (manufacturer’s data) Specifiction Value
Spectral range 380 – 780 nm Angle of view 2°
Spectral bandwidth 20 nm Spectral accuracy ±2 nm Luminance accuracy
(Standard illuminant A) ±2%
Chromaticity accuracy (Standard illuminant A)
x ±.0015, y ±.001
In previous examinations and in the course of several measurements51, though the plasma monitor turned out to be a stable display, no characterization model52,53 was developed for it, but the stimuli were set experimentally. It only displayed static stimuli repeatedly during the experiments.
* Calibration of the instrument was performed at the Ilmenau University of Technology using a PTB (Physikalisch-Technische Bundesanstalt, Germany) calibrated FEL type incandescent lamp. Based on these comparative measurements, after correction of the systematic errors of the instrument, a maximum uncertainty of one to two digits in the third decimal of the chromaticity co-ordinates could be obtained. For wavelength calibration different (Argon and Mercury) gas-discharge pencil lamps were used.
In this part of the experiments, the effect of two separate parameters was focused on regarding the investigated phenomenon. First, the question was if, assuming that observers would not reproduce the colorimetric values of the large stimuli due to the size effect, the use of 2° or 10° corresponding samples yield better results. In other words: Does the employing of 10° samples instead of 2°samples help predict the appearance of the immersive colours? On the other hand, the photopic luminance of the background of the small sample was also of interest: if keeping it on a constant mid value or making it equal to that of the test colours’ luminance for every match yielded less error in reproducing the immersive colour perception (The colour size effect may be assigned to a contrast effect due to the indispensable consecutive brightness contrast between the often significantly brighter immersive test colour and the background of the corresponding small stimulus to be adjusted during memory matching).
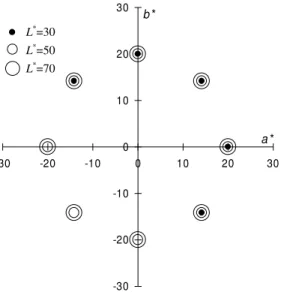
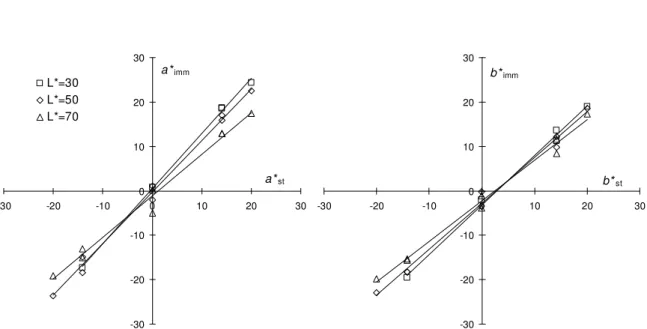
As noted previously, 16 test colour stimuli were selected to experiment with. The test colour stimuli covered the whole PDP screen but the corresponding matching colour stimuli subtended only 2° or 10° on the CRT monitor. The matching stimuli were of square shape (side length: 10.5 cm – 10° and 2.1 cm – 2°) and appeared in the middle of the CRT display. The chromaticities of all test colour stimuli were away from the colour gamut boundaries of the CRT monitor, in order to be able to display the expected magnitude of the colour size effect on the CRT, according to earlier results.42,43,46,47 The CIELAB a*-b*
coordinates of the test colour collection are plotted in Figure I/4. These CIELAB values were determined from the measured spectral data by using the CIE 1931 colorimetric observer and the measured tristimulus values of the maximum achromatic output of the CRT monitor as white point* (Y=59.69 cd/m2, x=0.2956, y=0.3087, CCT=7874 K;
r=g=b=255). These values are also listed in Table I/2 together with numbering and approximate colour names to make them easier to imagine. The numbers (as next to each dot in Figure I/4) will refer to the stimuli in the rest of Section 2.
* It seems to be a contradicting procedure to derive the CIELAB values for the immersive stimuli of the PDP, too, using a reference white that is not present on the screen, since, it is the white of the CRT but for a first approach and for practical reasons it was accepted to do so. Since, a model will be set up to predict the colour appearance of the immersive colour, a colour difference measure was needed to be able to express the goodness of the model and compare it to that of the related models found in literature. It will be reflected on in the forthcoming sections that this approach does not radically decrease the nature and predictability of the size effect (see the model performance tests at the end of Section 3.2.1 where the model derived from an experiment performed adequately applied to the result of another experiment using another white point).
Also, in the General Discussions (Section 4), besides further anatomizing the legitimate use of CIELAB, even comparing its performance in the present experiments to that of CIECAM02, experimental data will be converted into absolute measures (luminance and CIE u’-v’) and Hunt model attributes for further discussions.
13 11 2
16
3
4 12
1 10 9
14
15
8 7 6
5
-40 -20 0 20 40 60 80
-60 -40 -20 0 20 40 60
a*
b*
Figure I/4. The 16 test colour stimuli used in the experiment in a CIELAB a*-b* diagram, for L* values refer to Table I/2.
Table I/2. List of the CIE L*, a*, b* values of the 16 test colour stimuli together with their naming
No. L* a* b* Colour name
1 73.92 17.59 11.78 light skin 2 84.77 -14.15 50.14 pale yellow 3 74.74 -43.99 27.82 light green 4 39.81 -22.18 14.03 dark green 5 59.88 -23.70 -18.52 turquoise 6 41.68 -4.83 -17.90 dark blue 7 64.88 -21.27 -14.20 light blue 8 31.29 17.28 -26.15 dark purple 9 65.84 37.63 9.06 pink
10 28.25 19.32 2.31 dark mauve 11 50.19 19.25 34.96 dark orange 12 46.03 25.98 14.71 flesh
13 69.02 3.67 25.42 light drab 14 77.17 -1.76 -3.59 light grey 15 76.08 17.39 -11.72 light purple 16 85.25 -15.08 61.46 yellow
The luminance of the background of the matching stimuli on the CRT had two values.
In the further part of the paper the two background luminance conditions will be referred to as fix background (the same for all stimuli) and changing background (the same luminance as that for the immersive test colour stimulus). For the fixed condition this grey background was X=29.35, Y=30.89 (cd/m2) and Z=38.72, which is half the luminance of the peak white of the CRT; for the changing background criterion it was the same chromaticity grey as for the fixed case (x=0.297, y=0.312) with the same luminance as the actual test stimulus being observed.
2.1.2. Procedure
The 16 test colours (see Figure I/4 and Table I/2) were organized in a sequence of five repetitions each and additional 20 randomly selected colours were added, not being evaluated later, just to make the observations more varied. The resulting set of hundred colours (5×16+20=100) was then randomized and divided into four groups (25 matchings in each). Observers had to assess the appearance of the immersed stimuli of one group at a time. They were requested to adjust the colour of the matching stimuli on the CRT monitor by the aid of three sliders, each representing a colour attribute (lightness, hue, saturation) in HSV colour space,54 until the colour perception of the large stimulus matched that of the matching sample. Instead of the classical tristimulus mixing procedure (i.e. using the display’s RGB channels directly) this and other methods based on adjusting the correlates of perceptual attributes of colours (e.g. hue, chroma and lightness) give significantly better performance in terms of both accuracy and time.55 Though regarding the HSV system, the words hue, saturation and value are not so reasonable colorimetrically, HSV itself is a mathematically equivalent representation of the RGB colour space (a simple reformulation) used frequently in the digital media for the digital representation or computer-controlled display of colours.
Each matching started with the observation of the large field presented to the observer on the PDP for two seconds only (the reason for the short appearance of the large field is described later), and then, the grey background appeared (evidently, its luminance corresponded with the background condition of the experimental session). Then, subjects moved their head and looked at the CRT monitor to adjust the matching colour. Initially, the matching colour was set to achromatic mid-grey as close as possible to the grey background of the PDP both in chromaticity and luminance (Y=29.9 cd/m2) for each matching. The task was to modify the hue (H), saturation (S) and value (V) sliders in the