Trichromatic and hyperspectral imaging methods for investigating
food and farm produce
Ferenc Firtha
Thesis
Corvinus University of Budapest Faculty of Food Science
Department of Physics and Control
Budapest, 2008
1
1. Introduction
Non-destructive, non-contact and fast measurement methods are demanded for on-line industrial quality control tasks. Optical methods, like machine vision systems, allow real-time classification or discrimination of objects on the processing chain. By processing the spatial distribution of its RGB coordinates, an object can be identified, its spatial location can be determined and its visible properties, such as colour, texture and shape, can be described by quantitative properties.
Near Infrared Hyperspectral imaging (NIRHSI) is another emerging platform technology that integrates conventional imaging and spectroscopy to attain both spatial and spectral information from an object.
Spectral properties, such as NIR reflectance, can detect invisible features, e.g. existence of chemical components of the surface. In order to detect a certain feature on a particular object, characteristic wavelengths must be determined by the analysis of sample spectra from that object. This fast and non- contact measurement method can be also used for real-time controlling or quality control tasks.
The industrial usage of both methods requires the preliminary investigation of the object. This purpose needs general and flexible algorithms. Such image processing segmentation methods of RGB were developed for RGB vision system. Necessary calibration process was developed to enable standard colour measurement of surface. Algorithms were developed to describe colour and texture. General, specific and morphologic methods were researched and developed for shape-description.
Two important problems in NIRHSI are those of stability of measurement and data load. In general, approximately 2% of pixels in NIR detectors are unserviceable or ‘dead’, containing no useful information. While this percentage of pixels is insignificant for single wavelength imaging, the problem is amplified in NIRHSI, where > 100 wavelength images are typically acquired. This study describes methods to get efficient signal-noise ratio and stabilize measurement. It describes systematic procedures for conditioning the temperature and compensating for ‘dead’ pixels in the NIR sensor.
Hyperspectral imaging experiments generate large amounts of data (typically > 50 MB per image), which tend to overwhelm the memory capacity of conventional computer systems. This inhibits the utilisation of NIRHSI for routine on-line industrial application. This paper describes an approach for reducing the data load of hyperspectral experiments by using sample-specific vector-to-scalar operators for real time feature extraction.
The feasibility of this system was tested for prediction of moisture reduction in carrot tissue.
2. Trichromatic system
2.1. Objectives
General and tunable segmentation methods had to be developed to select inspected areas on images for the following cases:
• In case of expecting two colour classes in RGB space, a threshold method had to be developed and improved.
• In case of selected a colour class among more existing, a clustering technique had to be developed. Additionally the distance of colour direction had to be defined.
• For cases where only the contrast can distinguish the areas, the edge detection and –growing methods had to be tested.
2
Methods had to be developed for describing the colour and texture of selected areas. For that:
• Algorithm had to process the pixels of areas in sequential order (optimal for smaller objects) and make colour statistics.
• The calibration terms had to be stated and algorithms had to be developed for ensuring to transform measured RGB signal to CIE colour spaces.
• Texture analyze methods had to be developed and checked due to the given special tasks (like porosity of bread, etc.).
Algorithms had to be developed for processing the pixels of outline sequentially and describing the shape for general, specific and morphological way:
• In case of general object, the symmetric properties, like size, length, thickness, etc. must be described. These parameters could be used for automation purposes.
• For special object type, the specific parameters of its usual expert system should be calculated.
These values must help to reconstruct the shape of object.
• Methods had to be developed for description the structure and details of crops and leaves. The morphologic description also needs the rectification of curved axes (topology).
2.2. Materials and methods
For segmentation of two clusters, the thresholding technique has been improved by calculating the optimal direction to discriminate on the base of colour statistics (Fig. 1.a).
For segmentation of more clusters, a learning-sample clustering method was developed, and the distance of two colour direction was defined to handle signal changes caused by curved surfaces (Fig. 1.b).
Several edge detection algorithms were implemented and tested, but heuristic edge searching algorithms was found to have not enough general way for that purpose (Fig. 1.c).
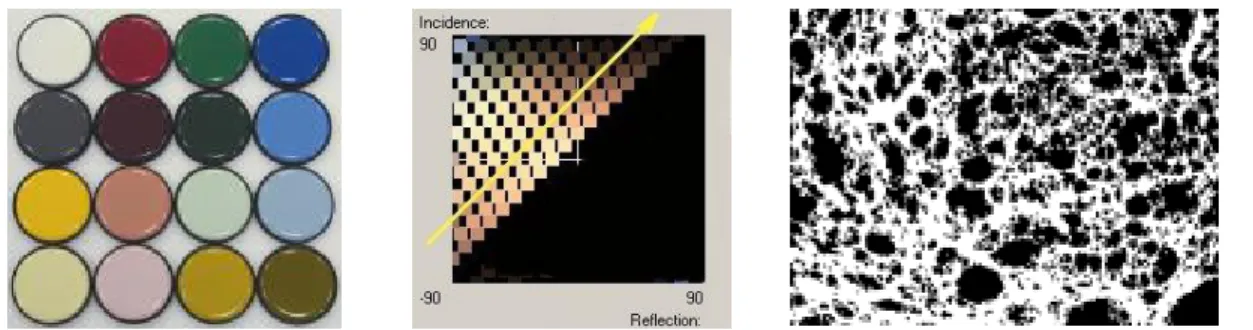
Fig. 1: Segmentation for two modus (a), clustering technique (b) and edge detecting result (c) For colour measurements, a calibration method and requirements was stated and also a noise-reduction algorithm was developed for insuring transformation to CIE space (Fig. 2.a).
Setup was built to measure the effect of non-homogeneous incidence and reflected angle to the measured signal. Controlling software was also developed (Fig. 2.b).
For e.g. estimation of porosity (texture sample), three kinds of algorithms were developed, implemented and compared: Hough- and 2D Fourier transformation and a painting one (Fig. 2.c).
Fig. 2.: Colour standards (a), effect of curved surface (b) and sample for texture analysis (c)
3 Fourier algorithm was developed for describing symmetric properties. The polar coordinates of outline are calculated relative to the weight-point. After interpolation, FFT transformation, the amplitude-shift representation of coefficients provides the desired properties of shape (Fig. 3.a).
For description of special object group’s shape, a specific sequence of function is fitted to the outline.
The parameters of function sequence are calculated by LSE method in polar coordinate system. These parameters can be similar than used in expert systems (Fig. 3.b).
For morphological description, the curvature and break-points are determined. The digital noise had to be reduced. Finally special functions are fitted between the main break-points selected by Split-and- merge algorithm. Method was developed for rectificating curved axes of a natural object (Fig. 3.c).
Fig. 3: Shape description: general (a), specific (b), morphologic and rectification (c)
2.3. Results
The software implementation of methods has been used for feature-extraction in several successful applications. Their publications prove the capability of measurement system (Fig. 4.). Some are listed in
‘Publication’ section, others have referenced my algorithms. The reduced colour, texture and shape parameters of fruit, vegetable, seed, grain, leaf, etc. retrieved by the software were statistically analyzed or processed in these applications.
Fig. 4: Segmentation result for black & white object (a) and for „in vivo” application (b)
The data acquisition routines and also the image processing functions were implemented as ActiveX and in dynamic libraries (DLL). Several special image processing applications (software) were built by using these routines, like:
• Controlling software for measuring reflectance properties of different food and crops,
• Fitting object-group (e.g.onion) by function sequence and reconstructing shape in 3D,
• Three methods (Hough, 2D Fourier, thresholding) for description the porosity of bread,
• Transforming selected rectangle area to excentric polar coordinates (used for drying apple),
• Algorithm for automatic target detection (colour, hue, intensity) and tracking (for robotic tasks) Several data processing, numerical algorithms were also developed and implemented for evaluating visual parameters retrieved by the system, like: Fourier transformation, clustering, artificial neural networks for data extraction, minimum searching algorithm (e.g. for fitting data by function), etc.
4
3. Hyperspectral system
3.1. System development
The push-broom hyperspectral imaging system employed in this research allowed two different configurations: one for imaging in the visible-very NIR range (400-1000 nm) and another for imaging in the NIR range (900-1700 nm). The NIR configuration was used in this study. The system consists of a linear translation table (Y-table), illumination source (IlluminationTech 3900: 0,1% stability, halogen bulb), objective lens (2/3" C-mount broadband coated lenses, Schneider–Kreuznach CINEGON), N17E spectrograph (Specim), detector (LuxNIR: InGaAs, 320 x 256, 12 bits, 30*30 µm, 98% pixel operability) and PC. Algorithms and software had to be developed for controlling calibration and measurement cycles, for ensuring suitable signal-noise ration, its stability and also for reducing the size of hypercube.
Algorithm was developed (Borland C Builder) for controlling the sensor and the stepping motor that drives the Y-table synchronizing velocity of Y-table and grabbing frequency.
The signal was found to be very sensitive to the temperature of the sensor. The Peltier cooler that extracted the heat from sensor, had to be controlled setting its proper value automatically.
The non-homogeneous spectral and spatial sensitivity of the sensor had to be handled by dark- and bright-field reading and measuring reflection and absorption relative to these matrices. The software also led the necessary calibration steps, like setting proper AD conversion range without overdriving.
Method was developed for eliminating the Salt-and-Pepper noise of InGaAS sensor. The process determines the two kind of unserviceable pixels, estimates their value by regression recursively and repairs the values of effected neighboring pixel (Fig. 5.).
Fig. 5: Dark (a) and bright (b) pixel’s effect and superposition
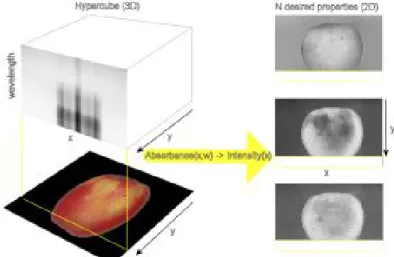
The software developed makes possible to real-time extract the spatial distribution of even more spectral properties simultaneously (Fig. 6.). The suitable vector-to-scalar data-reduction operator to extract the desired feature must be determined on the base of statistical analysis of spectra of learning set.
Fig. 6: Illustration of feature-extraction (real-time data-reduction of hypercube)
5
3.2. Experiments
Carrot slices were investigated to determine moisture loss of different tissues as sample experiment to prove suitable signal-noise ratio and stability of the system built. The optimal feature-extraction operators of examined tissue-types (xylem and phloem) and moisture content were determined by measuring spectra of learning set. Special measurement setup eliminated the darkening (oxidation) and brightening (quick drying) of damaged cells of the cutting area (Fig. 7.). The conditions and timing of the measurement had to be especially well conditioned.
Fig. 7: New covered side was measured next (a). Areas of carrot tissue selected for analysis (b).
MathCad algorithms selected automatically the spectra of examined tissue-types on saved Intensity(x,w) matrices of measured lines. The spectra were pre-processed (normalization by background, conversion to absorption) and statistics were made for cultivars, pieces, tissue-types and drying time groups.
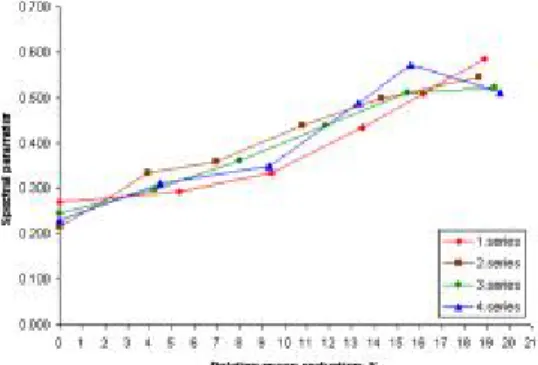
The spectra of tissue-types were found to be different and the change of spectra was monotonous on both tissues. Spectral parameter of moisture content was built on the base of absorption peaks of water.
The moisture-content of pieces was also registered, and it correlated well with spectral parameter on both tissues (Fig. 8.).
Fig. 8: Spectral parameter by relative mass-reduction for 4 measurement cycles
The significant wavelengths of tissue and time classification were determined for usage of multispectral application. Discriminant analysis (DA) proved, that both the tissue-types and storing time can be classified by spectrum. PLS regression coefficients were used for selecting significant and reliable wavelengths.
By this methodology the optimal feature-extraction (data-reduction) operator of object set can be determined by the investigation of learning set. Using this operator, the spatial distribution of feature’s intensity can be measured on object set. The pseudo-images of intensity retrieved by this measurement system, can be processed later by usual image processing methods (Fig. 9.).
Fig. 9: Pseudo-images to detect changes of xylem by drying time (0, 90 and 180 min)
6
4. Theses
1. Methods and implementation were developed for researching visual parameters of food and their raw material. General and tunable segmentation algorithms were developed for that purpose.
• Images having two colour clusters were segmented by the proper threshold value of the intensity histogram. The intensity was defined by the direction of RGB space that discriminates the pixels of object and the background the most optimal. This direction is calculated by colour statistics.
The proper threshold value is calculated for even more, non-Gaussian modus.
• A cluster algorithm was developed and implemented for segmentation of images having more colour clusters. The distance of hue angles was defined to handle non-homogeneous intensity signal measured of curved surfaces.
• Painting method processes the pixels in sequential order eliminating the noise of segmentation.
The outline of selected areas can be smoothed by morphological operators (opening and closing).
2. Methods were developed for describing the colour and texture of selected areas by statistical parameters and to convert the measured XYZ colour coordinates to standard CIE system. The following conditions of colour conversion were set:
• The noise of the sensor was measured and an algorithm was implemented for significantly reducing it.
• Proper calibration method was determined to allow conversion of measured XYZ signal to CIE RGB coordinates.
• Measurement system (setup and software) was build to check the dependence of measured signal to incidence and reflected angle on curved surface.
3. Methods were developed to describe the shape of food and crops for general (automation), special (expert system) and morphological (structure and details, curved topology) purposes.
• The symmetric properties of shape are described by Fourier coefficients. Fourier transformation is processed on the polar coordinates of outline relative to the weight-point. The amplitude-shift representation of coefficients describes the average radius, the ellipsicity and orientation, and all the symmetric (periodic, harmonic) properties of shape. These coefficients can be used for automation processes in several task.
7
• The shape of special object group (like e.g. onion cultivars) is described by the regression of function specific to the group. The function’s parameters calculated by least square error method characterize the shape. Such parameter representation can be used in expert systems.
• The non-periodic or non-harmonic details of the shape (e.g. spikes on the edge of the leaf) are described by the determination of curvature and breakpoints. Algorithms were developed to eliminate the digital noise of raster images and to describe details of outline.
• The morphologic shape description of objects (like leaf) can be realized by determining the main break-points of the outline, then the segments between them are estimated by invert Fourier or cubic Spline or other specific functions.
• Algorithm was developed for the rectification of curved axes that occurs frequently in case of crops and leaf. The real parameter of shape, like length and thickness can be determined in this transformed topology.
4. Methods and implementation were developed for researching hyperspectral properties of food and their raw material. The controlling algorithm can real-time enhance the distribution of inspected properties by their data-reduction operator. The system can test operators of multispectral application.
• Stable signal level was insured by proper calibration method and the algorithm, that eliminated the noise of NIR sensor, handled the non-homogeneous sensitivity and conditioned the temperature of sensor. Solving these technical problems is particularly important when measuring the spectral distribution of non-izolated and unevent surface.
• The spatial distributions of examined properties are enhanced by vector-to-scalar data-reduction operators. These operators are determined on the base of measurement and analysis of sample group (learning set). Extracting the intensity (scalar) of property from spectra (vector) of test-set can dramatically reduce the enormous size of hypercube. The retrieved pseudo-images can be inspected later by usual image processing algorithms.
• Carrot tissues were inspected to evolve significant wavelengths for discrimination by tissue-types and drying time. The spectra of learning set were measured and optimal feature-extraction operators were calculated by statistical analysis. The drying time and even the distribution of moisture-loss can be measured on carrot by this method.
8
5. Relevant publications in English
5.1. Articles
• J. Felföldi, F. Firtha and E. Győri (1994) Colour evaluation of fruit aided by PC based vision system - Journal of Food Physics, Vol. LVIII.:pp. 67-74.
• J. Felföldi, F. Firtha and E. Győri (1995) Colour analysis of fruits and vegetables aided by PC based vision system - Hungarian Agricultural Engineering, 8/1995, pp. 43-45.
• L. Baranyai, F. Firtha (1997) Selection of broken kernels by image analysis – Quality Assessment of Plant Products, Prague, No. 3, pp. 1-4. (ISBN 80-213-0339-5)
• F. Firtha (2006) Controlling and Calibration of Hyper-spectral measurement - Journal of Food Physics, Vol. XVII-XVIII (ISSN 1416 - 2083), pp. 13-28.
• F. Firtha (2007) Development of Data Reduction Function for Hyperspectral Imaging - Progress in Agricultural Engineering Sciences, Volume III., pp. 67-88. (ISSN 1786-335X)
• F. Firtha (2008) Detecting moisture loss of carrot samples during storage by hyperspectral imaging system – Acta Alimentaria, accepted, available online (ISSN 1588-2535)
• F. Firtha, A. Fekete, T. Kaszab, B. Gillay, M. Nogula-Nagy, Z. Kovács, D. B. Kantor (2008) Methods for improving image quality and reducing data load of NIR hyperspectral images. Sensors- Basel 2008, 8 (ISSN 1424-8220), pp. 3287-3298.
5.2. International conference (full)
• F. Firtha (1991) Aspect of planning Database Manager program for National Cultural Collections - UNDP-EUROPE,UNESCO: GIAM IX. International Conference, Malta, nyitóelőadás
• F. Firtha (1993) Storing and handling physical data of food industrial materials on PC – Acta Alimentaria, Vol. 22 (3), p. 256.
• A. Fekete, J. Felföldi, F. Firtha & E. Győri (1995) Fruit shape and colour analysis by image processing - 5th International Conference on Image Processing and its applications, Edinburgh, UK, pp. 1-7.
• A. Fekete, J. Felföldi, F. Firtha & E. Győri (1996) Computer vision for fruit and vegetable quality assessment - ASAE Annual International Meeting, Phoenix, No. 966014, pp. 1-5.
• F. Firtha (1997) Image analysis by PC – UPOV (International Union for the Protection of New Varieties of Plants), Technical Working Party on Automation and Computer Programs (OMMI), Budapest, oral + ANNEX IV. pp. 1-5.
• E. Győri, F. Firtha (1998) Detection of Damage of Fruits by Vision System. Proceedings Sensoral, Montpellier, France
• F. Firtha (2005) PC controlled Vision System for Measuring Colour Distribution and Transmission of Spatial Objects - Slovak Univ. Of Agriculture: "Research and Teaching of Physics" International Scientific Conference, Nitra, poster+fulltext (ISBN: 80-8069-528-8)
• F. Firtha (2006) Hyper-spectral image processing method for real-time measuremement of features - EurAgEng 2006, Bonn: Agricultural Engineering for a Better World, oral no 872, fulltext no.
440119580625 (ISBN 3-18-091958-2)
• F. Firtha, A. Fekete, T. Kaszab, P. Takács, B. Herold, W. Herppich, B. Borsa & L. Kovács (2006) Analysis of Carrot Drying by Hyperspectral Imaging - EurAgEng 2006, Bonn: Agricultural Engineering for a Better World, poster no 926, fulltext no. 440119580699 (ISBN 3-18-091958-2)
• S. Barton, F. Firtha (2006) Generalized symmetry and rectification of 2D objects – V. International Mathematical Workshop, Technical University in Brno, pp 1-25 (ISBN 80-214-3282-9)
9
• T. Kaszab, F. Firtha, A. Fekete, B. Herold, H. Werner, M. Zude, B. Borsa & L. Kovács (2007) Water Content Variations in Carrot Tissue by Hyperspectral Imaging – ASABE, Biological Sensorics:
Critical Technologies for Future Biosystem, Minneapolis, Minnesota, oral + fulltext (paper number:
076109) + online available (asae.frymulti.com)
• T. Kaszab, F. Firtha, A. Fekete (2007) Carrot quality assessment by hyperspectral imaging – 3th International Conference TAE 2007, Prague, Czech Rep., Oral + fulltext: pp. 208-211 (ISBN: 978- 80-213-1668-3)
5.3. International conference (abstract)
• F. Firtha (1991) Aspect of planning Database Manager program for National Cultural Collections - UNDP-EUROPE,UNESCO: GIAM IX. International Conference, Malta, előadás + abstract
• F. Firtha (1993) Storing and handling physical data of food industrial materials on PC – Acta Alimentaria, Vol. 22 (3), p. 256.
• A. Fekete, J. Felföldi, F. Firtha & E. Győri (1995) Fruit shape and colour analysis by image processing - 5th International Conference on Image Processing and its applications, Edinburgh, UK, p.5.
• E. Győri, J. Felföldi & F. Firtha (1995) Fruit bruise assessment by image analysis - 9th World Congress of Food Science and Technology, Budapest, Vol. II. p. 110.
• E. Vozáry, P. László, F. Firtha & P. Sass (1995) Impedance measurement of apple varieties - 9th Word Congress of Food Science and Technology, Budapest, Vol. II. p. 139.
• J. Felföldi, F. Firtha & E. Győri (1996) Machine vision applications to quality characterisation of food products - Acta Alimentaria (1997) Vol. 26 (3), pp. 289-290.
• F. Firtha (1998) Studying Image Processing Methods - 4th Seminar on Energy and Environment, GATE, p. 30.
• F. Firtha (2004) Measuring colour distribution and reflectance using PC vision system and controlled stepping motor setup; Representations in different colour spaces – AgEng 2004, Leuven, Belgium, Book of Abstracts (ISBN 90-76019-258) pp. 1014-101