PUBLISHING IDEAS: THE FACTORS DETERMINING THE NUMBER OF BOOK TITLES*
Bas van LEEUWEN – Aurelian-Petruş PLOPEANU – Peter FOLDVARI
(Received: 12 March 2017; revision received: 23 August 2017;
accepted: 26 October 2017)
The number of books published in a country refl ects its economic, social and cultural development.
Yet, all too often, the production of books is looked upon solely in economic terms, i.e. as a part of national income, or as a proxy for human capital which, in turn, might explain economic growth.
In this paper, we aim to give books their day in court. Using a dataset with book titles per 1,000 inhabitants for a large number of countries since 1950, we fi nd that the number of titles was mainly driven by the level of education and income in the lower quantiles. The reduction of printing after 1990 was, surprisingly, not caused by a rise in other media, such as the internet, but, mostly, by a reduction in the effect of education in the poorer countries.
Keywords: book titles, culture, income, education, religion, government JEL classifi cation indices: C23, C31, I21, N30
* The research leading to these results received funding from the European Research Council under the European Union’s Horizon 2020 Programme / ERC-StG 637695 – HinDI, as part of the project “The historical dynamics of industrialization in Northwestern Europe and China ca. 1800–2010: a regional interpretation”.
Aurelian-Petruş Plopeanu, corresponding author. Researcher at the Department of Interdiscipli- nary Research – Humanities and Social Sciences at the Alexandru Ioan Cuza University of Iaşi, Romania. E-mail: aplopeanu@gmail.com
Bas van Leeuwen, Project Leader of a 5-year ERC project on regional industrialisation in North- western Europe and China, at the International Institute of Social History, Amsterdam, The Nether- lands. E-mail: bas.vanleeuwen1@gmail.com
Peter Foldvari, Researcher at the International Institute of Social History, Amsterdam, The Nether- lands. E-mail: P.Foldvari1@uu.nl
1. INTRODUCTION
The importance of book production goes well beyond its economic importance.
As pointed out by Frase (1967: 29), whereas it is an “infinitesimal fraction of the total annual [economic] production”, “[i]n terms of intellectual and artistic content […] the annual production of general books would rank at the top of the scale. Indeed, as recently pointed out by Umberto Eco (2016: 275–277), books are physical platforms in wich human ideas, informational contents and explicit knowledge are collacted and through wich are transmitted in various ways to readers over time.”This view holds, even when no factual knowledge is included since, as described by the OECD (2011), besides the educational aspect, the in- trinsic pleasure of reading is an important factor in human well-being.
Given its importance, surprisingly, little research has been done so far on ex- plaining the geographical spread of the published new book titles. Surely, many scholars have looked at the reverse causation, i.e. with books assumed to be a proxy of knowledge, literacy, or education, as an explanatory factor of economic growth. Studies (e.g. Baten – Van Zanden 2008; Dittmar 2011; Plopeanu et al.
2014) often reach varying conclusions about its importance, by region and time period.
Yet, given its importance in its own right, in this paper, we will analyse what determines the number of book titles per capita in the second half of the 20th century. In the following section, we briefly review the literature on the factors determining the production of new books. These factors may be numerous, but can be roughly subdivided under the categories of economy, education, popula- tion, and culture/politics. In Section 3, we move on to the description of our data and methodology. Section 4 provides the analysis showing remarkable changes after ca. 1990. We end with a brief conclusion.
2. THEORIES BEHIND THE DIFFUSION OF BOOKS
Four theories exist about book production stating that book production is driven by economic factors, education, population, and culture/politics, respectively.
Starting with the first category, it is argued that the higher the income, the higher the demand for books. This increased demand follows from three aspects: (i) people’s inherent pleasure from reading books (Towse 2010), (ii) books may be seen as an appropriate investment, and (iii) an OECD study (2002) states that the pleasure of reading enhances a family’s educational success, a finding confirmed by various authors (e.g. Krashen 1993; Campbell et al. 1997; Guthrie –Wigfield 2000; Evans et al. 2010; Clark – Douglas 2011).
But, there are other indirect links between income level and the demand for books. It is a consensual view that the advanced industrial economies require more skilled labour and also have more resources to allocate to education both as an investment and as a consumption good (Machlup 1970; Meyer et al. 1977).
Indeed, “low intellectual awakening and poverty, among other factors, limit the spread of books and reading at the lower socio-income level while the entertain- ment media take the leisure time of the average and the rich.” (Nkechi 2010:
207). That the lack of income is one factor obstructing the demand for books is confirmed in the case of Haiti by Cliché (2013: 33) who shows that “while the culture of reading is valued, a low literacy rate and the limited purchasing power of many Haitians have prevented a domestic book industry from develop- ing.” Another historical example follows from the Great Depression of the 1930s which witnessed a severe drop in the sales of newspapers, magazines and books.
Between 1929 and 1933, in the United States of America it has been estimated that the demand for new books decreased by 100 million in total from a peak of approximately 214 million (Welky 2008: 10).
Besides income and poverty, a second set of theories regarding the spread of book printing concerns education. Indeed, that higher education in a region may lead to higher levels of book production is shown by an example of the late 16th century and the beginning of the 17th century, which witnessed a marked surge in book production in Cambridge. “In the 1580s, the decade that marked the begin- ning of University printing at Cambridge, there were perhaps as many as three hundred books or pamphlets published in most years. By the 1630s, this figure had more than doubled. The increase in new publications was by no means regu- lar, whether measured in titles or in editions, and political crises in the 1640s, late 1670s and 1680s, for example, produced exceptional flurries of activity”
(McKitterick 1992: 4). Not only did the more educated demand more books, but the production of educational books also increased due to increasing levels of education (Garner 2004). Finally, also a quest for useful knowledge, sprouting from the enlightenment may have contributed to an effect of education on book titles (Mokyr 1998, 2007; Burke 2000).
A third factor determining the number of book titles concerns population and urbanisation. Following Kremer (1993) and Galor (2011), we may argue that, consistently with historical evidence, increased population led to an increase in the number of people that invested in education. However, there may also be different scale effects. For example, Galor – Weil (2000) argued that increased population and/or a small increase in the level of education (due to the fact that schooled people have more surviving children) increased the share of educated people and, hence, increased the demand for technical knowledge and literature.
This increase in population and education was, however, limited to cities. Dittmar
(2011: 1165) noted that “between 1500 and 1800, European cities were seed- beds of the ideas, activities, and social groups that launched modern, capitalist economic growth … (the) movable type print technologies had very substantial effects in European economic history through their impact on cities.” But obvi- ously, the role of urbanisation strongly changed in the course of the 20th century:
urbanisation in developing countries has often been paired with growing inequal- ity and poverty. In other words, we cannot expect urbanisation to be an unques- tionable driver of demand for written culture anymore.
The final category having an effect on the number of book titles concerns religion and politics. Indeed, book production has been closely intertwined with religion. Looking at the relation with the Protestant Reformation in the 16th cen- tury, it has been argued that “[i]n 1500, fifty years after the printing press was introduced, 95% of Europeans were Roman Catholic and 5% were Jewish. By 1600, Europeans were Roman Catholic, Lutheran, Calvinist, Zwinglian, Anabap- tist, and from other faiths. Printing helped spread the words of such men as Mar- tin Luther, William Tyndale, and John Calvin. In doing so, the printing press ac- celerated the course of the religious fragmentation that characterised the sixteenth century” (Crompton 2004: 34). In general, this fragmentation had a big effect in history since the possession of theological books was strongly related to religious persuasion and less to socio-economic level (De Kruif 2001). Indeed, an often- heard argument is that allowing individuals to read the Bible in Protestantism had a major effect on reading capability and, hence, on book production in the protes- tant countries. This relationship has changed over time though. For example, it is noted that book production of scholarly and non-scholarly literature on religion in Germany has increased since the 1990s, while the Church affiliation has declined constantly (Eggert – Holscher 2013). But Germany was not the only case. An overall trend of theological book production marked the 1990s. The causes were the cultural factors, the need for people to understand deeper the religious tradi- tions (Charles 2004) and the meaning of personal life (Nelson – Garrett 2004).
Politics also played an important role. First, it is often stressed that “[t]he proc- ess of the expansion and consolidation of political authority prompts educational expansion because it requires the creation of a national political culture and ideol- ogy, and the creation of national citizenship” (Merriam 1931 op. cit. Meyer et al.
1977: 243). Basically, the political elites benefit from steering book titles focus- ing on their own ideology. This process “should intensify in the contemporary world since the power of national states has continued to increase” (Meyer et al.
1977: 243). A clear example is formed by the fact that many ex-communist East- ern European countries followed a more Soviet orientation in terms of ideology, a set of ideas that was opposite to the dominant Western paradigm. This reality demonstrated the inability to integrate with the Western Europe’s ethos and val-
ues (Abramitzky – Sin 2014).1 Second, the colonial power might also affect book titles (Chase-Dunn – Rubinson 1977). This relationship arises from the fact that the elites in such societies “derive their power from their links to metropolitan centers and not from their success in integrating their populations into a national culture” (Meyer et al. 1977: 243). To phrase it more directly, the French colonial elites preferred French literature.
In this paper, we will stress these four categories of drivers of book production over the past 50 years by assessing their role. Hence, the number of book titles is our dependent variable and we will not assess how book titles may or may not be a proxy for human capital.
3. DATA AND METHODOLOGY
The fundamental idea is to run a regression of book titles per 1,000 inhabitants on explanatory variables described above, i.e., GDP as a proxy for income, average years of education, population, urbanisation and politics. The reason for using book titles rather than the number of books issued is not only that data on print runs are scarce, but also that in general number of issues and number of book titles are strongly correlated. In our sample, the only exceptions are Tunisia, the United Arab Emirates and Saudi Arabia for a few selected years. The description of the variables which are taken into consideration is provided in Table 1.
With the above data, it would be natural to use a fixed-effect (FE) panel re- gression to test our hypotheses. Because of the great degree of heterogeneity in the data, the regression equations would be misleading. In Table 2, we report the results from a simple FE panel specification.
Based upon these regressions, one would arrive at somewhat surprising results that are difficult to square up with our theoretical expectations. First, the level of GDP does not seem to matter at all, which clearly questions whether the number of book titles can be seen as a normal good. This might be caused by the unob-
1 In addition, there is a direct government influence in publishing. Skelly – Stabnikov (1993) demonstrated that prior to the Gorbachev’s systemic reforms (e.g. Perestroika and Glasnost), the Soviet Union’s book production was at high levels due to an extensive state-run publishing industry. In this direction, a controlled system of prices, book titles and numbers, materials’
quality was managed by the political system, which considered the publication activity as an ideological duty. During the Gorbachev’s systemic reforms, the publishing industry ex- perienced a rupture from the state with its price controls and different substantial subsidies.
“Through the reforms, firms, organizations, and institutions gained the right to publish, and Russian authors and publishers gained the right to freely buy or sell rights, including in trans- actions with international parties” (Abramitzky – Sin 2014: 17–19).
served heterogeneity, which causes the estimates from the FE panel specification to become biased. Another reason is that, whereas book titles are non-normal, the number of book issues might not be. Yet, as we argued in the beginning of this Section, book titles are strongly correlated with the number of book issues ren- dering this argument invalid. Second, it is also puzzling why education would not matter for the demand for books in the last 25 years, when it yields the expected positive coefficient between 1950 and 1989.
The most likely reason behind these strange results is the heterogeneous nature of the data. Two main effects of this heterogeneity may occur. First, some factors affect the demand for books differently in the developed, wealthy economies than in the low developed countries (LDCs). Theoretically, this can be solved via a FE specification with dummies that pick up these effects. Yet, we did run such a regression and, while it seems to have captured some of the interaction between GDP and the published book titles, it did not perform much better than the base- line FE specification. Therefore, the second effect may be more important, i.e. the effect may vary by the number of books. In a society where books are produced
Table 1. Description of variables considered in the study
Variable Variable description Source
Dependent variable Book titles per
1,000 Annual number of new book
titles per 1,000 inhabitants UNESCO Statistical Yearbook (1963–1999).
UNESCO Statistical reports on book pro- duction in various countries (1935–1950).
UNESCO international survey of book production (1951–1977).
Independent variables
GDP GDP (1990 International Geary-
Khamis dollars) Maddison (2007).
Education Average years of total schooling Barro – Lee (2010); Foldvari – Van Leeuwen (2014); Van Leeuwen – Van Leeuwen-Li (2014).
Population Population (million) Maddison (2007); World Bank (2014).
Urbanisation Urban population (% of total) World Bank (2014).
Ruling political
ideology Dummy variable for left-wing, right-wing, centrist, independent, military rule governments
National lists of prime ministers or presi- dents, beginning with the 20th century (not a precise year, because each country had a de facto independence which varied in time, e.g. Romania in 1918, while Cyprus in 1960) until 2014. Encyclopedia Britannica; Wikipedia; World Atlas.
Duration of po-
litical regimes Number of years while left, right, centrist, independent or military political regimes were in office
Aggregation of “ruling political ideology”.
in large numbers, we can expect that a change in GDP per capita or educational attainment is less than in a country with limited book production. A proper way to allow for such heterogeneity of our data is using quantile regressions. The major practical difference between a linear regression and a quantile regression is that the coefficients of the former can be interpreted as the effect of the covariates on the average observation (a conditional expected value), while the coefficient from a quantile regression can be interpreted as the effect of a covariate on an individual belonging to a pre-defined quantile of the distribution.
The quantile method was suggested by Koenker – Bassett (1978), and was later applied to the fixed effect panels (see among others: Koenker 2004; Canay 2011;
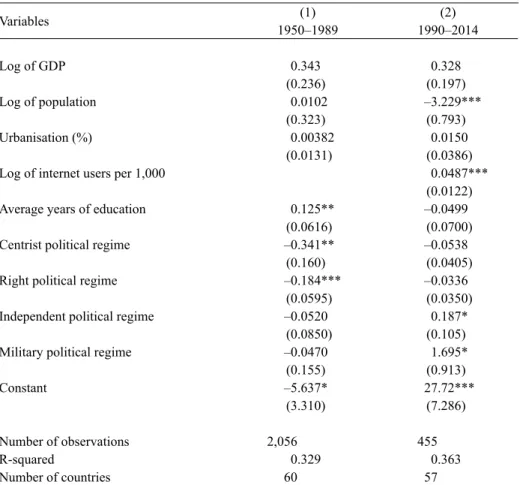
Table 2. Fixed-effect panel regressions, dependent variable: log of book titles per 1,000 inhabitants
Variables (1) (2)
1950–1989 1990–2014
Log of GDP 0.343 0.328
(0.236) (0.197)
Log of population 0.0102 –3.229***
(0.323) (0.793)
Urbanisation (%) 0.00382 0.0150
(0.0131) (0.0386)
Log of internet users per 1,000 0.0487***
(0.0122)
Average years of education 0.125** –0.0499
(0.0616) (0.0700)
Centrist political regime –0.341** –0.0538
(0.160) (0.0405)
Right political regime –0.184*** –0.0336
(0.0595) (0.0350)
Independent political regime –0.0520 0.187*
(0.0850) (0.105)
Military political regime –0.0470 1.695*
(0.155) (0.913)
Constant –5.637* 27.72***
(3.310) (7.286)
Number of observations 2,056 455
R-squared 0.329 0.363
Number of countries 60 57
Note: Robust standard errors in parentheses: *** p<0.01, ** p<0.05, * p<0.1.
Arellano – Bonhomme 2016). Recently, Powell (2015, 2016) developed a GMM estimation procedure that allows treating the endogenous explanatory variables and implemented it in R and Stata (QREGPD). Besides traditional optimisation algorithms, QREGPD also allows for a Monte Carlo Markov Chain (MCMC) optimisation suggested by Metropolis et al. (1953), using the Metropolis-Hast- ings algorithm (Hastings 1970). This Bayesian simulation method is designed to simulate multivariate distributions with a draw from a proposed distribution. The draws (and the parameters of the model) are updated in every step based on an acceptance rule, which determines the likelihood limit at which new draws are kept or discarded. The reported coefficients and standard errors are calculated from the mean and variance of the coefficients of the different draws respectively.
The advantage of relying on the MCMC optimisation is that it does not depend on some fit-statistics and the convergence problems associated with traditional optimisation problems and is also less sensitive to sample size.
We have to deal with a few issues though. First, in regard to the calculated standard errors, the choice of acceptance rule is crucial in the sense that a too high value would cause almost all draws to be rejected. The resulting sample would have far too low variance and the coefficients would have underestimated standard errors. A low value would accomplish just the opposite, resulting in a too slow convergence. For this paper, we use QREGPD default acceptance rate 0.234, which is within the optimal interval suggested by Gelman et al. (1996).
Second, since we depend on the initial values (prior knowledge) of the distribu- tion, this may cause a slow convergence to the real distribution as the number of draws increases. In order to tackle with this problem, we take a cautious approach and ignore the first 2500 draws (burn-in) and only use the last 10,000.2
A third issue to address is the potential simultaneity of book titles and aggre- gate income. This may come through two relationships. First, since book printing creates a value added, it is a part of GDP even though its share in total income is possibly negligible. Second, more books may capture the accumulation of skills that are not captured completely by our formal education variable that may result in a higher income in the long-run. In order to correct for the bias caused by such endogenous relationship, we estimate our model with the duration of political re- gimes (stability) as an instrument of GDP. Political stability affects GDP positively (Alesina et al. 1996; Asteriou – Price 2001; Carmignani 2003; Jong-A-Pin 2009;
2 Even though not considered as a disadvantage, it is important to note that for Bayesian simula- tion methods there are no standard diagnostic statistics available. In addition, as MCMC op- timisation is based on random draws, unlike standard regression techniques where the sample is fixed, one cannot obtain the same results twice, even though the results will be consistent with each other and can be used for inference.
Aisen – Veiga 2011). While political stability may be affected by the past econom- ic performance (Paldam 1998), it will not immediately react on changes in current income levels and hence, can be treated as a predetermined variable.
4. RESULTS
In this section we report the estimates from the fixed-effect quantile model.3 We show the estimated effect of the key factors in a graphical form both before and after 1990. We estimate the model for the quantiles starting with the lowest 10%
up to the lowest 90%, increased in steps of 10%.
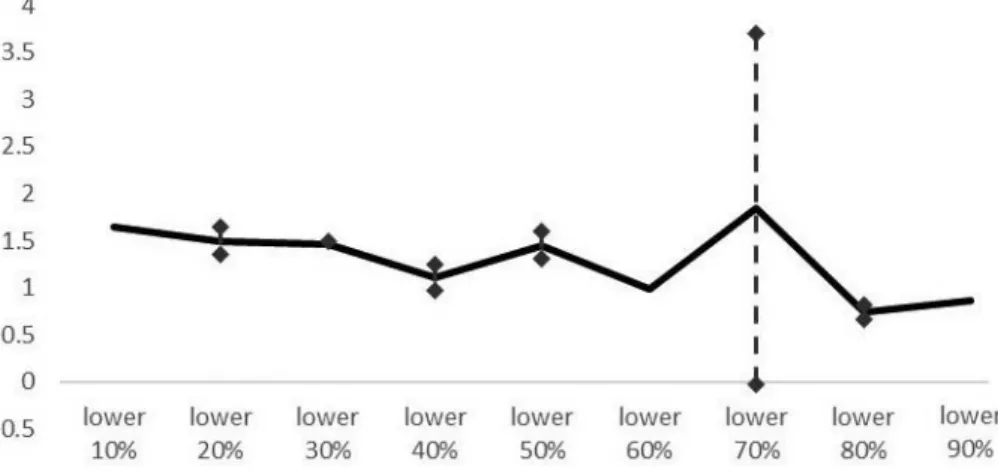
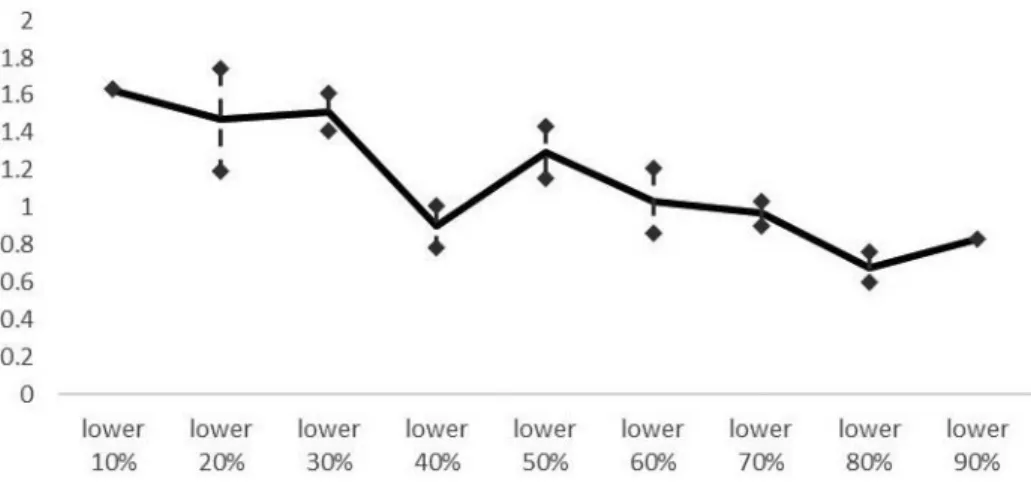
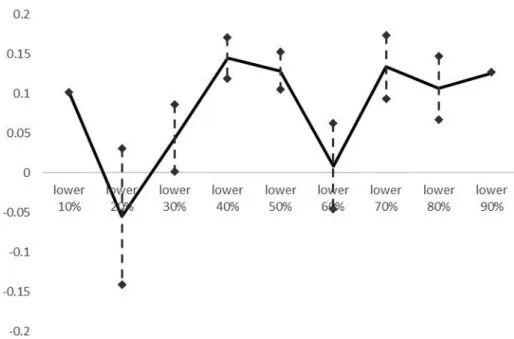
Figure 1A-B and 2A-B report the elasticities of income and education respec- tively for 1950–1990 and 1990–2014.
We did not report the other graphs since they would make this paper too big, but they can be derived from Appendix A. As one may see while comparing these figures with their instrumented versions (Figures 3A-B and 4A-B), the main trends are similar. Yet, in the absence of instrumentation, the estimated effects are smaller and also the standard errors are larger, making some of the effects statisti- cally insignificant, at least in a relative sense. Nevertheless, the main conclusion remains the same, with somewhat more statistical uncertainty.
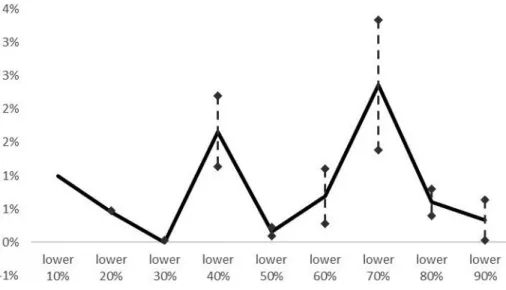
For this reason, we prefer the instrumented regressions provided below (see also Appendix B). Figures 3A and 3B report the estimated coefficients of GDP on the number of book titles per 1,000 inhabitants, which can be interpreted as the effect of a growth in per capita income on the independent variable since population is also included in the model. When endogeneity is taken care of, we find that the effect of GDP on book titles was increasing up to the median.
Above the 50th percentile, the effect starts to decrease. The explanation for this finding is straightforward: the number of new book titles is the smallest in poor countries, where an increase in income is not expected to result in a large-scale increase in the demand for books, i.e. books are considered as necessity goods.
Similarly, in the upper deciles of the distribution, the effect of additional income is also smaller. The largest effect we can expect in the middle-income countries and transition economies with book density around the median (Hjorth-Andersen 2000; Ringstad – Loyland 2006).
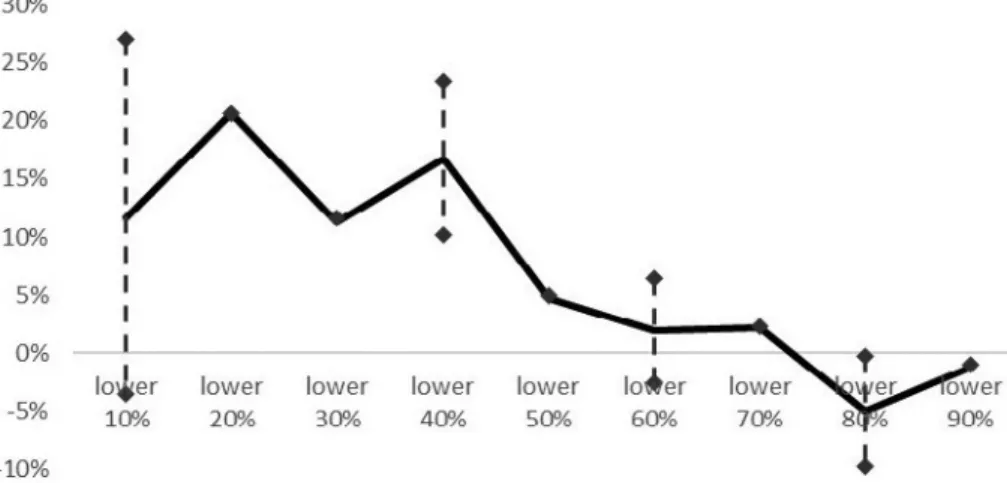
In the period of 1990–2014, the relationship changes somewhat, and the effect of income is the largest for countries in the lower quantiles, slowly decreasing as the book density grows. This suggests that the income growth in the poorest countries caused the demand for books to increase, i.e. now books react elastically
3 The details are reported in Appendix A and B.
Figure 1B. Income (GDP) elasticities of the published book titles across quantiles, 1990–2014 (without instrumentation), 95% CI reported
Figure 1A. Income (GDP) elasticities of the published book titles across quantiles, 1950–1989 (without instrumentation), 95% CI reported
Figure 2A. Effect of an additional year of educational attainment, 1950–1989 (without instrumentation)
Figure 2B. Effect of an additional year of educational attainment, 1990–2014 (without instrumentation)
Figure 3B. Income (GDP) elasticities of the published book titles across quantiles, 1990–2014 (with instrumentation)
Figure 3A. Income (GDP) elasticities of the published book titles across quantiles, 1950–1989 (with instrumentation), 95% CI reported
to a growth in income. This also implies that in the low income countries books are considered as luxury goods (see e.g. Sekkat – Achy 2004; Kenya Institute for Public Policy Research and Analysis 2009). But people will not keep buying books when income increases. Hence, just as for the pre-1990 period, for the higher income countries, we still witness lower coefficients of the effect of GDP on book titles per capita.
We have to consider that income is only a limited explanatory factor for pur- chasing books in times and regions where average income is on the rise. For ex- ample, only 4.7% of the survey respondents in China gave financial issues as the reason for not purchasing books, whereas close to 14.9% gave (lack of) literacy as a major factor (Encyclopedia.com 2007). Yet, the importance of education for reading books is nevertheless substantial as no less than 36.2% report that they read books for advancing professional knowledge and their general development.
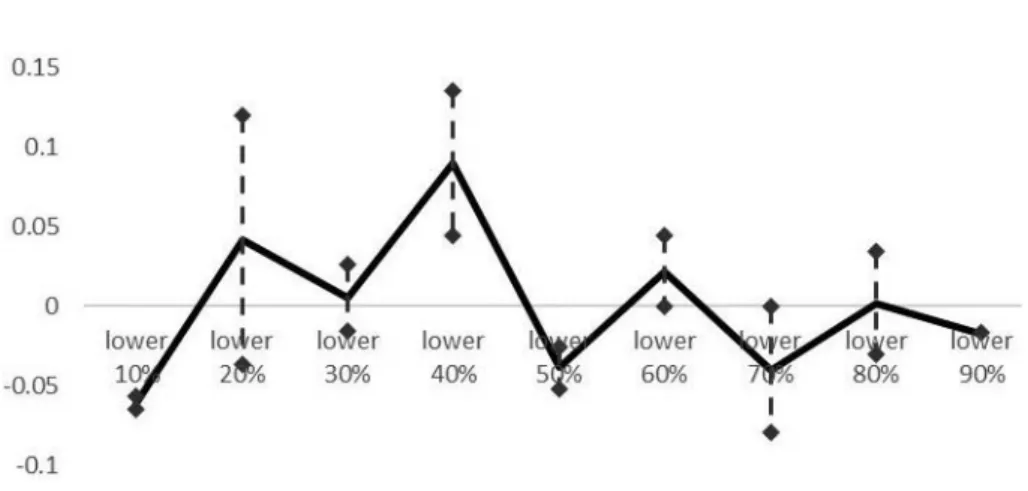
Figures 4A and 4B report the coefficients of average years of education, and again using this instrument did not fundamentally changed our findings. In the first pe- riod, we find the expected result that in the lowest quantiles additional education had a larger impact on the number of new book titles than in the higher deciles.
This is because, in the LDCs, most of the improvements in terms of educational attainment happened at the primary and secondary levels, which are most deci- sive in developing reading skills and tastes for books. As we approach towards higher quantiles, that also include wealthier countries, the effect approaches to zero. This is because, in the first-world, the majority of the population has at least completed secondary education and most of the increase in average years of schooling occurred due to the spread of tertiary education. Tertiary education may have changed the composition of demand for books (e.g. more technical and scientific books in relative terms), but it seems that it could not increase the individual demand any further.
In the period of 1990–2014, we find the continuation of the previous trend since even the poorest countries underwent a rapid expansion of education. Hence, the effect of additional schooling started to decrease even in the lower quantiles. For example, Van Leeuwen – Van-Leeuwen-Li (2014) showed that the LDC’s attain- ment in those years rose from ca. 50 to 70%. Indeed, as shown by Encyclopedia.
com (2007), there was an increased focus on textbooks, whereas the total number of books sold went down.
Thus, income and education together make up only a part of the reasons behind total book production. As shown by Encyclopedia.com (2007), the cultural and social factors are also important, including intellectual trends, consumer news and fashion. As pointed out before, these factors are highly correlated with urban- isation. In medieval Europe, urbanisation was a main driving factor behind the spread of printing and books indeed. This was partly due to the cultural reasons,
Figure 4B. Effect of an additional year of educational attainment, 1990–2014 (with instrumentation)
Figure 4A. Effect of an additional year of educational attainment, 1950–1989 (with instrumentation)
Figure 5B. Effect of urbanisation, 1990–2014 (with and without instrumentation)
Figure 5A. Effect of urbanisation, 1950–1989 (with instrumentation)
for example the different religious composition of the urban population (Prot- estantism) or the higher share of literacy. Another explanation is that the urban population had higher income on average than the rural population. Initially, this is what we find in our results: urbanisation seems to have had some positive ef- fect on the number of new titles per capita.
Yet, this story changes significantly after 1990 (Figure 5B), when the domi- nant effect of urbanisation turns negative for the lower 50% of the quantiles.
There are at least two explanations for this reversal. Firstly, the nature of urbani- sation changed globally. While initially it was a phenomenon driven by economic growth, by the 1970s it was replaced by an urbanisation caused by overpopula- tion, poverty and the growth of slums. This new urban population is more impov- erished than the rural population. Hence, its effect on the demand for books may turn negative. Secondly, the urban population is generally the first to encounter new information technology, such as tablets, mobile devices and e-books that are substitutes for books (Reid 2016). This may also result in a negative effect of urbanisation on the demand for paper-based books. In this regard, a special report from the European Parliamentary Research Service(2016)stressed that the e- book market in Germany, France, Italy, Spain and the United Kingdom enjoyed a spectacular increase from 0.1 billion euros in 2008 to 1.6 billion euros in 2014.
At the same time, the book publishing industry as a whole recorded a decrease from 17.6 billion euros in 2008 to 16 billion euros in 2014. Also, using data from the Association of American Publishers, a report conducted by Frankfurt Book Fair’s German Book Office New York showed that the sales of e-books on the US market rose by 3.8% to 3.37 billion dollars in 2014, while the hardcover books had a decline of 1.8% to a minimum 5.1 billion dollars on the book market.
Figure 6. Internet subscriber elasticity of book titles, 1990–2014 (with instrumentation)
These developments clearly show large substitution effects in the last decade of the 20th century. This could be aggravated by another substitute for the printed books, i.e. the internet. After all, people might read digital books or online news (Encyclopedia.com 2007). Yet, one has to realise that the news function of read- ing books is only a small part of its total function including leisure, enhancing job opportunities, culture, etc. In addition, website listings of books may also enhance their sales (e.g. Canoy et al. 2005; Behar et al. 2011).
Hence, the direction in which the relation runs is unclear. Indeed, we find, in line with e.g. Salsas et al. (2013), that the over-all effect of internet on the number of book titles per capita is negligible for most of the distribution (elasticities in the magnitude of 0.02–0.1).
5. CONCLUSION
Book production increases human welfare by spreading knowledge, social and cultural norms and even by enhancing the intrinsic pleasure of reading. In this paper, we test the driving factors of book production measured as the number of new titles per 1,000 inhabitants for a number of countries after 1950 which varies between 57 and 60, depending on the regression (see Table 2 “Number of countries”; Appendix A&B “Number of groups”), which drives book production, measured as the number of new titles per 1,000 inhabitants.
We find that book production was mainly driven by education in the lower quantiles, i.e. the poorer countries. Yet, this changed after ca. 1990. Whereas the effect of GDP on the number of book titles increased, the positive effect of educa- tion decreased. This is possibly because the rise above basic education increases the demand for books at a slower rate. Surprisingly, the post-1990 changes were not caused by a rise in other media such as the internet.
REFERENCES
Abramitzky, R. – Sin, I. (2014): Book Translations as Idea Flows: The Effects of the Collapse of Communism on the Diffusion of Knowledge. NBER Working Paper, No. 20023, http://www.
nber.org/papers/w20023.pdf.
Aisen, A. – Veiga, F. J. (2011): How Does Political Instability Affect Economic Growth? IMF Working Paper, No. 12, https://www.imf.org/external/pubs/ft/wp/2011/wp1112.pdf.
Alesina, A. – Ozler, S. – Roubini, N. – Swagel, P. (1996): Political Instability and Economic Growth.
Journal of Economic Growth, 1(2): 189–211.
Arellano, M. – Bonhomme, S. (2016): Nonlinear Panel Data Estimation via Quantile Regressions.
The Econometrics Journal, 19(3): C61–C94.
Asteriou, D. – Price, S. (2000): Political Instability and Economic Growth: UK Time Series Evi- dence. Scottish Journal of Political Economy, 48(4): 383–399.
Baker, M. J. – Powell, D. – Smith, T. (2014): QREGPD, Stata Code.
Barro, R. J. – Lee, J. W. (2010): A New Data Set of Educational Attainment in the World, 1950–
2010. Journal of Development Economics, 104(C): 184–198.
Baten, J. – Zanden, J. L. van (2008): Book Production and the Onset of Modern Economic Growth.
Journal of Economic Growth, 13(3): 217–235.
Behar, P. – Colombani, L. – Krishnan, S. (2011): Publishing in the Digital Era. A Bain and Com- pany Study for the Forum d’Avignon, pp. 1–20.
Burke, P. (2000): A Social History of Knowledge. Cambridge: Polity Press.
Campbell, J. R. – Voelkl, K. E. – Donahue, P. L. (1997): NAEP 1996 Trends in Academic Progress.
Washington, D.C.: National Center for Education Statistics.
Canay, I. A. (2011): A Note on Quantile Regression for Panel Data Models. The Econometrics Journal, 14: 368–386.
Canoy, M. – Van Ours, J. – Ploeg, F. van der (2005): The Economics of Books. Cesifo Working Paper, No. 1414: 1–56.
Carmignani, F. (2003): Political Instability, Uncertainty and Economics. Journal of Economic Sur- veys, 17(1): 1–54.
Charles, R. (2004): Religious Book Sales Show a Miraculous Rise. The Christian Science Monitor, April 9.
Chase-Dunn, C. – Rubinson, R. (1977): Toward a Structural Perspective on the World-System.
Politics and Society 7(4): 453–476.
Crompton, S. W. (2004): The Printing Press (Transforming Power of Technology). Philadelphia:
Chelsea House Publications.
Desmet, K. – Ortín, I. O. – Weber, S. (2009): Linguistic Diversity and Redistribution. Journal of the European Economic Association, 7(6): 1291–1318.
Dittmar, J. (2011): Information Technology and Economic Change: The Impact of the Printing Press. Quarterly Journal of Economics, 126(3): 1133–1172.
Eco, U. (2016): Chronicles of a Liquid Society. Iaşi: Polirom.
Eggert, M. – Hölscher, L. (eds) (2013): Religion and Secularity. Transformations and Transfers of Religious Discourses in Europe and Asia. Vol. 4. Leiden-Boston: Brill.
Encyclopedia.Com (2007): Supply and Demand Analysis of China’s Book Publishing Indus- try. China Book Publishing: The First Offi cial Industry Report. Http://Www.Encyclopedia.
Com/Books/News-And-Education-Magazines/Supply-And-Demand-Analysis-Chinas-Book- Publishing -Industry
Evans, M. D. R. – Kelley, J. – Sikora, J. – Treiman, D. J. (2010): Family Scholarly Culture and Educational Success: Books and Schooling in 27 Nations. Research in Social Stratifi cation and Mobility, 28(2): 171–197.
Foldvari, P. – Van Leeuwen, B. (2014): Educational and Income Inequality in Europe, Ca. 1870–
2000. Cliometrica, 8(3): 271–300.
Frankfurt Book Fair, German Book Offi ce, New York: The U.S. Book Market, Http://Buchmesse.
De/Images/Fbm/Dokumente-Ua-Pdfs/2016/Book_Market_Us_Jan_2016_56617.Pdf.
Frase, R. W. (1967): The Economics of Publishing. In: Henderson, K. L. (ed.): Trends in American Publishing. University of Illinois at Urbana-Champaign: Graduate School of Library Science, pp. 29–38.
Galor, O. (2011): Unifi ed Growth Theory. Princeton: Princeton University Press.
Galor, O. – Weil, D. (2000): Population, Technology, and Growth: From Malthusian Stagnation to the Demographic Transition and Beyond. American Economic Review, 90(4): 806–828.
Garner, T. I. – Short, K. (2004): Economic Well-Being Based on Income, Consumer Expenditures and Personal Assessments of Minimum Needs. In: Bishop, J. A. – Amiel, Y. (eds): Studies on Economic Well-Being: Essays in the Honor of John P. Formby (Research on Economic Inequal- ity, Vol.12). Oxford, U.K.: Elsevier Science, pp. 319–361.
Gelman, A. – Roberts, G. O. – Gilks, W. R. (1996): Effi cient Metropolis Jumping Rules. Bayesian Statistics, 5: 599–607.
Guthrie, J. T. – Wrigfi eld, A. (2000): Engagement and Motivation in Reading. In: Kamil, M. L.
– Mosenthal, P. B. – Pearson, P. D. – Barr, R. (eds): Reading Research Handbook, Vol. 3, Mahwah, New Jersey: Erlbaum, pp. 403–424.
Hastings, W. K. (1970): Monte Carlo Sampling Methods Using Markov Chains and Their Applica- tions. Biometrika, 57(1): 97–109.
Hjorth-Andersen, C. (2000): A Model of the Danish Book Market. Journal of Cultural Economics, 24: 27–43.
Jaba, E. (2002): Statistics. Bucharest: Economica Publishing House.
Johnson, T. M. – Zurlo, G. A. (eds) (2007): World Christian Database. Leiden/Boston: Brill.
Jong-A-Pin, R. (2009): On the Measurement of Political Instability and Its Impact on Economic Growth. European Journal of Political Economy, 25(1): 15–29.
Katsarova, I. (2016): E-Books: Evolving Markets and New Challenges. European Parliamen- tary Research Service (EPRS): 1–12, Http://Www.Europarl.Europa.Eu/Regdata/Etudes/
BRIE/2016/577954/EPRS_BRI(2016)577954_EN.Pdf.
Kenya Institute for Public Policy Research and Analysis (KIPPRA) (2009): Kenya Economic Re- port 2009: Building a Globally Competitive Economy. Nairobi.
Koenker, R. (2004): Quantile Regression for Longitudinal Data. Journal of Multivariate Analysis, 91(1): 74–89.
Koenker, R. – Bassett, G. W. (1978): Regression Quantiles. Econometrica, 46(1): 33–50.
Krashen, S. (1993): The Power of Reading: Insights from the Research. Englewood, Col.: Libraries Unlimited, Inc.
Kremer, M. (1993): Population Growth and Technological Change: One Million B.C. to 1990. The Quarterly Journal of Economics, 108(3): 681–716.
Kruif, J. de (2001): Classes of Readers: Owners of Books in 18th-Century the Hague. Poetics, 28(5-6): 423–453.
Leeuwen, B. van – Li, J. (2014): Education since 1820. In: Zanden, J. L. van – Baten, J. – D’Ercole, M. M. – Rijpma, A. – Smith, C. – Timmer, M. (eds): How was Life? Global Well-Being since 1820. Paris: OECD Publishing, pp. 87–100.
Machlup, F. (1970): Education and Economic Growth. Lincoln: University of Nebraska Press.
Maddison, A. (2007): Contours of the World Economy, 1-2030 AD. Essays in Macro-Economic History. Oxford: Oxford University Press.
Malešević Perović, L. – Golem, S. – Mihaljević Kosor, M. (2018): The Impact of Education Expen- ditures on Growth in EU28. Acta Oeconomica, 68(2): 271–294.
McKitterick, D. (1992): A History of Cambridge University Press. Printing and the Book Trade in Cambridge 1534–1698. Vol. 1. Cambridge: Cambridge University Press.
Merriam, C. E. (1931): The Making of Citizens: A Comparative Study of Methods of Civic Training.
Chicago: University of Chicago Press.
Metropolis, N. – Rosenbluth, A. W. – Rosenbluth, M. N. – Teller, A. H. – Teller, E. (1953): Equa- tions of State Calculations by Fast Computing Machines. Journal of Chemical Physics, 21(6):
1087–1092.
Meyer, J. W. – Ramirez, F. O. – Rubinson, R. – Boli-Bennett, J. (1977): The World Educational Revolution, 1950–1970. Sociology of Education, 50(4): 242–258.
Mokyr, J. (1998): Editor’s Introduction: The New Economic History and the Industrial Revolution.
In: Mokyr, J. (ed.): The British Industrial Revolution: An Economic Perspective. 2nd edition.
Boulder: Westview Press.
Mokyr, J. (2007): The European Enlightenment, the Industrial Revolution, and Modern Economic Growth. Max Weber Lecture, No. 2007/07: 1–21.
Nelson, M. Z. – Garrett, L. (2004): Gimme that Old-Time Spirituality. Publishers Weekly, March 22, S2, S4–S7.
Nkechi, M. C. (2010): Applying Marketing Concepts to Book Publishing in Nigeria, Uluslararası Sosyal Araştırmalar Dergisi. The Journal of International Social Research, 3(11): 206–212.
OECD (2002): Reading for Change: Performance and Engagement across Countries. Results from Pisa 2000. New York.
OECD (2011): How’s Life? Measuring Well-Being. Paris.
Paldam, M. (1998): Does Economic Growth Lead to Political Stability? In: Borner, S. – Paldam, M.
(eds): The Political Dimension of Economic Growth. Proceedings of the IEA Conference held in San Jose, Costa Rica. New York: St. Martin’s Press, pp. 171–193.
Plopeanu, A. P. – Foldvari, P. – Leeuwen, B. van – Zanden, J. L. van (2014): Where do Ideas Come from? The Relation between Book Production and Patents from the Industrial Revolution to the Present. European Journal of Science and Theology, 10(3): 131–147.
Powell, D. (2015): Quantile Regression with Nonadditive Fixed Effects. RAND Labor and Popula- tion Working Paper: 1–28. http://works.bepress.com/david_powell/1/
Powell, D. (2016): Quantile Treatment Effects in the Presence of Covariates. RAND Labor and Population Working Paper: 1–53. http://works.bepress.com/david_powell/4/
Reid, C. (2016): E-Books and Print Books can Have Different Affects on Literacy Comprehension.
Education Masters Thesis Paper, 325: 1–74.
Ringstad, V. – Loyland, K. (2006): The Demand for Books Estimated by Means of Consumer Sur- vey Data. Journal of Cultural Economics, 30(2): 141–155.
Salsas, P. – Den, X. le – Ficco, S. – Rohde, H. B. – Yin, S. – Halm, D. – McGarry, T. (2013): Eco- nomic Study on Publications on All Physical Means of Support and Electronic Publications in the Context of VAT (Final Report). European Commission, TAXUD/2012/DE/339: 1–144.
Sekkat, K. – Achy, L. (2004): Copyright Industries in Morocco. In: Harabi, N. (ed.): Performance of Copyright Industries in Selected Arab Countries: Egypt, Jordan, Lebanon, Morocco, Tunisia.
Geneva: World Intellectual Property Organization (WIPO), pp. 173–202.
Skelly, E. – Stabnikov, V. (1993): Russia: A Survey of the Book Market. The British Council.
Solow, R. M. (1956): A Contribution to the Theory of Economic Growth. The Quarterly Journal of Economics, 70(1): 65–94.
Towse, R. (2010): A Textbook of Cultural Economics. New York: Cambridge University Press.
UNESCO: Statistical Reports on Book Production in Various Countries, (1935–1950).
UNESCO: International Survey of Book Production (1951–1977).
UNESCO: Statistical Yearbooks, (1963–1999).
Welky, D. (2008): Everything was Better in America: Print Culture in the Great Depression. Ur- bana and Chicago: University of Illinois Press.
World Bank (2014): World Development Indicators.
APPENDIX A
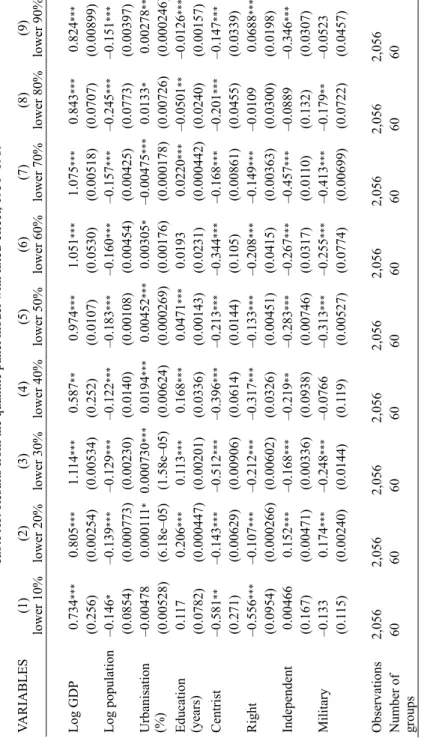
Table A1. Results from the quantile panel model with fixed-effect, 1950–1989 VARIABLES(1) lower 10%(2) lower 20%(3) lower 30%(4) lower 40%(5) lower 50%(6) lower 60%(7) lower 70%(8) lower 80%(9) lower 90% Log GDP0.734***0.805***1.114***0.587**0.974***1.051***1.075***0.843***0.824*** (0.256)(0.00254)(0.00534)(0.252)(0.0107)(0.0530)(0.00518)(0.0707)(0.00899) Log population–0.146*–0.139***–0.129***–0.122***–0.183***–0.160***–0.157***–0.245***–0.151*** (0.0854)(0.000773)(0.00230)(0.0140)(0.00108)(0.00454)(0.00425)(0.0773)(0.00397) Urbanisation (%)–0.004780.000111*0.000730***0.0194***0.00452***0.00305*–0.00475***0.0133*0.00278*** (0.00528)(6.18e–05)(1.58e–05)(0.00624)(0.000269)(0.00176)(0.000178)(0.00726)(0.000246) Education (years)0.1170.206***0.113***0.168***0.0471***0.01930.0220***–0.0501**–0.0126*** (0.0782)(0.000447)(0.00201)(0.0336)(0.00143)(0.0231)(0.000442)(0.0240)(0.00157) Centrist–0.581**–0.143***–0.512***–0.396***–0.213***–0.344***–0.168***–0.201***–0.147*** (0.271)(0.00629)(0.00906)(0.0614)(0.0144)(0.105)(0.00861)(0.0455)(0.0339) Right–0.556***–0.107***–0.212***–0.317***–0.133***–0.208***–0.149***–0.01090.0688*** (0.0954)(0.000266)(0.00602)(0.0326)(0.00451)(0.0415)(0.00363)(0.0300)(0.0198) Independent0.004660.152***–0.168***–0.219**–0.283***–0.267***–0.457***–0.0889–0.346*** (0.167)(0.00471)(0.00336)(0.0938)(0.00746)(0.0317)(0.0110)(0.132)(0.0307) Military–0.1330.174***–0.248***–0.0766–0.313***–0.255***–0.413***–0.179**–0.0523 (0.115)(0.00240)(0.0144)(0.119)(0.00527)(0.0774)(0.00699)(0.0722)(0.0457) Observations2,0562,0562,0562,0562,0562,0562,0562,0562,056 Number of groups606060606060606060 Note: 12,500 iterations, 2,500 burn-in. Robust standard errors are in parantheses. *** p < 0.01, ** p < 0.05, * p < 0.1.
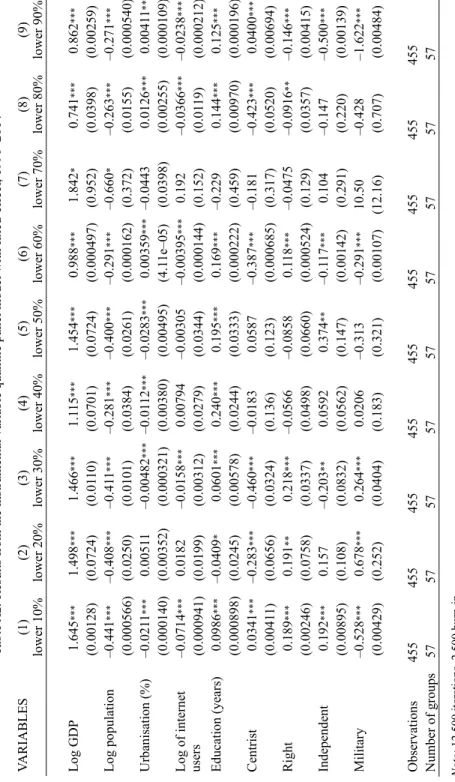
Table A2. Results from the instrumental variable quantile panel model with fixed-effect, 1990–2014 VARIABLES(1) lower 10%(2) lower 20%(3) lower 30%(4) lower 40%(5) lower 50%(6) lower 60%(7) lower 70%(8) lower 80%(9) lower 90% Log GDP1.645***1.498***1.466***1.115***1.454***0.988***1.842*0.741***0.862*** (0.00128)(0.0724)(0.0110)(0.0701)(0.0724)(0.000497)(0.952)(0.0398)(0.00259) Log population–0.441***–0.408***–0.411***–0.281***–0.400***–0.291***–0.660*–0.263***–0.271*** (0.000566)(0.0250)(0.0101)(0.0384)(0.0261)(0.000162)(0.372)(0.0155)(0.000540) Urbanisation (%)–0.0211***0.00511–0.00482***–0.0112***–0.0283***0.00359***–0.04430.0126***0.00411*** (0.000140)(0.00352)(0.000321)(0.00380)(0.00495)(4.11e–05)(0.0398)(0.00255)(0.000109) Log of internet users–0.0714***0.0182–0.0158***0.00794–0.00305–0.00395***0.192–0.0366***–0.0238*** (0.000941)(0.0199)(0.00312)(0.0279)(0.0344)(0.000144)(0.152)(0.0119)(0.000212) Education (years)0.0986***–0.0409*0.0601***0.240***0.195***0.169***–0.2290.144***0.125*** (0.000898)(0.0245)(0.00578)(0.0244)(0.0333)(0.000222)(0.459)(0.00970)(0.000196) Centrist0.0341***–0.283***–0.460***–0.01830.0587–0.387***–0.181–0.423***0.0400*** (0.00411)(0.0656)(0.0324)(0.136)(0.123)(0.000685)(0.317)(0.0520)(0.00694) Right0.189***0.191**0.218***–0.0566–0.08580.118***–0.0475–0.0916**–0.146*** (0.00246)(0.0758)(0.0337)(0.0498)(0.0660)(0.000524)(0.129)(0.0357)(0.00415) Independent0.192***0.157–0.203**0.05920.374**–0.117***0.104–0.147–0.500*** (0.00895)(0.108)(0.0832)(0.0562)(0.147)(0.00142)(0.291)(0.220)(0.00139) Military–0.528***0.678***0.264***0.0206–0.313–0.291***10.50–0.428–1.622*** (0.00429)(0.252)(0.0404)(0.183)(0.321)(0.00107)(12.16)(0.707)(0.00484) Observations455455455455455455455455455 Number of groups575757575757575757 Note: 12,500 iterations, 2,500 burn-in. Robust standard errors are in parantheses. *** p < 0.01, ** p < 0.05, * p < 0.1, respectively.
APPENDIX B
Table B1. Results from the instrumental variable quantile panel model with fixed-effect, 1950–1989 VARIABLES(1) lower 10%(2) lower 20%(3) lower 30%(4) lower 40%(5) lower 50%(6) lower 60%(7) lower 70%(8) lower 80%(9) lower 90% Log GDP0.227***0.759***1.060***0.844***1.206***0.980***0.2300.629***0.717*** (4.75e–05)(0.00211)(0.00524)(0.0613)(0.0270)(0.0456)(0.191)(0.0279)(0.0290) Log popula- tion–0.245***–0.179***–0.0903***–0.0179–0.155***–0.143***–0.271***–0.179***–0.177*** (6.62e–05)(0.000900)(0.00194)(0.0365)(0.00674)(0.0292)(0.0377)(0.00878)(0.00654) Urbanisation (%)0.00998***0.00453***1.81e–050.0166***0.00157***0.00690***0.0236***0.00601***0.00334** (7.18e–06)(0.000111)(0.000153)(0.00273)(0.000341)(0.00209)(0.00499)(0.00102)(0.00156) Education (years)0.275***0.185***0.106***0.0608***0.002480.0472***0.135***0.0656***0.00476 (4.57e–05)(0.000311)(0.00120)(0.00749)(0.00444)(0.0141)(0.0244)(0.00397)(0.00404) Centrist–0.0825***–0.0755***–0.372***–0.406***–0.194***–0.253***–0.325***–0.0675*–0.135*** (7.71e–05)(0.00825)(0.00577)(0.0310)(0.0427)(0.0505)(0.0645)(0.0404)(0.0338) Right–0.203***–0.143***–0.293***–0.294***–0.187***–0.178***–0.139***–0.0963***0.0270 (1.46e–06)(0.00153)(0.00444)(0.0239)(0.00858)(0.0182)(0.0407)(0.00808)(0.0196) Independent–0.0702***0.188***–0.201***–0.452***–0.262**–0.533***–0.0246–0.0587**–0.0759* (0.000178)(0.00914)(0.00711)(0.0679)(0.108)(0.153)(0.142)(0.0276)(0.0410) Military0.388***0.288***–0.260***–0.205***–0.324***–0.450***–0.182–0.370***–0.0443 (0.000385)(0.00180)(0.00980)(0.0596)(0.0427)(0.0591)(0.123)(0.0355)(0.0498) Observations2,0562,0562,0562,0562,0562,0562,0562,0562,056 Number of groups606060606060606060 Note: 12,500 iterations, 2,500 burn-in, additional instrument: political regime duration. Robust standard errors are in parantheses. *** p < 0.01, ** p < 0.05, * p < 0.1.
Table B2. Results from the instrumental variable quantile panel model with fixed-effect, 1990–2014 VARIABLES(1) lower 10%(2) lower 20%(3) lower 30%(4) lower 40%(5) lower 50%(6) lower 60%(7) lower 70%(8) lower 80%(9) lower 90% Log GDP1.628***1.471***1.511***0.900***1.297***1.036***0.968***0.682***0.830*** (0.00394)(0.139)(0.0513)(0.0566)(0.0698)(0.0891)(0.0343)(0.0398)(0.00168) Log population–0.438***–0.457***–0.404***–0.324***–0.379***–0.383***–0.250***–0.302***–0.270*** (0.00218)(0.0362)(0.0147)(0.0155)(0.0179)(0.0249)(0.0236)(0.0112)(0.000550) Urbanisation (%)–0.0214***0.00209–0.00526***0.00380*–0.00667**0.00891***0.0130***0.0156***0.00473*** (0.000109)(0.00622)(0.00202)(0.00214)(0.00281)(0.00198)(0.00166)(0.00183)(3.48e–05) Log of internet users–0.0609***0.04170.005400.0895***–0.0387***0.0220**–0.0402**0.00194–0.0178*** (0.00230)(0.0399)(0.0106)(0.0233)(0.00680)(0.0112)(0.0201)(0.0167)(0.000381) Education (years)0.101***–0.05480.0439**0.145***0.129***0.008780.134***0.107***0.126*** (0.000540)(0.0438)(0.0216)(0.0133)(0.0124)(0.0276)(0.0207)(0.0202)(0.000303) Centrist0.0516***–0.0150–0.375***–0.154***–0.343***–0.185***–0.144–0.168–0.0223*** (0.00753)(0.102)(0.0545)(0.0490)(0.0484)(0.0582)(0.182)(0.145)(0.00150) Right0.194***0.1420.141***–0.0711*0.0857–0.0325–0.00436–0.0295–0.118*** (0.00236)(0.195)(0.0469)(0.0408)(0.0780)(0.0388)(0.0372)(0.0272)(0.000946) Independent0.0838***0.2170.141**0.231***–0.006670.1290.128*–0.258***–0.474*** (0.0156)(0.141)(0.0603)(0.0420)(0.0782)(0.0845)(0.0697)(0.0631)(0.00354) Military–0.498***0.722*0.640***0.198***–0.236*–0.438***–0.122–0.836***–1.599*** (0.00628)(0.392)(0.100)(0.0710)(0.125)(0.149)(0.585)(0.134)(0.00193) Observations455455455455455455455455455 Number of groups575757575757575757 Note: 12,500 iterations, 2,500 burn-in, additional instrument: political regime duration. Robust standard errors are in parantheses. *** p < 0.01, ** p < 0.05, * p < 0.1.