DOCTORAL (PhD) DISSERTATION
ERJAN AKHMEDOV
UNIVERSITY OF KAPOSVAR
FACULTY OF ECONOMIC SCIENCE
DOCTORAL (PhD) SCHOOL FOR MANAGEMENT AND ORGANIZATIONAL SCIENCE
2018
DOI 10.17166/KE2019.001
UNIVERSITY OF KAPOSVAR
FACULTY OF ECONOMIC SCIENCE
DOCTORAL (PhD) SCHOOL FOR MANAGEMENT AND ORGANIZATIONAL SCIENCE
Head of the Doctoral (PhD) School PROFESSOR DR. IMRE FERTŐ, DSC.
Hungarian Academy of Sciences
Name of the principal supervisor
PROFESSOR DR. KONRAD WETZKER
CONSEQUENCES OF OIL PRICE PLUNGES FOR THE KAZAKH ECONOMY AND POSSIBLE MITIGATION
MEASURES
Written by:
ERJAN AKHMEDOV
Type of training
Scholarship-funded training - Stipendium Hungaricum Scholarship
KAPOSVÁR 2018
Table of Contents
List of figures ... 5
List of tables ... 7
List of abbreviations... 8
Introduction ... 10
1. Literature review ... 11
1.1. Consequences of oil price plunges ... 11
1.2. Economic diversification ... 15
1.3. Possible mitigation measures ... 16
1.4. Econometric model ... 19
2. Objectives of the research. Explanation of the chosen approach ... 21
2.1. Objectives of the research ... 21
2.2. Previous researches and sources used ... 21
2.3. Preliminary research plan ... 21
2.4. Preliminary conclusions of the research ... 21
2.5. Preliminary vision of results to be received through this research ... 22
3. Methods used and sources of data... 23
3.1. Approach ... 23
4. Causes of the last oil price plunge ... 24
4.1. Influx of Iraq crude oil to the market. ... 24
4.2. The US is no longer the biggest buyer of crude oil ... 24
4.3. Success of renewable sources of energy ... 25
4.4. Development and introduction of new technologies... 26
4.5. Success of energy efficiency and energy conservation efforts ... 27
4.6. Expected influx of Iran crude oil to the market ... 27
4.7. Slowdown of China’s economic development ... 27
4.8. Political instability ... 28
5. Consequences for oil-exporting and oil-importing countries ... 30
5.1. Background ... 30
5.2. Consequences for oil-exporting countries ... 31
5.3. Consequences for oil-importing countries ... 41
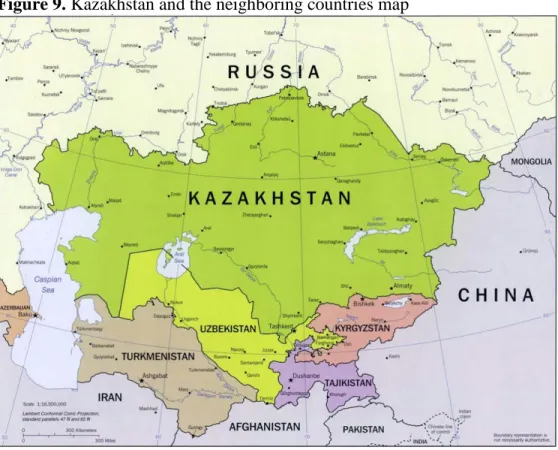
6. Situation in Kazakhstan as an oil-exporting country ... 44
6.1. Kazakhstan’s economy during the periods of low oil prices ... 44
6.2. Economic prospects ... 55
6.3. First reaction of the Kazakh economy on the last oil price plunge .... 57
6.4. Migration ... 60
7. Econometric model ... 70
7.1. Introduction ... 70
7.2. Sources of data ... 71
7.3. Software used ... 71
7.4. Data and their abbreviations ... 71
7.5. Lag selection ... 73
7.6. VAR system calculation ... 74
7.7. Analysis of the model ... 76
7.8. Conclusion ... 79
8. Scenario analysis ... 80
8.1. Scenarios under consideration ... 81
8.2. Assignment of probabilities to each scenario ... 81
8.3. Potential outcomes for each scenario ... 82
8.4. Pugh matrix ... 83
8.5. Conclusion ... 89
9. Analysis of potential mitigation measures... 91
9.1. Introduction ... 91
9.2. Main measures used by OECs’ governments to mitigate negative consequences ... 92
9.2.1. Financial and fiscal policy adjustments ... 92
9.2.2. Withdrawals from reserve assets ... 93
9.2.3. Increase of oil production ... 95
9.2.4. Economic liberalization ... 97
9.2.5. Other measures ... 99
9.3. Summary ... 100
9.4. Measures implemented by the government of Kazakhstan ... 102
9.5. Main problems, which prevent economic recovery... 105
9.6. Problems in the oil and gas industry ... 106
9.7. Economic diversification ... 107
10. Conclusions and recommendations. ... 120
11. New scientific results ... 123
12. Summary ... 124
13. Summary in Hungarian ... 125
14. Acknowledgements ... 126
15. Scientific papers and abstracts on the subject of the dissertation ... 127
15.1. Peer-reviewed papers published in scientific journals in English ... 127
15.2. Abstracts in English ... 127
16. Curriculum Vitae... 128
Bibliography... 129
Attachments ... 138
List of figures
Figure 1. World economic growth and oil price dynamics, 2003-2017…....14
Figure 2. Incremental oil production since January 2014………….…...…..25
Figure 3. US Crude Oil Production……….…….…..26
Figure 4. Average monthly Brent crude oil price, 2003-2018 (US$/bbl)…...31
Figure 5. Petroleum and refined products share in total exports, 2013 and 2016……….…………...33
Figure 6. Commodity price indices, 2000-2015 (2005=100)……..……..….34
Figure 7. 2013 External breakeven oil price curve……….………..……….39
Figure 8. 2016 External breakeven oil price curve………39
Figure 9. Kazakhstan and the neighboring countries map……….45
Figure 10. Crude oil price projections by the US EIA………...51
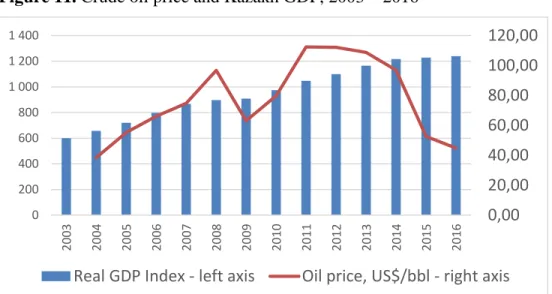
Figure 11. Crude oil price and Kazakh GDP, 2003-2016………...…...52
Figure 12. Crude oil price and Kazakh GDP changes, 2003-2016…..…..…53
Figure 13. Average oil price assumptions used in the Kazakh budget versus average annual OPEC crude oil price, US$/bbl……….56
Figure 14. Contribution of different factors to real GDP growth, 2012-15 (Percentage points)……….58
Figure 15. Oil price dynamics in 2013-2016, US$/bbl……….….59
Figure 16. Real wage index dynamics in 2013-2016……….59
Figure 17. Consumer price index dynamics, 2013-2016……….…...60
Figure 18. Export dynamics in 2013-2016, US$bn……….………...60
Figure 19. US$/KZT exchange rate dynamics in 2013-2016……….………60
Figure 20. Number of immigrants and emigrants in Kazakhstan……….…..63
Figure 21. Correlation between change in real GDP and balance of migration……….64
Figure 22. Correlation between change in real GDP and lagged balance of migration (-1 year)………..65
Figure 23. Graphic representation of the variables……….…73
Figure 24. Residuals plot the second equation (Inflation)……….…….76 Figure 25. Impulse response of inflation to a shock in oil price………78 Figure 26. Impulse response of government revenues to shock in oil price..79 Figure 27. Impulse response of export to a shock in oil price………....79 Figure 28. Dynamics of the National Fund of Kazakhstan assets, US$m.….95 Figure 29. Selected sovereign-wealth funds……….………..96 Figure 30. World Crude Oil Production Chart………….………..97 Figure 31. Crude oil prices - 70 year historical chart ...………...102
List of tables
Table 1. Petroleum and refined products share in total exports, 2013 and
2016………33
Table 2. Energy imports, net..………44
Table 3. Average oil price assumptions used in the Kazakh budget versus Average annual OPEC crude oil price, US$/bbl………56
Table 4. Contribution of different factors to real GDP growth, 2012-15 (Percentage points)……….57
Table 5. Selected Kazakhstan macroeconomic indicators, 2013-2016….….58 Table 6. Consequences of the oil price plunge and potential mitigation measures……….………69
Table 7. ADF unit root test results……….………74
Table 8. Calculation of information criteria for lag order 8……….…..74
Table 9. Calculation of information criteria for lag order 4………….……..75
Table 10. Calculation of information criteria for lag order 2………….……75
Table 11. Scenarios probabilities for 2018-2021……….….…..83
Table 12. Initial Pugh matrix……….….85
Table 13. Reduced Pugh matrix……….87
Table 14. Expanded Pugh matrix………...88
Table 15. Expanded matrix with differentiated weights………90
Table 16. Main problems in the development of oil and gas industry….…107 Table 17. 15 countries that exported the highest dollar value worth of crude oil in 2016……….………...…109
List of abbreviations
ADB – Asian Development Bank
ADF test – Augmented Dickey Fuller test
ARCH – Autoregressive Conditional Heteroskedasticity bbl – barrel
bn – billion
CCA – Caucasus and Central Asia
CIS – Commonwealth of Independent States
CITIC – China International Trust Investment Corporation CNPC – China National Petroleum Corporation
CPI – consumer price index CU – Customs Union
DEST – development of education, science and technology EBF – extra-budgetary fund
EBRD – European Bank for Reconstruction and Development EIA – US Energy Information Administration
EU – European Union
FDI – foreign direct investments GCC – Gulf cooperation council GDP – gross domestic product
HSE – health, safety and environment
HSBC - Hongkong and Shanghai Banking Corporation i.e. – id est
IEA – International Energy Agency IEF – International Energy Forum IMF – International Monetary Fund IEO – International Energy Outlook JSC – joint stock company
KZT – Kazakhstan tenge (national currency) OEC – oil-exporting country
OECD – Organisation for Economic Co-operation and Development OIC – oil-importing country
OPEC – Organization of the Petroleum Exporting Countries SDDS – IMF’s Special Data Dissemination Standard
SME – small and medium entrepreneurship UAE – United Arab Emirates
UN – United Nations
UNHCR – United Nations High Commissioner for Refugees US or U.S. – United States
USA – United States of America
USSR – Union of Soviet Socialist Republics US$ – United States dollar
VAR – Vector autoregression WTO – World Trade Organization
Introduction
The last oil prices plunge1, which started in June 2014, affected the world economies seriously. This dissertation addresses the reasons, which resulted in this situation on the world oil market. It then analyzes consequences for oil exporting and importing countries, opportunities and challenges and suggests proactive strategies that will help them to improve the situation prevalent after the sharp fall of crude oil prices of 2014. The world oil prices increased substantially in 2018, however, this increase (as all previous increases and decreases) is temporary as oil prices continue to be volatile.
Therefore, this topic and the recommended measures remain important. This work is focusing on Kazakhstan. As additional examples it is also dealing with Azerbaijan as oil-exporting country and Turkey and China as oil-importing countries. Other countries are also considered, but to a lesser extent.
As stated in the Research Plan the objective of the research is the preparation of development scenarios and recommendations for assisting government organizations of Kazakhstan in tackling the consequences of the oil crises. The author is of the view that the preparation of sound econometric models and development scenarios will help to better understand future consequences of oil price plunges for both oil-exporting and oil-importing countries. He is also inclined to believe that these models and scenarios will help in the development of proactive strategies of responding to such crises.
1 Words “plunge”, “slump” and “negative oil shock” are used interchangeably throughout this document.
1. Literature review
1.1. Consequences of oil price plunges
The influence of oil price plunges, i.e. substantial declines, similar to the ones happened in 1973, 2008 and 2014 on the global economy has long been observed and studied by different authors. The best description was probably made by Yergin (1992). It is also important to mention the seminal work of Hamilton (1983) who pointed out that “All but one of the U.S.
recessions since World War II have been preceded, typically with a lag of around three-fourths of a year, by a dramatic increase in the price of crude petroleum”. The same was reconfirmed by Brown and Yücel (2002) “rising oil prices preceded eight of the nine post-WWII recessions” (the authors means the recessions in the USA). Ebrahim et al (2014) provided a review of the interactions between global macroeconomic performance and oil price volatility. They recommended policies aimed at mitigating and building resilience to the economic uncertainty advanced by oil price volatility.
The number of scientific publications dedicated to the last oil price plunge and its consequences is relatively small as the new situation emerged in June 2014 only. However they already exist and have been studied thoroughly. They include the works by Baffes et al (2015), who delivered an analysis of the reasons, which led to the last oil price plunge and addressed its macroeconomic, financial and policy consequences. Another analysis was undertaken by Baumeister and Kilian (2016b) who also studied the predictability of oil price plunges. However, the same authors admit that oil price shocks “remain difficult to predict, despite economists' improved understanding of oil markets” Baumeister and Kilian (2016a). An attempt was made “to explore the policy reactions taken in major oil producing countries during these (previous) historical oil price collapses to understand what actions can be taken to navigate the current period of low prices” Luk (2017). In addition to the oil price shock consequences, Schenkkan (2015) also
considered the impact of the economic crisis in Russia on Central Asian countries and stated that “Due to its close economic relationship with Russia and its heavy dependency on oil exports (an estimated 69 percent of exports in 2014), Kazakhstan has been the hardest hit in the region”. This work further developed upon difficulties of making any predictions pointing out that “What is certain is that the crisis is only in its early stages, and that none of the governments in the region (Central Asian region) have the resources to avoid it. At a minimum, the crisis will cripple public spending and result in more lost years in a region that never recovered from the post-Soviet collapse in infrastructure, social services, and education.”
Another attempt to study the situation in the Central Asian and Caucasus was made by Aleksandrova (2016) who pointed out that “The negative impact of oil price prompted CCA (Caucasus and Central Asian) countries to set new priorities for economic development aimed at restructuring their economic and financial systems and improving bank regulations in order to curb the effects of low oil prices and overcome external shocks.” and concluded that “The future economic outlook of the oil-exporting counties in the CCA region depends on the advancement and effective implementation of these reforms and policies”.
Attention has been paid to the publications of international financial institutions as they are usually very quick in reacting to major global economic developments. One of the first publications on this topic was Husain et al (2015). However, expectations expressed in this document did not materialize.
For instance, the document mentions that “The fall in oil prices in the second half of 2014 is expected to result – absent a change in other macroeconomic conditions – in a boost to global economic activity in 2015–16.” The same point of view was shared by some researchers like Wang and Li (2016) who emphasized that “declining oil prices would lead to higher economic growth”.
This never happened in reality and the same institution IMF later provided contradicting information (see Figure 1 below).
Figure 1. World economic growth and oil price dynamics, 2003-2017
Source: own construction based on IMF and Bloomberg data
Two publications were particularly interesting. A systematic approach to the current economic situation and growth prospects for developing Asia is given by The Asian Development Bank (2017). It is worth mentioning that Kazakhstan as well as other countries considered in this dissertation are the member countries of the Asian Development Bank. The World Bank (2015) analyzed the macroeconomic situation in Kazakhstan after the beginning of the price decline and strongly recommended to focus on attracting foreign direct investments into non-extractive industries. In addition to the usual description of the reasons of the oil price shock and analysis of consequences, Kitous et al (2016), which is a science for policy report by the Joint Research Centre, the European Commission’s in-house science service, employed descriptive statistics “to show the exposure of the main oil exporting countries to the oil
0 20 40 60 80 100 120
-1 0 1 2 3 4 5 6
2003 2004 2005 2006 2007 2008 2009 2010 2011 2012 2013 2014 2015 2016 2017
World economic growth, % (left axis) Oil price, US$ per barrel (right axis)
price, where GDP and government revenue is found to be closely correlated to the oil price.”
Consequences of oil price fluctuations on economies of both oil- exporting and oil-importing countries have been studied by different scientists and the relevant literature can be divided into two main groups.
The first and the biggest part focuses on the influence of oil prices on economic activity of oil-importing countries. The general conclusion of Hamilton (1983), Lee et al (1995), Hamilton (1996), Bernanke et al (1997), Abeysinghe (2001), Jiménez-Rodríguez and Sánchez (2004), Cunado et al (2015) and others is that there is a negative correlation between increases in oil prices and the subsequent economic downturns and vice versa in oil importing countries.
Aside from the substantial amount of publications related to the effect of oil price movements on the economies of developed countries, there is a growing number of publications describing the influence of oil price shocks on developing countries. We can mention the works of Sachs and Warner (2001), Tang et al (2010) and Hou et al (2016). Aastveit et al (2015) noticed that
“demand from emerging economies (most notably from Asian countries) is more than twice as important as demand from developed countries in accounting for the fluctuations in the real oil price and in oil production.”
The second part of the relevant literature conversely investigates the influence of oil price shocks on oil-exporting countries and finds that generally there is a positive relationship when increases in oil prices are followed by higher economic activity in oil-exporting countries. It is worth mentioning such important works as Jimenez-Rodriguez and Sanchez (2005), Bjornland (2009), Korhonen and Mehrotra (2009), Ftiti et al (2016) and several others who found a positive effect of higher oil prices on the economies of major oil- exporting countries.
Migration has or can become one of the most important consequences of oil price plunges. Kitous et al (2016) assessed a “possible migratory flows due to potential political and economic instabilities in oil exporting countries”
(caused by oil price plunges). They conclude that “An economic or political instability induced by low oil export prices is not assumed to be the only exploratory factor driving migrations, but may be an important driver in certain cases.”
1.2. Economic diversification
Studying what have been done in this area by other authors, we see that there is a substantial number of examples confirming that in spite of numerous appeals, such efforts in different countries usually fail.
For example, the famous writer and politician Pietri (1936) appealed for diversifying the Venezuelan economy using oil revenues in his famous article “To Sow the Oil” published back in 1936. Unfortunately, nothing has been done so far in terms of diversification of the Venezuelan economy and now the country is facing one of the harshest crisis in its history.
Hvidt (2013) noted that “over the last five decades, the GCC2 states have taken a number of important steps on the route to diversifying their economies away from dependence on oil and gas… Data shows, however, that the countries remain in a position where the oil sector continues to dominate the economy, and that few of the industries and services established would survive in a post-oil era... Viewed in this manner, the diversification strategy has largely failed.”
This opinion is shared widely. Adelaja (2016) mentioned that “For more than a decade, Russia has been attempting to diversify, innovate and modernize its economy, but its efforts thus far have failed to come to fruition.”
2 GCC - Gulf Cooperation Council. Its member states are Bahrain, Kuwait, Oman, Qatar, Saudi Arabia, and the United Arab Emirates.
“Nigeria's over dependency on oil has contributed to the poor management of human capital/resources which has led to the migration of many talented citizens of the country to other countries in search of better life. Furthermore, the data show that the neglect of agriculture has, in addition, led to the constant depreciation in GDP of the country” advised Uzonwanne (Uzonwanne, 2015).
Bhaskaran (2007) admitted that “Brunei Darussalam has explicitly stated economic diversification as a major policy objective at least since the Third National Development Plan (covering 1975-1979) although references to the need for economic diversification go back as far as the Second National Development Plan (1962-1966). As part of the planning and conceptualization process for the various efforts at diversification, many studies have been commissioned, all of which have been well formulated with specific projects and recommendations. Yet… these efforts do not seem to have produced the desired results…”
Tombe and Mansell (2016) also addressed this important topic “But does diversification even matter? Economists, for centuries, have found gains from specializing in areas where we have a comparative advantage.
Subsidizing certain selected industries therefore risks causing economic damage by distorting activity and displacing workers and investment from more valuable uses. Policy-makers should therefore focus on neutral policies:
create a favorable investment climate, facilitate adjustment and re-training, encourage savings (including by government), and so on.”
1.3. Possible mitigation measures
Studying what have been done in different oil-exporting countries for overcoming negative consequences of oil price plunges by other authors, we see that this subject generates a big interest among scientists, governments, financial institutions and the general public.
In general, developing countries have found it difficult to use natural resource wealth to improve their economic performance. As stated by Venables (2016) “Utilizing resource endowments is a multistage economic and political problem that requires private investment to discover and extract the resource, fiscal regimes to capture revenue, judicious spending and investment decisions, and policies to manage volatility and mitigate adverse impacts on the rest of the economy.”
Very interesting analysis of how the oil price decline affected the OECs was made by Kitous et al (2016) “a 60% price fall, which is a stylized representation of the oil market change over the last two years. The results show that such an oil price drop has different effects across oil exporting countries, unsurprisingly strongly correlated with export dependence to oil. For instance, a 60% fall in the price of oil could lead to a reduction of the GDP of Sub-Saharan Africa by around 8.5%. Russia’s negative impact would lie around 4.4% and in Central Asia and Caucasus to 15.2%. Traditional oil producers would also have a substantial negative impact (-14.5% for Saudi Arabia and about -8.6% for Kuwait and the UAE), softened in their case by the substantial size of their reserves per capita, relative low exploitation costs, and large SWFs3.”
Mathew (2000) pointed out that “At current oil export levels, Iran loses about $1 billion per year in oil export revenues for every $1 drop in oil prices.
A serious implication of the decline Iran’s oil export revenues has been lack of available cash for much-needed investment in the country's oil sector. As a result, Iran is looking towards Western capital markets as a source of capital investment.”
Aleksandrova (2016) noticed that “The CCA (Caucasus and Central Asian) governments of the oil exporting countries developed diverse structural
3 SWF – sovereign wealth fund
programs consisting of proactive monetary and fiscal adjustment measures aimed at economic recovery. These measures were intended to diversify the countries’ economies, deal with the weakened fiscal and external positions, balance consumption and improve the financial situation. Stabilization funds were also used to cover budget deficit and to finance domestic public investments.”
Mohn (2016) addressed the matter of resource revenue management in Norway stressing that “The design of the Norwegian model of resource revenue management is motivated by concerns for macroeconomic stability in the short term, and competitiveness, tax and consumption smoothing in the long term.”
However, the Norwegian case is very different and cannot be easily replicated in other countries. This is the reason why Eckardt et al (2012) studied the fiscal management of natural resource revenues in a developing country setting advising that “Rule-based fiscal frameworks offer strong benefits to countries that are generating significant government revenue from extractive industries. As commitment devices, these frameworks can reinforce fiscally responsible economic management, contain volatility, and preserve fiscal savings for future generations.”
There are different opinions on this topic. An interesting set of possible strategies that oil-exporting countries can follow in the future carbon- constrained world is suggested by Van de Graaf and Verbruggen (2015). They include “quota agreements, price wars, efficiency, compensation, and economic diversification”. In any case, the author of this dissertation is of the view that new approaches have to be developed.
A practical approach to oil wealth management in Kazakhstan was presented by Aitzhanova et al (2015). A set of well-balanced and important measures was suggested in this study for the Kazakh government, however, the oil price plunge, which started in June 2014 made the implementation of
these recommendations impossible. Most of the suggested measures look essential up to now. They include the need for the Kazakh government should
“adopt a conservative strategy of oil production in order to prolong the sustainability of … oil reserves”, “adopt a more stringent discipline in controlling its budget particularly the current expenditures”, “consider combing the guaranteed and targeted transfers from the National Fund into a clear and systematic fiscal rule”, “provide an explicit public exposure and accountability about the allocation and utilization of targeted transfers from the National Fund”, “incorporate a countercyclical component in the annual transfers from the National Fund” and “formation of an Independent Committee of Experts”. At the same time, some measures like economic diversification and import substitution look questionable.
1.4. Econometric model
The effect of oil price shocks on macroeconomic indicators has been studied in different scientific literature sources. Even though the developed countries received much more attention, there is growing number of attempts to study the dependence between oil price shocks and macroeconomic performance in developing countries. For instance, Hou et al (2016) investigated the transmission mechanism of oil price shocks in an oil-exporting economy. Cunado et al. (2015) addressed macroeconomic impacts of oil price shocks in Asian economies covering not only such developed countries as Japan and Korea, but also India and Indonesia. Filis and Chatziantoniou (2014) used structural VAR to investigate the financial and monetary policy responses to oil price shocks in several European countries and Russia.
Relevant literature refers to VAR as an optimal model for studying oil- macro relationship in Kazakhstan. The amount of relevant literature is not substantial, but still there are several attempts to explore this subject including the works of Gronwald et al (2009), Kose and Baimaganbetov (2015) and Nurmakhanova (2016).
Kose and Baimaganbetov (2015) studied the “effects of real Brent oil price shocks on the industrial production, real exchange rate and inflation in Kazakhstan are examined by using a SVAR model” for the period from 2000 and 2013 applying structural vector autoregressive model (SVAR). Gronwald et al (2009) assessed the macroeconomic consequences of oil price shocks for the Kazakh economy from 1994 to 2007 applying a standard linear VAR model and Nurmakhanova (2016) used quarterly data from 2000 to 2014 to estimate the Bayesian VAR model. So, none of them examined the influence of the last oil price plunge on the Kazakh economy.
In the analysis of other countries VAR also used widely and different literature sources refer to VAR as to the main instrument in studying the effect of oil price shocks on macroeconomic indicators in different countries. For example, Eltony and Al‐ Awadi (2001) used a vector autoregression model and a vector error correction model to examine the impact of oil price fluctuations on key macroeconomic variables of Kuwait. Firoozi et al (2016) applied VAR to explore the effects of the uncertainty of oil prices on macroeconomic variables of Iran. Van Robays (2016) used VAR model to obtain results which “show that higher macroeconomic uncertainty, as measured by global industrial production volatility, significantly increases the sensitivity of oil prices to shocks in oil demand and supply. This occurs as uncertainty lowers the price elasticity of oil demand and supply.” There are other authors who used VAR for similar purposes including Al-Abri (2013), Ftiti et al (2016) and many others.
2. Objectives of the research. Explanation of the chosen approach
2.1. Objectives of the research
Preparation of economic development scenarios and development of recommendations for assisting government organizations (mostly Kazakh) in tackling the consequences of the oil price plunges.
2.2. Previous researches and sources used
Description of previous researches on this or similar subjects is covered in the Literature review part of this document (above). The amount of researches is relatively small as the new situation emerged in 2014 only.
Sources used include, but are not limited to scientific research papers, statistical data of national statistical bureaus and international institutions (World Bank, IMF, ADB, etc.); data and analytics published by consultants and professional associations (IEA, IEF, OPEC, etc.).
2.3. Preliminary research plan
1. Studying the situation. Data collection;
2. Systematization and analysis of collected data;
3. Preparation of development scenarios;
4. Analysis and verification of the development scenarios. Selection of the most likely scenario;
5. Econometric analysis;
6. Preparation of recommendations for assisting government organizations of Kazakhstan in tackling the consequences of the current oil crisis.
2.4. Preliminary conclusions of the research
Even though this chapter was written at the end of 2015 and beginning of 2016 these preliminary conclusions are still valid. Obviously, the situation has changed substantially and spring 2018 witnessed a substantial increase of
oil prices. However, oil prices continue to be volatile and the country has to be prepared to future oil price slumps. So, the results of this dissertation can and will be used in the case of another expected oil price plunge.
In the mid-term (5-10 years) oil-exporting countries in general and the Republic of Kazakhstan in particular will be facing the period of economic decline (if oil prices would not rise again), which will result in serious cuts of public expenditures, substantial deterioration of living standards and growth of public discontent. It will be the responsibility of national governments to react properly;
The situation in oil-importing countries in the same period will be substantially better; however the size of economic benefits received through decreased crude oil prices will not directly correlate with the oil prices plunge. The market situation is becoming more complex and the paper addresses and analyses it;
There is a need to develop new approaches for understanding market drivers and their results. This document is attempting to achieve this goal;
Recommendations: The current document provides recommendations (below) and is aimed at helping the Kazakhstan national government and the governments of other OECs in responding the crisis.
2.5. Preliminary vision of results to be received through this research
Theoretical basis for understanding the new situation of energy sector development in Kazakhstan and other oil-exporting countries, its consequences and future developments of the energy market;
Recommendations for assisting Kazakhstan government organizations in tackling the consequences of the current crisis.
3. Methods used and sources of data
The following methods have been used in this research:
• Econometric analysis
• Expert assessment;
• Scenario analysis;
• Comparative country analysis.
3.1. Approach
The dependence of selected macroeconomic variables on oil price movements are studied using vector autoregressive (VAR) model, which is an econometric model used to capture the linear inter-dependencies among multiple time series.
The research also employs the method of scenario analysis. The author is considering 3 oil price scenarios explained below. Probabilities for each scenario are assessed through interviewing 30 oil industry experts.
The time period under consideration is 19 years (14 years prior and 5 years into the future). The statistical data are for the period from 2003 to 2016.
The earlier data are not considered because the country joined the International Monetary Fund's Special Data Dissemination Standard (SDDS)4 in 2003 and to achieve this the country amended some methodologies of data collection and processing. The data for 2017 are not yet available in full.
Sources of data include the Committee on Statistics under the Ministry of National Economy of the Republic of Kazakhstan, the National (Central) Bank of the Republic of Kazakhstan, the World Bank, US Energy Information Administration (EIA), International Energy Agency (IEA), International Monetary Fund (IMF), European Bank for Reconstruction and Development (EBRD), Asian Development Bank (ADB), Bloomberg, Massachusetts Institute of Technology Media Lab, Halyk Finance JSC and several others.
4 https://www.imf.org/en/News/Articles/2015/09/14/01/49/pr0348
4. Causes of the last oil price plunge
With few exceptions, the last oil price plunge affected the economies of oil-exporting countries in a very negative way. This is why it is important to look into the reasons that led to the last oil price plunge. These reasons may be summarized as follows:
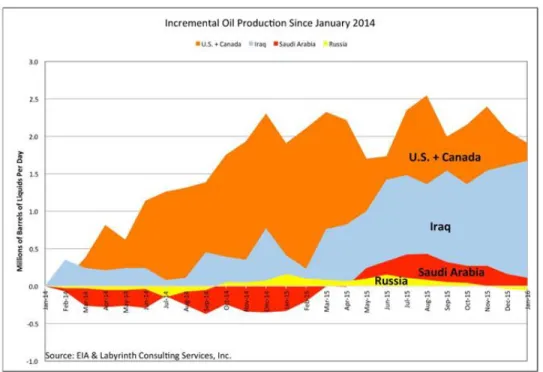
4.1. Influx of Iraq crude oil to the market.
Contribution of the influx of Iraq crude oil is well explained by the chart below
.
Figure 2. Incremental oil production since January 2014
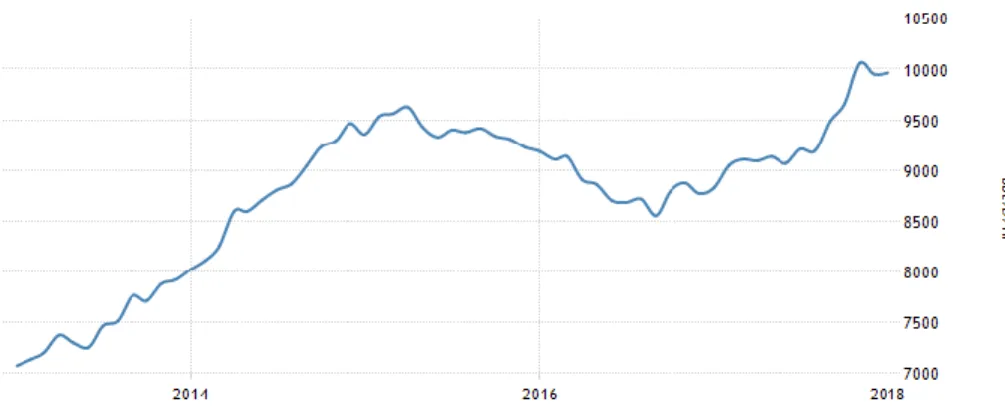
4.2. The US is no longer the biggest buyer of crude oil
The US transition from one of the biggest importers of crude oil satisfying only 70 per cent of its energy needs from domestic sources as recently as in 2005 to 90 per cent in 2014 and to lifting its crude export ban at the end of 2015 became one of the biggest contributors to the current situation.
As you can see from the chart below, the US crude oil production grew from 7.1 million barrels a day in 2013 to practically 10 million barrels a day in the
first half of 2018, which represent more than 40% increase. This is also an important signal for the market and could be a long-term game changer.
Another important point is the psychological effect of this action on the market players.
Figure 3. US Crude Oil Production
4.3. Success of renewable sources of energy
Even though the World now depends heavily on hydrocarbon sources of energy (mainly oil, gas and coal) to meet its energy needs, British Petroleum (2018) informs that “Renewables do, however, play a significant role in the growth of electricity, contributing almost 50% of the growth in global power generation in 2017.
At the individual country level, these sources are already playing an important role in some countries. Denmark leads, with 68% of power coming from renewables. Among the larger EU economies, the renewables share in power is 30% in Germany, 28% in the UK, 25% in Spain, and 23% in Italy.
The rapid growth of renewable power generation continued in 2017, with an increase of 17%. In volume terms, the largest increase in 2016 was in China, followed by the US; with Germany, Japan, and India making up the rest of the top five.”
This is happening mainly because of these three reasons:
1. The costs of renewables utilization are coming down rapidly making them more commercially attractive for end users.
2. The utilization of conventional energy sources based on burning fossil fuels has a negative impact on the environment.
3. Another problem with these sources of energy is that they are not renewable. The more they are extracted, the more they are becoming expensive to retrieve.
As a result, the utilization of green or renewable energy sources, which are continuously replenished and do not give an adverse impact on the environment, is constantly growing. The growing use of renewables deliver a very important message to all the market players forming their expectations of further oil prices fluctuations.
4.4. Development and introduction of new technologies
Technological development has profoundly affected costs, quality and environmental impact of energy generation. A good example for this is the development of new technologies, which made the production of shale oil and gas commercially attractive. This allowed the USA to again become one of the largest oil and gas producers. The inflow of shale oil to the market has become one of the main reasons, which led to the oil price plunge of June 2014. There are so many other new technological developments, which affected the market.
They include, for example, the combined-cycle gas turbines (CCGT), cogeneration of heat and power in modular, small-scale energy systems, wide- spread application of information technologies, etc.
And there is much more to follow. Future energy options may include controlled thermonuclear fusion, fuel cells, etc.
4.5. Success of energy efficiency and energy conservation efforts
Another very important and often omitted factors are energy efficiency and energy conservation. As rightly mentions Stephan Kohler, president of German energy agency Dena, these aspects are the "most misunderstood of the energy transition, and yet the ones that work best.” Other countries also provide excellent examples: California’s efficiency success has avoided the amount of power needed from 30 power plants thus far and is expected to avoid another 11 power plants’ worth of electricity over the next decade because cutting energy waste reduces the need to generate power from fossil fuel power plants.
4.6. Expected influx of Iran crude oil to the market
The influx was expected after lifting the sanctions imposed by the United States, European Union and United Nations. The sanctions were actually lifted on 16 January 2016 in exchange for curbs on Iran's nuclear program, but discussions of this possibility started earlier and seriously contributed to the negative oil price shock expectations. Possessing huge reserves of quality crude oil, Iran, which was several years ago pushed from the international markets out, was and is very keen to get back its market share.
Market players were expecting that in order to achieve this goal the country would apply dumping strategy pushing oil prices further down. It did not happen because the relations between the USA and Iran remained strained and in May 2018 President Trump announced that the USA quits the Iran nuclear deal.
4.7. Slowdown of China’s economic development
This is a very important factor, which actually raises red flags for the global economy. There were a growing number of pessimistic forecasts of China’s further economic development. For instance, in 2014 Fitch rating agency warned that a sharp slowdown in China's GDP growth rate to 2.3
percent during 2016-2018 would keep commodity prices low for longer than expected period of time. This forecast did not materialize either. Vice versa, in January 2018 the International Monetary Fund raised its forecast for China's economic growth in 2018 to 6.6%, up from the 6.5-percent prediction made in October 2017.
4.8. Political instability
Growing political instability in the world, which initially pushed oil prices up, then forced oil importing countries to reduce their dependence on foreign energy supplies. This is yet another market driver and yet another expectation, which decreased global oil prices.
In any case, we should not underestimate the uncertainty of the oil market, which has many times shown that most of expectations regarding it behavior appear to be wrong. This issue has been studied by many authors, for example Allsopp and Fattouh (2011) point out that “In the longer term, the uncertainties remain very great, especially since the tensions between a realist view of likely energy-market developments and the imperatives of the climate change agenda remain unresolved”, but the current paper does not concentrate on this issue. The same view is shared by US Energy Information Administration (2016) “Expectations for future world oil prices are another key source of uncertainty in the IEO2016 projections” and Baumeister and Kilian (2016a) “Although our understanding of historical oil price fluctuations has greatly improved, oil prices keep surprising economists, policymakers, consumers and financial market participants.”
In normal times, the broad effects of the oil price drop on the global economy are well known. It should act as an international stimulus that will nevertheless redistribute heavily from oil producing countries to consumers and the longer the new prices endure; the more profound will be the effects on the structure of industries across the world. Examples of such effects may be the increase of global economic growth and removal of fossil fuel subsidies.
But this time, economists are actively debating whether the world has changed and other moving parts - such as falling inflation levels and the strong dollar - will affect the usual economic relationships. This time there are more voices than usual suggesting expectations of a global boost are deceptive.
“Stephen King, chief economist of HSBC, believes lackluster demand in China, Japan and Europe over the summer of 2014 was the primary cause of the collapse in prices so the traditional “lower oil prices good: higher oil prices bad” story is “no longer so obviously true”. He then argues that optimism following an oil price fall in economic estimations is based on positive supply- side developments for the western developed world, but “there are plenty of situations where falling oil prices are merely symptoms of a wider malaise”5. There is one more, probably the most important point to be taken into consideration: we have mostly extracted the cheapest-to-extract oil. It takes more and more human efforts, capital, etc. to produce a given number of barrels of oil equivalent. It is expected further growth of oil production costs in the future. However, the uncertainties surrounding the oil market prevent from making any serious projection about oil prices.
5 https://www.ft.com/content/3f5e4914-8490-11e4-ba4f-00144feabdc0
5. Consequences for oil-exporting and oil-importing countries
5.1. Background
The previous researches of the consequences of oil price slumps were addressed in the Literature review part of this dissertation. In this chapter, an attempt to study the consequences of negative oil price shocks is presented.
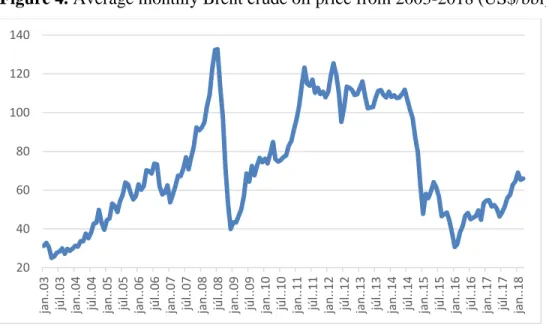
The chart below illustrates crude oil price movements by the beginning of 2018. Just over the last 10 years the oil price exceeded US$130 per barrel in the first half of 2008 and dropped up to almost US$40 per barrel in the second half of the same year. It gradually grew again and exceeded US$100 per barrel staying at this level for several years. Then another oil price plunge started in June 2014. Obviously, these sharp and unpredictable oil price shocks affect the global economy because oil remains the major energy source and an important raw material for chemical industry throughout the world. This chapter is devoted to consequences of these fluctuations for oil-exporting and oil-importing countries.
Figure 4. Average monthly Brent crude oil price from 2003-2018 (US$/bbl)
Source: US Energy Information Administration
20 40 60 80 100 120 140
jan..03 júl..03 jan..04 júl..04 jan..05 júl..05 jan..06 júl..06 jan..07 júl..07 jan..08 júl..08 jan..09 júl..09 jan..10 júl..10 jan..11 júl..11 jan..12 júl..12 jan..13 júl..13 jan..14 júl..14 jan..15 júl..15 jan..16 júl..16 jan..17 júl..17 jan..18
5.2. Consequences for oil-exporting countries
The dissertation mainly focuses on Kazakhstan, but in this chapter the effects of oil prices decline for oil-exporting are considered on examples of Azerbaijan and Kazakhstan. This provides a better picture of the situation.
Economic consequences
The oil and gas industry plays an important role in the economic development of Kazakhstan and Azerbaijan. It is one of the main drivers of GDP growth and an important source of national budget revenue for both countries.
In Kazakhstan, the share of oil and gas industry in total GDP increased from 10.9% in 2001 to 25.2% in 2012 making it the main driver of national economy. By the beginning of 2016 this share again decreased to about 20%
of GDP, but this happened because of the decrease of world prices on these commodities only6.
In Azerbaijan, the contribution of hydrocarbons to GDP is even higher, with about 50% of GDP, despite the government’s intentions to reduce this level.
Worth pointing out that numerous attempts of the governments of both countries to diversify their economies failed. Lower profitability of non-oil sector7 and wide-spread corruption are the main reasons for the failures. For example, Asian Development Bank (2013) stated that “the (Kazakh) economy is less diversified today than it was 10 years ago”. The situation with economic diversification in Kazakhstan will be further developed in this dissertation.
6
http://www.ey.com/Publication/vwLUAssets/Kazakhstan_oil_and_gas_tax_guide_2014/$FI LE/EY-Kazakhstan_oil_and_gas_tax_guide_2014.pdf
7 Per the information of the Ministry of Oil and Gas of Kazakhstan, the profitability of oil companies within the period from 2007 to 2011 varied from 126% to 158% with an exception of 2009 when the profitability dropped down to 67%. This drop was conditioned by the world economic and financial crisis. No later data is available.
Revenues from the oil and gas sector generate a half of fiscal revenues of Kazakhstan. On 1 September 2016 the Kazakh president pointed out that the export of oil makes about 60% of the country’s total exports (other exports include mainly non-ferrous and ferrous metals and grain).
Table 1 below illustrates the dependence of several oil-exporting countries on oil and gas industry and the change of the share of petroleum and refined products in total exports since the beginning of the oil price plunge.
The change in this share is stipulated by the decrease in global oil prices.
Table 1. Petroleum8 and refined products share in total exports, 2013 and 2016
Country 2013 2016 % of change
Azerbaijan 93.4% 88.9% -4.8%
Kazakhstan 68.4% 59.4% -13.2%
Norway 62.5% 43.0% -31.2%
Russia 63.0% 44.7% -29.0%
Saudi Arabia 89.8% 64.2% -28.5%
Figure 5. Petroleum and refined products share in total exports, 2013 and 2016
8 Petroleum, complex mixture of hydrocarbons that occur in the Earth in liquid, gaseous, or solid forms. The term is often restricted to the liquid form, commonly called crude oil, but as a technical term it also includes natural gas and the viscous or solid form known as bitumen, which is found in tar sands. The liquid and gaseous phases of petroleum constitute the most important of the primary fossil fuels.
0,00%
10,00%
20,00%
30,00%
40,00%
50,00%
60,00%
70,00%
80,00%
90,00%
100,00%
Azerbaijan Kazakhstan Norway Russia Saudi Arabia 2013 2016
Source: Massachussetts Institute of Technology Media Lab (2018) Liquid and gaseous hydrocarbons are so intimately associated in nature that it has become customary to shorten the expression “petroleum and natural gas” to “petroleum” when referring to both.
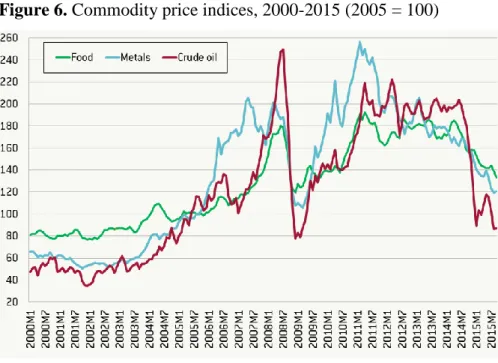
Additional 10% of the Kazakh export is composed of ferrous and non- ferrous metals, radioactive substances and precious metals, which are also subject to cyclicality of prices. Moreover, as shown on the chart below, their price cycles as well as price cycles of food which is another Kazakhstan’s export commodity nicely coincide with oil price cycles.
The true dependence on oil revenues is even higher because “non-oil”
taxes depend on oil-fuelled spending.
At the first glance, the dependence of Azeri economy on oil price fluctuations is higher and the country is suffering more. In reality, as already mentioned above, the prices on other Kazakhstan’s main export commodities, namely metals and agricultural products have also declined giving their cumulative negative effect.
Figure 6. Commodity price indices, 2000-2015 (2005 = 100)
Source: Bruegel (http://bruegel.org/)
Because of the oil sector development, the non-oil sector of the economy in both countries remains undeveloped and very fragile with significant obstacles to both domestic and foreign investment. One of the main obstacles to investment is the high-level corruption in these countries.
This legacy of corruption dates back to Soviet times and currently the huge injections of money from the oil and gas sector are considered as the greatest sources of corruption. The governments undertake different anti-corruption measures, e.g. introduction of relevant legislation requiring public officials to disclose their assets on an annual basis. However, bureaucratic control often hinders the enforcement of applicable legislation and regulations. Laws and decrees are adopted, but their implementation is often delayed or sabotaged.
Also, there are numerous cases when anti-corruption slogans were used to disguise wars between different oligarchic clans.
It is important to point out that much of the non-petroleum share of the economy of these countries is attributed to public expenditures and government contracts, which are financed mainly by the countries’ petroleum export revenues. Even leading industries in the non-oil economy, such as construction and transport, are indirectly funded by the oil sector.
This means that in periods of economic decline it is difficult to expect that non-petroleum businesses will support the economic development and partially substitute declined revenues from the oil and gas sector. As mentioned above, non-petroleum industries are for the big extent financed by contracts of oil companies or petroleum export revenues. For instance, machine-building was mostly relying on oil companies’ contracts. When oil prices are low oil companies are cutting their investments and consequently revenues of Kazakh machine-building enterprises decline.
Contributing such a huge share to GDP, oil and gas sectors of both countries provide employment to a very small portion of populations. In 2010
Azerbaijan’s non-oil industries accounted for only 8% of GDP, while during the same year, agriculture performed poorly at 2.2% (World Bank Indicators, 1995-2010). Current estimates indicate that the oil and gas industries are responsible for a little over 1% of employment in Azerbaijan, while agriculture employs nearly 50% of the country. The Kazakhstan’s economy is relatively better diversified, but suffers from the same problems.
In the recent past, the abundant oil revenues allowed for the governments of Azerbaijan and Kazakhstan to achieve success in reducing poverty. Although social transfer measures have reduced the number of people below the poverty line, these transfers did not automatically lead to sustainable poverty reduction. This happened because the economic success achieved during the period of high oil prices in general and success in reducing poverty in particular have been largely lost since mid-2014. The main factors that contributed to the new situation were the reduction of oil and gas sector revenues, harsh devaluation of national currencies, effect of economic sanctions imposed upon the Russian Federation, etc.
In addition to that the both governments became over-enthusiastic over such expensive and prestigious projects like the first European Games in Baku, Azerbaijan, the 2011 Asian Winter Games in Almaty, Kazakhstan, EXPO 2017 in Astana, Kazakhstan, etc. The irony is that the splurge of public funds aimed at receiving positive international image did not serve this purpose well and was accompanies by numerous theft and corruption scandals.
The economic situation in Azerbaijan is quite similar to the one in Kazakhstan with less diversification of national economy. This resulted in more powerful consequences of the oil prices plunge.
The reduction of oil revenues negatively affected practically all economic and social aspects of life in Azerbaijan and Kazakhstan. One of the most important indicators of changing situation is the exchange rates of local
currencies to US dollar. The problem is that the central banks in these countries are not sufficiently independent institutions, and the exchange rate is usually considered as a part of unwritten social contract according to which the governments treat the exchange rate as one of the main factors of social stability. However, keeping the high exchange rate of national currencies against US dollar became too expensive affair for central banks. On 21 February 2015 the Azerbaijan Central Bank devalued the national currency manat by 33.86%. Similar though even harsher processes happened in Kazakhstan.
As a result of the economic crisis caused by the oil price plunge in 2015 for the first time in many years, Kazakhstan has seen a reduction of public spendings in tenge (national currency) terms - by 5%, and in dollar terms - by 15%. This led to a sharp drop in income generation within the economy and, consequently, consumer demand. Other results are high inflation, decreased wages and a sharp reduction in consumption expenditures, especially on durable goods.
In the past, both countries created sovereign wealth funds in order to manage the increased inflow of oil revenues. Because of the oil price plunge, the studied countries started facing budget deficits. As a result, the growth of assets of their sovereign wealth funds, which were rising at a rapid rate, was discontinued; and the governments started drawing on their buffers.
According to IMF estimations, most of sovereign wealth funds (excluding Norway, UAE, Qatar, and Kuwait’s ones) will run out of buffers in four to seven years if oil prices stay at the level of 2015. Even though these countries will still be able to borrow, governments of these OECs should reduce spendings if they plan to achieve the dual objective of sharing oil wealth equitably with future generations and economic stabilization. Another point we should look at is as stated by N. Volchkova, Policy Director of
CEFIR9, Moscow “any changes in the oil price level affect the economy not only in a nominal way, but also in a structural manner. A change impacts the cost of production in all industries and sectors, as well as the disposable income in the country, but it also affects the exchange rates and the overall uncertainty. This, in turn, affects exports, imports, current accounts, the comparative advantage of countries, as well as the global value chains. In an economy where labour, capital and energy are inputs to production, and capital/labour and energy are complements, a sudden oil price increase is likely to be compensated by labour adjustments. Thus, there might be a structural effect on employment, affecting the entire economy.
Furthermore, there are also large exchange rate devaluations associated with a drop in oil prices, creating import substitution and export expansion for oil-exporting countries like Russia. Lastly, Volchkova concluded that the negative effects of oil price shocks on trade balances could be dealt with by suitable policy measures diversifying the commodity composition of trade as well as the geographical composition of trade partners” Le Coq and Trkulja (2015).
The presented research is especially significant because the problems experienced by Azerbaijan and Kazakhstan are very similar to those, which face other OECs of the former Soviet Union.
It is also interesting to see how the oil price plunge affected the oil exporters’ fiscal breakeven oil prices. The years 2013 and 2016 have been selected as the year preceding the oil price plunge and year with the lowest oil prices respectively. The fiscal break-even oil price is the average oil price which is needed for an oil exporting country to balance its budget in a particular year. It is a key metric for a country’s fiscal vulnerability to oil. If the break- even price is higher than the market price budgets cannot be balanced10.
9 The Centre for Economic and Financial Research (CEFIR) http://www.cefir.ru/?l=eng
10 http://crudeoilpeak.info/opec-fiscal-breakeven-oil-price-increases-7-in-2013
Figure 7. 2013 External breakeven oil price curve
Figure 8. 2016 External breakeven oil price curve
Source: Council on Foreign Relations11
11 https://www.cfr.org/blog/follow-external-balance-payments-breakevens-oil-exporters
Figures 7 and 8 above demonstrate that only few countries managed to have the ends meet after the beginning of the oil price plunge. These countries include Russia and Iran, which achieved a real progress in terms of diversifying their economies and managing their national budgets and payment balances.
More detailed information about these two countries is provided in the Chapter 11 below.
In addition to the economic, these countries face serious and mostly negative social and environmental consequences, which can be briefly described as follows:
Social consequences
Being major taxpayers and employers and financing different social programs additionally oil and gas companies usually make very positive contribution to the social development of countries and territories where they operate. In some remote or underdeveloped territories, oil and gas companies are the only contributors to the social development. The other side of the story is that providing substantial positive contribution oil and gas producers create numerous social problems, which can be described as follows:
• Growing social inequality: oil and gas producers usually pay better salaries, provide better housing, working conditions, etc. than other employers. This creates social discontent
• Substantial inflow of migrants searching for employment opportunities. As it happens in many other countries the relations between the local population and migrants are strained. This topic will be described in detail further below.
• The population of the territories where oil and gas companies operate is often dissatisfied if there is no adequate improvement of the social sphere in their regions. The main reason for this is usually the mismanagement of oil and gas revenues by central government entities.
• Probably the main problem is what will be happening with the population and social sphere of these countries after oil and gas revenues come to an end.
Environmental consequences
By no means can oil and gas production be considered as a green economic activity. Exploration, production, transportation, storage and usage of oil and gas have well known negative effects on the environment. Even though technological advances help reduce these effects, they cannot eliminate them completely. It is true that oil and gas producers pay environmental taxes to national and local budgets, make obligatory contributions to different non-budgetary environmental funds, have special provisions in their sub-soil use contracts obliging them to compensate any environmental damage and pay for rehabilitation of grounds and other natural objects, which condition was affected by their activities. In the periods of low oil prices, government entities and oil companies allocate substantially smaller funds for financing environmental protection activities.
Similarly to the case of social problems, providing substantial positive contribution, oil and gas producers create numerous environmental problems, which can be described as follows:
• Many OECs are the leaders by ecological footprint per capita (especially the Gulf countries);
• Mismanagement of environmental payments by government entities;
• Insufficient enforcement of environmental legislation.
Considering the consequences of oil price fluctuations for oil- exporting countries, it is essential to always remember one crucial question:
what will happen with the economies, the social sphere and the environment of these countries after oil revenues come to an end? The answer is well known – not only declare sustainability as the country’s main development priority, but also adhere to the strict implementation of sustainable
development policies. The sustainability matters also addressed further below.
5.3. Consequences for oil-importing countries
After considering the situations in oil-exporting countries, it is logical to briefly look at the situations in oil-importing countries, especially in the countries importing crude oil from Azerbaijan and Kazakhstan. These countries include Mediterranean and European countries and China, but the paper is limited to China and Turkey.
In general, the new situation on the oil market affects the oil-importing countries positively. The low course of world oil prices is very important for energy importing countries like China and Turkey. It should be noted that low oil prices do not affect oil-importing countries in a positive way only. For example, one remembers such positive factors like decrease of inflation and current account deficit, but there are other factors, which do not create a positive impression. This is mainly the decreased demand by oil-exporting countries on goods produced in oil-importing countries. Another serious consideration is that a portion of the positive contribution of the drop in oil prices is taken back with the increasing foreign exchange rates mainly against the US dollar. This is especially true for such major exporters of manufactured goods as China and Turkey because increased foreign exchange rates against the US dollar negatively affects the ability of these countries companies to purchase raw materials, equipment, spare parts, etc.
the prices for which are denominated in US$.
The research addresses economic effects of the fall in world oil prices on economic situation in the countries mentioned above. The available scientific works are limited, but already exists. These studies include the works by Maghyereh et al (2017) who studied the influence of oil price uncertainty on the real economic activity in Jordan and Turkey. Their “result is consistent with the previous finding that oil price uncertainty is negatively