Sensitivity of the margin of safety: A nuclear power generation case
NIKOLETT DEUTSCH
Department of Strategy and Project Management Corvinus University of Budapest
1093 Budapest, Fővám tér 8.
HUNGARY
nikolett.deutsch@uni-corvinus.hu
ATTILA FIÁTH
Department of Enterprise Finances Corvinus University of Budapest
1093 Budapest, Fővám tér 8.
HUNGARY
attila.fiáth@uni-corvinus.hu
MIKLÓS VIRÁG
Department of Enterprise Finances Corvinus University of Budapest
1093 Budapest, Fővám tér 8.
HUNGARY
miklos.virag@uni-corvinus.hu
LÁSZLÓ BERÉNYI Institute of Management Science
University of Miskolc 3515 Miskolc, Egyetem út
HUNGARY szvblaci@uni-miskolc.hu
Abstract: Nuclear power is seen as an important source of low-carbon electricity, supporting energy security goals, nuclear power plants contribute to competitive base-load electricity supply, After the Fukushima Daiichi Accident EU Member States retain their sovereignty over the use of nuclear power, some of the countries are still expanding their nuclear capacities, building or planning to build new nuclear reactors, or investing in nuclear fleet’s life-extension, upgrade or uprate activities, while some countries agreed to phase out nuclear generation by about 2022 or 2025. One of the most cited advantages of nuclear energy is said to be its relative insensitivity to fuel price fluctuation. However, due to its front-loaded cost-structure and the relatively high share of fixed versus variable costs in its costs structure, nuclear energy generation is exposed to wholesale price fluctuations. The high decline in the wholesale prices in the EU in the last few years affected negatively nuclear power plants. The goal of this study is to highlight the impact of the decline of the average selling price on the margin of safety by using a case study of an Eastern-European nuclear power plan.
Key-Words: nuclear power plants, energy sector, CVP analysis, margin of safety
1 Introduction
Nuclear energy plays an important role in the global and European energy sectors. Globally, 449 commercial nuclear power reactors are in operation in 31 countries in 2017, with over 392 116 MWe of total capacity (WEC 2017). Recently, the average age of the world’s nuclear reactors is 29.53 years,
64.81% of the global nuclear reactors have operated for at least 30 years while 90 reactors have run for 40 years or more. The largest number of reactors can be found in the US (99), which is followed by France (58) and Japan (42), while the distribution of the installed gross capacity by world regions indicates that Europe has the largest nuclear power
plant capacities. In the relevant literature and reports (Andoura et al. 2011, Poncelet 2013, Fisher 2013, NEA 2013, OECD-NEA 2012, WEC 2007/a, ENEF 2013, Euroconfluences 2011) one of the most important advantages of nuclear power plants stressed in official publications are the high availability and load factors of nuclear reactors, and their dispatchable nature. According to the PRIS database of the International Atomic Energy Agency for the period 2014-2016, the EU-wide average energy availability of nuclear plants was 83.86%, and the highest availability was experienced in Romania, Finland and Slovenia while in 2016 unit capability factors exceeded 90% in Finland, Hungary, Romania, and Spain. Furthermore, nuclear energy is also said to be one of the most competitive energy generation technology due to its cost structure and limited impacts of fuel price volatility.
However, the decline of average selling price in the EU affected negatively the operational performance and profitability of nuclear power plants in the last few years. In order to illustrate this impact of price reduction this paper demonstrates a cost – volume – profit analysis of the Hungarian nuclear power plant.
2 Economics of Nuclear Power Generation
2.1. Investment and O&M costs of nuclear power generation
Financial requirements of nuclear power plants include the initial investment, operation and maintenance, fuel procurement, waste treatment and disposal and end of life decommissioning cost.
According to IEA-NAE (2010, 2015) the levelized cost of electricity (LCOE) of new nuclear plants in 2030 will be competitive with other generating options, however the more investment intensive the option, the more sensitive the LCOE to the value of the discount rate (see Table 1).
Table 1: Levelized costs of electricity of European nuclear plants (USD/MWh)
Source: IEA-NAE (2010, 2015)
Investment costs represent by far the largest share (around 60% on average) of LCOE, construction
costs of nuclear energy generation are significantly higher in comparison to fossil fuel technologies.
Investment costs depend on plant size, multiple unit sites, design improvement, standardization, and performance improvement (WEC 2007/a, van der Zwaan 2008). Regarding upfront investment costs of nuclear power plants in the European Union, it is hard to determine the current economics of new plant construction because no new reactor order had been placed in Western Europe since 1980 (Schneider et al. 2013). Investment costs are ranging from €2-3.5 billion (for 1000MWe to 1600MWe) (EC 2007), which also means that construction costs of nuclear energy generation are significantly higher in comparison to fossil fuel technologies (e.g.
Prognos 2009: 51 states that coal-fired power plants amount to approximately 1800€/kW, while combined-cycle gas turbine power plant account to 800-900€/kW). The cost of building a nuclear power plant is sensitive to the construction time: the longer the project takes to complete, the longer interest payments accrue without any offsetting positive cash flow (IEA 2011:459). If one examines the difference between overnight (owner’s costs pre- construction and during construction and engineering-procurement-construction costs) and investment costs (overnight costs plus imputed interest charges during construction at 10% a year) of nuclear power generation, the effects of interest charges can be detected. The ‘front-loaded’ cost structure of nuclear plants suggests that existing operating nuclear power plants continue to be a generally competitive profitable source of electricity, but for new construction, the economic competitiveness of nuclear power depends on several factors (WEC 2007b:5). Due to cost overruns and project delays capital needs of a nuclear project stretch the financial capability even of the largest utilities, and very unusual risks hinder bank financing (IEA 2012:178). Thus in order to be able to refinance the high capital costs, new nuclear power plants need a guaranteed long operating life and a guaranteed high full-load operation.
In competitive energy markets investment risks and financial challenges are dominant (van der Zwaan 2008, WEC 2013) and according to OECD- NEA (2012) commercial risk of new nuclear power plants is higher than in the case of other electricity sources, while ENEF (2010) highlights that external financing of nuclear project is particularly challenging, because of the high capital cost and long term payback times, the uncertainties related to planning and construction period including supply chain constraints, possible delays, cost overruns and changing regulation, the fact that economics of
3% 7% 10% 3% 7% 10% 5% 10%
BELGIUM 70.67 126.19 181.78 51.45 84.17 116.81 61.06 109.14 FINLAND 64.65 118.21 171.70 43.13 77.64 109.10
FRANCE 69.09 124.63 179.98 49.98 82.64 115.21 58.42 92.38 HUNGARY 81.68 142.97 202.47 53.90 89.94 124.95 81.85 121.82 SLOVAKIA 82.28 133.36 188.66 53.90 83.95 116.48 82.69 97.92
Country
LCOE with 50%
capacity factor
LCOE with 85%
capacity factor LCOE (2010)
nuclear is sensitive to regulation related to safety and market conditions (volatility in the price of carbon credits), the specific nature of nuclear projects (political uncertainties, public acceptance), and the related costs of nuclear spent fuel and waste management and decommissioning. It is also stressed in the literature (e.g. van der Zwaan 2008;
Kiyar & Wittneben 2012) that in the new liberalized energy characterized by new types of risk (market risks, political risks, regulatory risks, price and cost risks, technological risks, etc.), private investors value rapid and high returns increasing the cost of capital. The Economic crisis and Fukushima have exacerbated the problem of financing new nuclear power plants by highlighting the need for higher safety standards and creating a more critical public attitude (Kiyar & Wittneben, 2012). In order to facilitate new constructions, ENEF (2010) suggests that new and innovative financing models such as power user investments, utility joint ventures and power user - power supplier agreements, and project finance must be stimulated.
IEA-NEA (2010) states that operations and maintenance costs of nuclear plants show a relative stability compared with competing technologies in the last decades, in 2016 nuclear production costs in the European Union were around 1c€/kWh, which is much lower than for coal and gas plants (WNA 2017). Since fuel costs represent only 10-15% of total generation costs, fuel price volatility has little influence on production costs compared to fossil- based energy generation. It is worth to mention that besides fuel cost fluctuations the range of generating costs depend on the age of the given nuclear plant, and the regulatory requirements concerning safety inspections and security measures since O&M costs represent around 24%. The IEA-NAE (2015) also estimates that decommissioning and disposal costs make up 10% and 15% of the capital costs of a plant.
2.2. Fixed and variable costs of nuclear power generation
Based on the different research studies (OECD- NEA 2012, Rothwell 2015; Srinivasan & Rethinaraj 2013, Gilbert et al. 2017) dealing with the economics of power generation technologies it can be stated that nuclear power plants have relatively high fixed and relatively low variable costs.
However, in the relevant literature, there is no consensus on the general composition of fixed and variable costs of nuclear power plants. In most of the cases, fixed costs of nuclear power plants cover the overnight costs, the costs of decommissioning and waste management, and the fixed parts of
operation and maintenance costs, i.e. labor costs, planned and unplanned maintenance costs, and payments for O&M service agreements. Sometimes the category of fixed costs also includes other types of costs, such as property taxes, insurance fees, duties, and network & system charges (Fazekas 2006, Energinet 2012, GIF 2007). By contrast, variable costs usually include nuclear fuel costs, costs of consumption of auxiliary materials and spare parts, and the output related part of repair and maintenance costs, while in some cases, costs associated with the treatment and disposal of residuals are classified as fuel costs as well (Konstantin 2007).
Differences in the categorization of fixed and variable costs presented above have a significant impact on the rate of fixed and variable costs in total costs structure of nuclear power plants. Biermayer and Haas (2008) highlight that in the case of nuclear power plants there is a rule of thumb that fixed costs make up nearly two-thirds of electricity production costs. Similarly, WNA (2017) states that for nuclear power plants fixed costs represent nearly 75% of the total costs, while the rate of variable costs is estimated to be 25%. According to the calculations of Areva NP, construction costs of nuclear power plants represent nearly 70% of the total cost per kWh, while the share of fixed and variable O&M costs in total unit cost is estimated to be 20% and 10% respectively (CEC 2010). It is important to mention that this classification of Areva NP does not take into account the costs associated with decommissioning and waste management of nuclear power plants.
Research studies of nuclear power plants’
economics (see e.g. Rothwell 2015; Srinivasan &
Rethinaraj 2013, Gilbert et al. 2017) suggest that while fixed costs represent about 90-95% of the total O&M costs associated with electricity generation, variable costs are in the range of 5-10%.
The share of fixed and variable unit costs in total unit costs depends also on the timeframe being followed. Despite of the fact that certain types of fuel and non-fuel O&M costs, such as water usage charges nuclear fuel costs, etc. are not completely fixed since in times of permanently shut-down these costs are not incurred and can be treated as variable costs in the long run, during plant operation they are relatively fixed due to their long-term procurement contracts with fixed prices (Thomas 2010:50).
The rate of fixed and variable unit costs indicates that companies operating nuclear power plants have a high degree of operating leverage which means that a small increase or decrease in the sales revenues can have a high magnifying effect over
EBIT (Pintér & Bélyácz 2005). High degree of operating leverage represents higher operating risk and increases the overall risk of the firm (Pintér &
Bélyácz 2005). After deregulation and liberalization processes, energy companies being active in the competitive market are exposed to price risk. In a liberalized electricity market price is influenced by a wide range of factors such as consumption patterns on the local and on the regional markets, the structure of the electricity market, the competition capacity of the main manufacturers, the use of renewable energy resources and its supporting mechanisms, and the state of interconnection capacities. Taking into account the cost structure of nuclear power companies and the dominance of fixed costs in total generation costs, declining electricity prices enhance price risks and have a significant impact on the operational performance of these firms.
Based on these statements in the following Chapter sensitivity of the margin of safety of the Hungarian nuclear power plant (hereafter referred to as HNPP) will be analyzed as a case study in order to highlight the main impacts of wholesale price volatility on the operational performance of a nuclear power plant.
For investigating the relationships among sales volume, expenses, revenue, and profit cost-volume- profit (CVP) analysis is used. While CVP analysis usually helps managers to define the effects of output volume on revenue, expenses and net income, it also supports the examination of the effects of price and cost changes on profit (Horngren et al. 2000).
Data used in this paper are taken from the publicly available financial statements of the company exclusively, the wholesale prices are provided by HUPX and Bloomberg database and nuclear statistics are provided by EUROSTAT and PRIS databases of International Atomic Energy Agency. MS Excel was used for the calculations and for the creation of figures. All monetary values are expressed in EUR.
3 Costs and margin of safety of a nuclear power plant
3.1 Main trends in the Hungarian electricity markets
Hungarian electricity generation has been dominated by nuclear energy since the construction of the company in the 1980s and according to the
National Energy Strategy 2030 and the Inter- Governmental Agreement signed with the Russian Federation, two units of 1200MW will be constructed at the site. HNPP is owned and operated by the subsidiary of the state-owned market leader company in the country.
According to the latest available data on electricity supply in Hungary cumulative installed electricity capacity was 8 579 MW in 2015, which decreased by 8.73% from 2012 due to the decommissioning of thermal power plants. From 2012 and 2015 gross electricity production in Hungary has reduced by 12.39% to 30 342 TWh.
Domestic electricity supply both in terms of capacity and gross production was dominated by nuclear power followed by lignite and hydrocarbon during the period under review. At the same time, the contribution of nuclear based electricity generation to the total domestic production increased from 45.59% in 2012 to 52.18% in 2015.
The share of renewable energy based electricity generation grew by 21.35% from 2.65% in 2012 to 3.21 in 2015. Renewable based electricity production was supported with a feed-in tariff obligation system and guaranteed price. The share of large and small electricity generation units in total electricity generation was not changed significantly in the period with a contribution rate of 80-20%.
Domestic electricity demand increased to 43 749 TWh from 38 920 TWh from 2012 to 2015, which indicates that the major part of the country’s domestic demand was supplied from import. From 2012 to 2015 electricity import increased from 16 969 TWH to 19 936 TWh, although, after a remarkable drop in between 2012 and 2013, the volume of electricity export increased by 31.62%.
From the neighbor countries, the main export partner was Croatia and the key import partners were Slovakia and Ukraine (MAVIR, 2016).
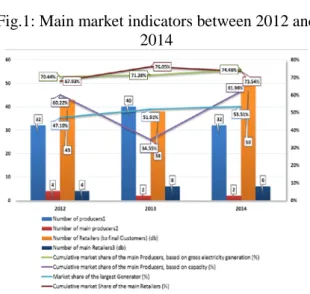
In spite of the fact that market liberalization and deregulation was completed in 2008, as Fig. 1.
Illustrates, electricity markets – production and retail - in Hungary continues to be characterized by high market concentration.
In 2015 with its 53.51% share the largest producer in the country was responsible for nearly 75% of the sales in the wholesale market and has a dominant share in the electricity purchases of universal service providers (79.66%) and retailers (27.6%). Currently, there are 109 certified suppliers and three main universal electricity suppliers operating in the country. Development and operation of the Hungarian transmission system are carried out by the Hungarian independent
transmission operator company. In Hungary, the Hungarian Power Exchange Company (HUPX) is the licensed operator of the Hungarian power exchange offering three markets: an intraday market with 31, a day-ahead market with 60 and a physical futures market with 26 members.
Fig.1: Main market indicators between 2012 and 2014
Source: CEER Country Report (2016)
The significant drop can be observed in the development of wholesale electricity prices in the period between 2012 and 2016. Average prices of base-load and peak-load electricity in HUPX reduced from 5.82 cents EUR/kWh and 7.48 cent EUR/kWh to 4.09 cent EUR/kWh and 5.04 cent EUR/kWh respectively from 2012 to 2015. A similar trend can be observed in the spot market of HUPX. Average prices of based load electricity reduced from 40.5 €/MWh to 31.22 €/MWh, average prices of peak load electricity decreased from 47.02 €/MWh to 35.86 €/MWh, while the average price of off-peak electricity moderated from 33.99 €/MWh to 26.59 €/MWh between 2014 and 2016.
If one examines the development of wholesale electricity prices in the futures and spot markets of EEX, PXE, OTE, and OKTE – the regional power exchanges - similar tendencies can be identified whereas in most of the cases the reduction of the average wholesale prices of Hungarian products was the lowest. It should be noted that strong correlation between the average prices of national products in the spot markets can be traced back to the market coupling mechanism of the Hungarian, Slovak, Czech and Roman markets.
It is also worth to mention that due to the energy price reduction policy of the Hungarian government,
retail market prices of universal services also reduced significantly between 2011 and 2015.
While in 2011 electricity retail prices of universal service providers were in the range of the 20.60- 22.64 cent EUR/kWh, in 2015 average price of universal services reached only 4.91 cent EUR/kWh.
3.2. Electricity production and sales
Currently, at the site, four pressurized water type of nuclear reactors are in operation with a reference unit power of 470MW, 473MW, 473MW and 473MW respectively. Annual gross and net electricity generation of the units of HNPP between 2013 and 2016 are illustrated by Fig.2. From 2013 to 2016 both gross and net electricity production of the company increased by 0.044%. HNPP reached its historical record production in 2016 as the four units generated a total of 16053.9GWh electric energy covering the 51.3% of the gross domestic energy production. Furthermore, the average value of the rate of the net to gross electricity production of HNPP was in the range of 94.44-94.59%.
Fig. 2: Gross and net electricity generation of HNPP between 2013 and 2016 (in GWh)
Source: own edition, based on the Annual reports of the company
Fig. 3: Load factors between 2013 and 2016 (in %)
Source: own edition based on IAEA (2017)
The performance of the units was influenced by their load and unit capability factors. Load factor is the ratio of the energy that the power unit has produced over a given period, to the energy it would
have produced at its reference power capacity over that period (IAEA 2017:6). High load factor means greater total output indicating that fixed costs are spread over more kWh of output. Between 2013 and 2015, the average load factor of HNPP increased from 87.88% to 91.48% (see Fig. 3). Regarding reactor units, it is worth highlighting that during the period under review the load factor of Unit 3 gradually increased and in 2016 it reached 100%
due to the changeover to a 15-month fuel campaign.
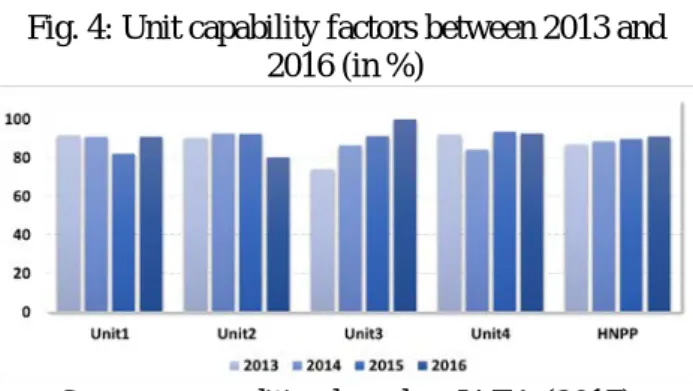
Unit capability factor is the ratio of the energy that the unit was capable of generating over a given time period considering the only limitation under the plant management control, to the reference energy generation over the same time period (IAEA 2017:6). Since nuclear power plants are usually at the high end of the range of capacity factors, average unit capability factor of HNPP in 2016 reached 90.90% representing a 3.60% increase from 2013 (see Fig. 4). Similarly to load factor values, highest improvement of unit capability factor can be observed at Unit 3 and the unit capability factor of Unit 2 dropped sharply by 2016 after a continuous growth trend.
Fig. 4: Unit capability factors between 2013 and 2016 (in %)
Source: own edition based on IAEA (2017)
Values of load factor and unit capability factors of the reactor units were determined by the planned and unplanned outages. From 2013 to 2016 planned outage of HNPP decreased from 145.88 days 116.17 days, and unplanned outage declined from 44.46 days to 9.33 days. due to a planned maintenance work caused by the failure of a mechanical equipment, the duration of planned outage of Unit 2 reached 60.96 days while in the case of Unit 3 the planned and unplanned outages equaled to zero in 2016 (IAEA 2017).
Regarding electricity sales, it should be noted that Hungarian power plant operates only on the Hungarian market being the only nuclear power producer in the country. Due to its technological attributes, HNPP sells mainly baseload electricity and is an active participant in the market of system services as well. According to the sale-purchase
contract, electricity produced and supplied by HNPP was offered and sold to the parent trading company.
As Table 2 illustrates, during this period, net sales revenues of the firm declined by nearly 1.45%
annually. Although electricity sales increased in volume and the share of electricity sales revenues in total sales revenues remained in the range of 96.31%-96.90% during the period under review, electricity sales revenues reduced from 618.203 million EUR in 2013 to 554.348 million EUR in 2016, which means that the reduction of electricity sales revenues can be traced back to the decline of the average selling price.
Table 2: Energy sales revenues and operating revenues (2013-2016) HNPP
Source: own edition, based on the Annual reports of the company
Fig.5: Changes in the average prices of HUPX, universal services, and HNPP. (2013-2016)
Source: own edition
From 2013 to 2016 the company’s average selling price of 1 kWh electricity declined by 10%
to 3.65 cent EUR/kWh, which tendency reflects the reduction in the average prices of HUPX and universal services experienced in the period under review (see Fig. 5).
Table 3: Financial indicators of electricity activities of HNPP (2013-2016)
(in thousand EUR) 2016 2015 2014 2013
Sales revenues, out of which: 561 078 554 977 560 079 624 947 Electricity sales revenues 554 348 548 471 553 578 618 203
Thermal power sales revenues 889 861 800 852
Other sales revenues 5 841 5 645 5 701 5 891 Other operating revenues 10 988 11 823 14 719 13 417 Total operating revenues 572 065 566 800 574 798 638 364
2016 2015 2014 2013
Electricity sales revenues (t EUR) 554 548 554 618
Operating expenses (t EUR) 502 491 494 490
Net profit (t EUR) 28 22 27 77
EBIT (t EUR) 59 64 66 135
DOL (% EBIT/% Electricity sales reve -7.74 2.30 4.92
ROE (%) 6.24% 5.30% 6.35% 17.64%
ROA (%) 4.50% 3.61% 4.26% 11.00%
Source: own calculations based on the Annual reports of the company
Table 3 summarizes the main financial indicators associated with the electricity activities of the company in the given period. From 2013 to 2016, operating expenses grew by an average 0.053%
annually. Although, between 2013 and 2015 electricity related net profit reduced by an average 15.88% annually, in 2016 net profit increased again by 14.41%. This tendency is reflected in the development of ROA and ROE as well.
The formula used for determining the Degree of Operating Leverage (DOL) was the follows:
DOL= 𝐶𝐶ℎ𝑎𝑎𝑎𝑎𝑎𝑎𝑎𝑎 𝑖𝑖𝑎𝑎 𝐸𝐸𝐸𝐸𝐸𝐸𝐸𝐸 (%)
𝐶𝐶ℎ𝑎𝑎𝑎𝑎𝑎𝑎𝑎𝑎 𝑖𝑖𝑎𝑎 𝑆𝑆𝑎𝑎𝑆𝑆𝑎𝑎𝑆𝑆 (%) (1)
Since the annual values of the degree of operating leverage (DOL) indicate, between 2015 and 2016 1% increase in electricity sales revenues reduced the company’s gross operating profit by 7.74%.
In the next Chapter, detailed analysis of flat cost and the development of the breakeven output is performed.
3.3 Analyzing the structure of flat cost and the impact of wholesale price reduction
In order to calculate the annual electricity-related flat cost of the company, the general calculation methodology defined by the relevant literature was followed, i.e. flat cost was measured by the operating expenses per one unit of electricity sold.
Main advantages of this methodology lie in its flexibility and reliability and the transparency and traceability of the results.
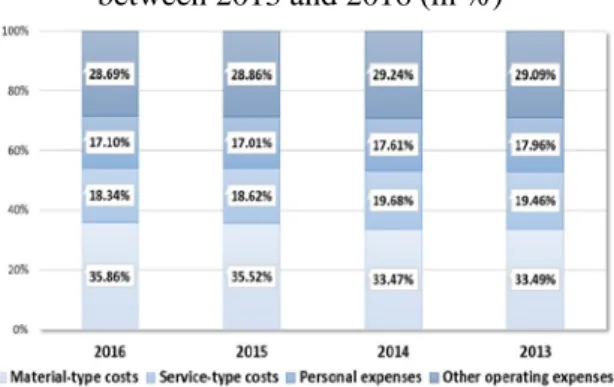
Fig. 6: Share of cost categories in total flat cost between 2013 and 2016 (in %)
Source: own calculations based on the Annual reports of the company
Based on the publicly available annual statements of the company, between 2013 and 2016 total flat cost of electricity-related activities decreased by around 2%. Fig. 6 illustrates the development of the structure flat cost by main categories – material-type costs, personal expenses, service-type costs and other costs - between 2013 and 2016.
Main conclusions are the follows:
• As it is indicated in the figure above, the share of electricity-related material-type unit costs in total flat costs increased by 0.07%. The value of material-type unit costs including the nuclear fuel costs, water usage fees, and other material related to cost per one unit of electricity sold, grew steadily from 2013, and in 2016 it reached 1.49 cent EUR/kWh due to the 15% increase of nuclear fuel costs.
• Personal expenses per one unit of electricity sold by the company contain per unit costs of wages and salaries, social security and assimilated costs, and other staff benefits. The share of unit costs of personal expenses related to electricity activities in total flat cost decreased by 4.76% from 17.96% in 2013 to 17.10% in 2016.
• Main categories of service-type unit costs cover the unit costs associated with repair and maintenance, engineering and other services.
Between 2013 and 2016 the company was able to reduce the value of service-type unit costs by 7.78% and the share of service-related unit cost in total flat cost of electricity activities also decreased 5.77% during the period under review.
• The share of other operating expenses including other costs, provisions, waste and decommissioning charges, taxes, and fees, depreciation in total flat cost of electricity- related activities reduced by 1.39% and the value of other operating expenses per one unit of electricity sold by HNPP still decreased by 2.13% during the period under review.
As it was presented in Chapter 2, examination of the impacts of decreasing wholesale prices on flat costs necessitates the calculation of fixed and variable costs.
Following the calculation methodology introduced in Chapter 2.2 variable unit costs of electricity production include only specific water usage fees, while specific nuclear fuel costs and all other sub-categories of material-type, service-type, personal-type and other operating expenses associated with net electricity production of the
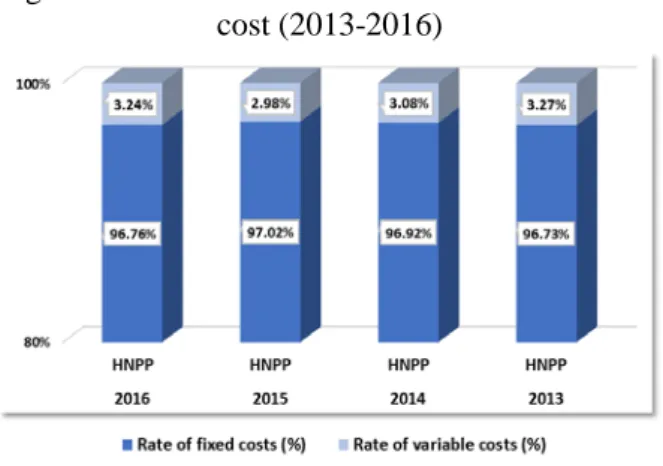
company are regarded as variable unit costs. Fig. 7 shows the development of electricity-related fixed and variable costs in total flat costs.
As Fig. 7 illustrates the share of fixed and variable unit costs in total flat costs was in the range defined by the relevant literature sources presented in Chapter 2.2. the amount of total variable costs per unit of production was not changed between 2013 and 2016 and reached 0.011 cent EUR/kWh and the share of variable costs per unit of production in total unit costs stabilized around 96.7%.
Fig. 7: Rate of fixed and variable costs in total flat cost (2013-2016)
Source: own calculations based on the Annual reports of the company
Fig. 8: Results of break-even analysis (2013-2016)
Source: own calculations based on the Annual reports of the company
Considering the relatively high rates of fixed unit costs, it is worth to analyze the development of break-even output in the given period. The results of break-even analysis (see Fig. 8) illustrate that between 2013 and 2016 contribution per unit decreased by 18.62% and the amount of break-even output grew by 20.49%. This means that due to the sharp decrease in the average selling price the margin of safety, i.e. the extent by which actual sales exceed the break-even sales of the company, also reduced, indicating that while in 2013 a 19.35%
reduction in electricity sales of HNPP would result in just breaking even, in 2016 this value of sales
reduction decreased to 6.96%. Thus, these changes in the margin of safety flag a warning to the management of the company indicating the increasing vulnerability of current operation to price reductions despite their active efficiency improvements.
4 Conclusion
4.1. Main conclusions of the study
The main purpose of this research was to investigate the impact of the fluctuation of wholesale electricity price on the operational performance of nuclear power plants based on the case of an Eastern- European nuclear power plant.
Results on the share of fixed and variable unit costs associated with electricity-related activities of the company being analyzed correspond to the findings in the relevant literature on nuclear power plants’ economics. Changes in the margin of safety of the company in recent years confirm that the observed reduction in the average selling price represents a considerable risk for the Hungarian power plant. Since the improvement of the load factor of the power plant is limited, to avoid the reduction of the margin of safety and to maintain a profitable operation, the Company should supervise its cost-structure and identify options for further cost reduction.
4.2. Limitations and further challenges
Examination of the impact of wholesale price reduction on operational performance of nuclear power plants by CVP analysis presented in this paper has serious limitations on the applicability of the results for decision making. Main limitations of the results relate to the assumptions of the composition of fixed and variable unit costs of nuclear power plants and to the assumptions of constant unit variable cost and constant unit prices for all levels of volume.
It is also important to note that the analysis presented in this paper is based on the publicly available annual reports of the company which means that availability of detailed subdivision of electricity-related costs could raise further the level of sophistication of the results and conclusions.
Finally, one case study does not guarantee generalization of results, for this a more detailed and comparative analysis of nuclear power plants’ cost structure is needed.
References:
Andoura, S., Coeffe, P., & Dobbrostamat, M., Nuclear Energy in Europe, Notre Europe. Policy Brief, 2011, http://www.notre- europe.eu/media/pdf.php?file=Bref25-
nuclear_energy-EN-web_01.pdf, Accessed:
04.11.2013.
Biermayer, P. & Haas, R., Aspekte der zukünftigen Kernenergienutzung, Energie- und Umweltforschung 53/2008
CEC, Cost of Generation Model User’s Guide Version 2 Based on Version of the Cost of
Generation Model, 2010, http://www.energy.ca.gov/2010publications/CEC-
200-2010-002/CEC-200-2010-002.PDF, Accessed:07.09.2017.
Energinet, Technology Data for Energy Plants, Copenhagen: Danish Energy Agency, 2012
Fazekas, A. I., Villamosenergia-rendszerek rendszerszintű tervezése I. Budapest: Akadémiai Kiadó, 2006
Fisher, C., Investment in low-carbon technology Role of nuclear energy, 2013, http://ec.europa.eu/energy/nuclear/forum/meetings /doc/2013_05_30/day1/mrs_fisher_enef_2013.pdf, Accessed: 04.11.2013.
Gilbert, A., Sovacool, B. K., Johnstone, P., &
Stirling, A., Cost overruns and financial risk in the construction of nuclear power reactors: a critical appraisal, Energy Policy, 102, 2017, pp. 644-649.
GIF, Cost Estimating Guidelines for Generation IV Nuclear Energy Systems, 2007, https://www.gen- 4.org/gif/upload/docs/application/pdf/2013- 09/emwg_guidelines.pdf, Accessed: 18.09.2017.
Horngren, C. T., Foster, G. & Datar, S. M., Cost Accounting, London: Prentice Hall, 2000.
IAEA, Operating experience with nuclear power stations in Member States in 2017, 2017
Konstantin, P., Praxisbuch Energiewirtschaft:
Energieumwandlung, -transport und - beschaffung im liberalisierten Markt, Berlin: Springer, 2007 OECD-NEA, The Economics of Long-term
Operation of Nuclear Power Plants, 2012, http://s538600174.onlinehome.fr/nugenia/wp- content/uploads/2014/02/7054-long-term- operation-npps3.pdf, Accessed:11.10.2017.
Poncelet, J.-P., Report WG Opportunities, Presentation, 2013, 8th ENEF Plenary Meeting,
30-31. May 2013, http://ec.europa.eu/energy/nuclear/forum/meetings
/doc/2012_05_14/presentations/status_report_on_
wg_opportunities_enef_bratislava_2012.pdf, Accessed: 04.11.2013.
EC, Communication from the Commission to the Council and to the European Parliament, Nuclear
Illustrative Programme, 2007, http://eur- lex.europa.eu/LexUriServ/LexUriServ.do?uri=CO
M:2006:0844:FIN:EN:PDF, Accessed:
13.11.2013.
ENEF, Strengths – Weaknesses – Opportunities – Threats (SWOT) Analysis, Part 1: Strengths &
Weaknesses, 2010,
http://ec.europa.eu/energy/nuclear/forum/opportun ities/doc/competitiveness/swot-report-part1-- final.pdf, Accessed: 13.11.2013.
ENEF, The contribution of nuclear power to EU 2030 energy and climate strategy, 2013, ENEF/WG Opportunities/Competitiveness, http://ec.europa.eu/energy/nuclear/forum,
Accessed: 11.11.2013.
Euroconfluences, The European Files: Security of Energy Supply in Europe: Continuous Adaptation, 2011, http://www.euroconfluenes.com, Accessed:
13.11.2013.
IEA, Energy Technology Perspectives, PPT-slides, 2012, http://www.iea.org, Accessed: 12.11.2013
IEA, World Energy Outlook, 2011,
http://www.iea.org, Accessed: 12.11.2013.
IEA-NEA, Technology Roadmap, Nuclear Energy, http://www.iea.org/roadmaps, 2010, Accessed:
04.11.2013.
IEA-NEA, Projected Costs of Generating
Electricity, 2015,
http://www.oecd.org/publishing/corrigenda, Accessed: 13.10.2016.
Kíyar, D. & Witteneben, B. F., Nuclear Energy in the European Union after Fukushima: Political and Economic Considerations, CESifo DICE Report 3/2012, http:// www.cesifo- group.de/DocDL/dicereport312-forum2.pdf, Accessed: 12.11.2013.
MAVIR, A magyar villamosenergia-rendszer (VER)
2015. évi adatai, 2016, https://www.mavir.hu/web/mavir/a-magyar-
villamosenergia-rendszer-statisztikai-adatai, Accessed: 11.10.2017.
NEA, NEA News, 2013, Vol. 31, No. 1, http://www.oecd-nea.org/nea-news/, Accessed:
12.11.2013.
Pintér, É. & Bélyácz, I., Vállalati pénzügyek, Pécs:
PTE KTK, 2005.
Prognos (2009): A Renaissance of Nuclear Energy?, http://www.prognos.com/Publications.520.0.html, Accessed: 12.11.2013.
Rothwell, G. Economics of nuclear power, New York: Routledge, 2016
Schneider, M., Froggatt, A., Hosokawa, K., Thomas, S., Yamaguchi, Y., Hazemann, J., The World Nuclear Industry Status Report 2013, https://www.worldnuclearreport.org/The-World-
Nuclear-Industry-Status-Report-2013- HTML.html, Accessed: 19.04.2017.
Srinivasan, T. N. & Rethinaraj, TS G. Fukushima and thereafter: Reassessment of risks of nuclear power, Energy Policy, 52, 2013, pp. 726-736.
Thomas, S., The Economics of Nuclear Power: An Update, Heinrich-Böll-Stiftung, European Union, Brussels, 2010.
van der Zwaan, B., Prospects for nuclear energy in Europe, International Journal of Global Energy Issues, Vol.30, No.1/2/3/4, 2008, pp.102 – 121.
WEC, The Role of Nuclear Power in Europe, 2007a, http://www.worldenergy.org, Accessed:
12.11.2013.
WEC, Nuclear Energy – Status and Outlook, 2007b,
http://www.worldenergy.org, Accessed:
12.11.2013.
WEC, World Energy Issues Monitor 2017, 2017, http://www.worldenergy.org, Accessed:
12.04.2017.
WEC, World Energy Resources, 2013,
http://www.worldenergy.org, Accessed:
12.11.2013.
WNA, Nuclear Power Economics and Project Structuring, 2017, http://world-nuclear.org, Accessed: 21.04.2017
.