Contents lists available atScienceDirect
Psychoneuroendocrinology
journal homepage:www.elsevier.com/locate/psyneuen
Perceived stress correlates with visceral obesity and lipid parameters of the metabolic syndrome: A systematic review and meta-analysis
Judit Tenk
a, Péter Mátrai
a,b, Péter Hegyi
a,c,d, Ildikó Rostás
a, András Garami
a, Imre Szabó
e, Petra Hartmann
f, Erika Pétervári
a, László Czopf
g, Alizadeh Hussain
h, Mária Simon
i,
Szabina Szujó
h, Márta Balaskó
a,⁎aInstitute for Translational Medicine, Medical School, University of Pécs, Pécs, Hungary
bInstitute of Bioanalysis, Medical School, University of Pécs, Pécs, Hungary
cDepartment of Translational Medicine, University of Pécs, Pécs, Hungary
dHungarian Academy of Sciences–University of Szeged, Momentum Gastroenterology Multidisciplinary Research Group, Szeged, Hungary
eDepartment of Gastroenterology, First Department of Internal Medicine, University of Pécs, Pécs, Hungary
fInstitute of Surgical Research, University of Szeged, Szeged, Hungary
gDepartment of Cardiology, First Department of Medicine, University of Pécs, Pécs, Hungary
hDepartment of Hematology, First Department of Medicine, University of Pécs, Pécs, Hungary
iDepartment of Psychiatry and Psychotherapy, Medical School, University of Pécs, Pécs, Hungary
A R T I C L E I N F O
Keywords:
Perceived stress Metabolic syndrome Dyslipidemia Visceral obesity
A B S T R A C T
Background: Perceived stress has been proposed as a risk factor of metabolic syndrome. However, correlations between perceived stress and parameters of the metabolic syndrome have not been properly analyzed despite extensive research data on the topic. Our current meta-analysis aimed to examine the mutual association be- tween perceived stress of patients and parameters of metabolic syndrome.
Methods:This systematic review has been registered on the PROSPERO database (registration number CRD42017055293). Eligible studies divided participants based on their stress level or on the presence of me- tabolic syndrome. They reported at least one parameter of the metabolic syndrome or the stress level of the participants measured with some stress scale. Data from 17 articles met the eligibility criteria and were included.
Random effects model with the DerSimonian and Laird weighting methods was applied. I-squared indicator and Q test were performed to assess heterogeneity.
Results:Although the majority of individual studies failed to demonstrate correlations between stress and their analyzed parameters of metabolic syndrome, our meta-analysis showed a significant association between stress and BMI [average effect size (ES) with 95% confidence interval (95%CI), ES = 0.65, 95%CI 0.16, 1.14), waist circumference (ES = 1.84 cm, 95%CI 0.79, 2.89) and serum triglyceride level (ES = 7.52 mg/dl, 95%CI 0.07, 14.96). Additional analysis confirmed effects of stress on serum HDL (ES = - 1.699 mg/dl, 95%CI−2.966,
−0.432) and diastolic blood pressure (ES = 1.04 mmHg, 95%CI 0.18, 1.89). No correlations were found for fasting glucose or systolic blood pressure. No association between metabolic syndrome and stress level of pa- tients was detected either.
Conclusion:The potentially key role of visceral obesity in the association between perceived stress and dysli- pidemia or diastolic blood pressure are discussed together with potential moderators (e.g. gender-differences, variations in stress assessment and metabolic syndrome criteria) that may explain the inconsistent, contradictory results of the individual studies.
1. Introduction
Stress is regarded as one of the major public health challenges of the 21st century. Psychological stress has been suggested as a risk factor that may prospectively predict metabolic syndrome (Aschbacher et al.,
2014;Pyykkonen et al., 2010). Other studies have also indicated that life stress may lead to metabolic syndrome (Steptoe and Kivimäki, 2013). A cross-sectional study of radiologists demonstrated that pro- fessionals characterized by elevated levels of stress had a significantly higher risk of metabolic syndrome than colleagues with lower stress
https://doi.org/10.1016/j.psyneuen.2018.05.014
Received 6 December 2017; Received in revised form 10 May 2018; Accepted 10 May 2018
⁎Corresponding author at: Institute for Translational Medicine, Medical School, University of Pécs, 1 Szigeti Str., Pécs, H-7624, Hungary.
E-mail address:marta.balasko@aok.pte.hu(M. Balaskó).
0306-4530/ © 2018 Elsevier Ltd. All rights reserved.
T
(Magnavita and Fileni, 2014).
Metabolic syndrome was defined by the World Health Organization as a complex group of symptoms that includes insulin resistance or high serum glucose level and any two of the following abnormalities: visc- eral obesity, dyslipidemia [high serum triglyceride and low high-den- sity lipoprotein (HDL)], hypertension or microalbuminuria (Alberti and Zimmet, 1998). By now, there are various definitions for metabolic syndrome established by the US National Cholesterol Education Pro- gram: Adult Treatment Panel III (NCEP/ATP III), the International Diabetes Federation (IDF) or the American Heart Association/National Heart, Lung and Blood Institute (AHA/NHLBI), among others (Alberti et al., 2005; Alberti and Zimmet, 2006; Parikh and Mohan, 2012).
However, all groups predict an increase in the prevalence of the me- tabolic syndrome due to the increasing body mass index (BMI) and the progressive aging of Western society (Ervin, 2009). Currently, the prevalence of metabolic syndrome among adults has already exceeded 20% in many industrially developed countries (Balkau et al., 2003).
With regard to the concept of metabolic syndrome some concerns have been raised. Some of the parameters, e.g. body mass index (BMI) or waist circumference (WC) show high heterogeneity, as they are influ- enced by a wide variety of factors from gender to caloric intake, the composition of the diet (e.g. high-fat and/or high-carbohydrate diets), physical activity or psychological stress inducing preference for high-fat or high-refined carbohydrate food (for reviews seeSkolnik and Ryan, 2014;Harris, 2015). Other researchers questioned the clinical utility of this term. Their meta-analysis showed that metabolic syndrome (re- gardless of the definition used) conveyed no additional predictive in- formation beyond its components (Iribarren et al., 2006). However, this syndrome has been highlighted as a major socioeconomic problem throughout the world and it is still widely used in clinical research.
Based on the complex pathomechanisms of stress, a correlation between psychological stress and metabolic syndrome appears to be justified. In addition to the activation of the sympathetic nervous system and the adrenal medulla with consequent catecholamine re- lease, stress also activates the hypothalamic-pituitary-adrenal (HPA) axis and increases blood cortisol levels (Seematter et al., 2004). Several studies confirmed that perceived stress shows a strong correlation with blood cortisol (Borráz-León et al., 2017;Dickerson and Kemeny, 2004;
Kurina et al., 2004). Both catecholamines and cortisol increase blood glucose level and induce insulin resistance, major factors in metabolic syndrome. Psychological stress has also been demonstrated to induce the release of chemokines, such as monocyte chemoattractant protein (Deak et al., 2015) and inflammatory cytokines, such as interleukin-1 beta and interleukin-6 (Steptoe et al., 2001; Seematter et al., 2004;
Speaker and Fleshner, 2012) that induce insulin resistance promoting the development of metabolic syndrome (Grimble, 2002). Potential pathomechanisms of stress-induced inflammation include activation of the sympathetic nervous system (with possible simultaneous inhibition of the parasympathetic nervous system) and activation of transcription factor NF-κB (Tracey, 2002;Bierhaus et al., 2003). Both inflammation and stress-induced mitochondrial changes have been demonstrated to increase oxidative stress, which in turn contributes to insulin resistance leading to metabolic syndrome (Picard et al., 2015). Animal experi- ments identified other stress-induced factors that are likely to mediate the effects of stress on metabolic syndrome outcomes include neuro- peptide Y (Kuo et al., 2007), leptin (Chuang et al., 2010), ghrelin (Patterson et al., 2013), growth hormone, growth factors (Jezova et al., 2007) or reduced brain-derived neurotrophic factor (BDNF) level (Nakagawa et al., 2003), among other potential mediators. The increase in growth hormone and growth factors and the decrease in BDNF have been demonstrated to promote insulin resistance (Nakagawa et al., 2003;Seematter et al., 2004;Jezova et al., 2007). Behavioral pathways may also mediate the effects of stress on metabolic syndrome (Harris, 2015). Stress has diverse effects on food intake. Restrained eaters and overweight individuals tend to eat more under stressful circumstances, while other individuals rather skip meals (Weinstein et al., 1997;
Harris, 2015).
The above summarized mechanisms suggest an association between psychological stress and metabolic syndrome, however, to date, corre- lations between perceived stress and parameters of the metabolic syn- drome have not been properly confirmed.
The possibility of a reciprocal association between metabolic syn- drome and stress has been raised by Raikönnen et al. In a longitudinal study, the presence of metabolic syndrome at baseline predicted in- creasing anger and anxiety more than 7 years later (Räikkönen et al., 2002). However, to date, no clear association between metabolic syn- drome and stress has been established.
Based on previousfindings of the literature, we hypothesized that a strong correlation exists between individual parameters of the meta- bolic syndrome and the perceived stress level of patients. We also aimed to test the reciprocal relationship, the potential association between metabolic syndrome and perceived stress level of patients.
2. Methods
2.1. Search strategy
We performed this study following principles of the PRISMA state- ment (Shamseer et al., 2015) and thefinal protocol was registered on the international prospective register of systematic reviews (PROSPERO registration number: CRD42017055293). It is available at thehttps://
www.crd.york.ac.uk/PROSPERO/display_record.asp?ID=
CRD42017055293website. Search was conducted up to June 2017 in the following databases: PubMed, Embase and Cochrane Library. In addition we manually searched the reference lists of all identified re- levant articles. Search terms included ‘chronic stress’, ‘stress scale’,
‘chronic distress’, ‘psychological stress’, ‘psychological distress’, ‘per-
ceived stress’, ‘metabolic syndrome’, ‘metabolic x syndrome’, ‘x syn- drome’. The search was restricted to English language articles and human studies with adult individuals (over 18 years of age).
2.2. Study selection and data extraction
In the present meta-analysis we aimed to answer to the following questions: 1. Does perceived stress level show correlation with meta- bolic syndrome? 2. Does the presence of metabolic syndrome show association with perceived stress level? Based on these reciprocal questions two authors (J.T., I.R.) independently performed study se- lection by two sets of inclusion criteria as indicated below (2.2.1.). No supplementary information was obtained from investigators of the original clinical studies, only published data were used.
2.2.1. Investigation of the correlation between stress level and parameters of metabolic syndrome and that of the reciprocal association between metabolic syndrome and perceived stress level
To reveal the potential correlation between perceived stress and metabolic syndrome the following inclusion criteria were used: 1) the study examined the relationship between stress and metabolic syn- drome; 2) stress level was assessed by stress scales (such as Perceived Stress Scale (PSS, Cohen et al., 1983)); 3) participants were divided based on their stress level into low-stress and high-stress groups; 4) at least one parameter of the metabolic syndrome (body mass index (BMI), waist circumference, insulin level, glycated hemoglobin, 2-h value of the oral glucose tolerance test, fasting glucose, high-density lipoprotein (HDL), low-density lipoprotein (LDL), triglyceride (TG), total choles- terol, systolic and/or diastolic blood pressure) was reported; and 5) it was possible to extract the measured values for each group.
Articles were excluded for one or more of the following reasons: 1) the article focused on and divided individuals based on another pro- blem, disease or exposure, such as disturbances of the HPA axis, oxi- dative stress, depression, childhood trauma, burnout, coronary heart disease, anxiety, eating disorders, renal failure, HIV disease or exercise
tests; 2) it did not examine the relationship between stress and meta- bolic syndrome; 3) only data adjusted for different factors were pub- lished; 4) only special regression models were reported; 5) the record was a review article or a conference abstract. Following detailed screening of full-text articles, thirteen of them fulfilled the above mentioned criteria and were included in the quantitative synthesis (Fig. 1,Table 1A).
For the testing of the reciprocal association, we included studies that 1) divided participant groups based on the absence or presence of metabolic syndrome; 2) stress level was measured with some stress scale in an extractable form. Altogether four articles met these criteria and they were included in the meta-analysis (Fig. 1,Table 1B).
2.3. Data extraction and quality assessment
The following pieces of information were recorded for each study:
first author’s name, publication year, number of participants, gender, age, applied criteria for the metabolic syndrome, applied stress scale, mean values of parameters of the metabolic syndrome with standard
deviations (BMI, waist circumference, HDL, LDL, TG, total cholesterol, systolic and diastolic blood pressure and fasting glucose). Regarding assessment of risk of bias for each study the nine-star Newcastle- Ottawa Scale adapted for cross-sectional (Herzog et al., 2013) and co- hort studies (Wells et al., 2000) was applied and we also used the GRADE score to evaluate overall data quality (Guyatt et al., 2008).
Quality assessment was undertaken independently by two authors (J.T., I.R.). Moreover, due to weighting methods, data with low participant numbers were assigned with lower weights during the analysis.
2.4. Statistical analysis
We used random effect models in each of the meta-analyses calcu- lating with the DerSimonian and Laird weighting method. Regarding summary measures (PRISMA, (Shamseer et al., 2015)), analyses de- monstrated differences of means with 95% confidence intervals (95%
CI) from studies that contained data for stressed and non-stressed (control) groups or for those with and without metabolic syndrome, as well. We have also conducted subgroup analyses based on the fact, Fig. 1.Flowchart of the study selection procedure.
whether global stress scale or job-related stress scale was applied by the analyzed studies. We used the meta-regression model to explore the potential moderating role of gender (female ratio) with regard to the effect sizes, i.e. the correlations between perceived stress and para- meters of metabolic syndrome. In each case, we tested the whole model (simultaneously hypothesized that all coefficients are zero) and re- ported the p values of the z-tests. To assess, whether the heterogeneity observed among effect sizes could be attributed to random chance or other factors may play a determining role (e.g. different clinical methods or diverse features of participants), I-squared indicator and Q test were performed. I-squared statistics represents the percentage of effect size heterogeneity that cannot be explained by random chance. If the Q test is significant, it implies that the heterogeneity among effect sizes reported in the observed studies are more diverse than it could be explained only by random error. We considered the Q test significant if p < 0.1. To assess the presence of publication bias (small-study effect) we used Egger’s test to detect asymmetry in the funnel plot. A sig- nificant test result (p < 0.1) indicates the existence of such a bias. In case of significant heterogeneity, the Duval and Tweedie's trim andfill algorithm was used. One study reported the data (parameters of me- tabolic syndrome and stress level) separately for men and women (Söderberg et al., 2012). In this case, it was possible to calculate the variance and the mean of the whole group using the additivity of within-group sum of squares and between-group sum of squares. From
the sum of squares variance was calculated. All statistical analyses were performed with Comprehensive Metaanalysis Software (Biostat Inc.) and Stata 11 SE (Stata Corp.).
3. Results
3.1. Characteristics of included studies 3.1.1. General description
The initial search produced 968 records in the three databases and after removing duplicates, 880 articles were identified (Fig.1). Studies used in our meta-analysis dated from 2002 to 2017. Data of 16035 adult individuals were included in our analysis (number of participants ranged from 61 to 5227 per study). The majority of the articles (eleven) involved cross-sectional studies, four articles used prospective cohort design (Garbarino and Magnavita, 2015;Kivimäki et al., 2002;Ortega- Montiel et al., 2015;Puustinen et al., 2011). Regarding gender, the majority of the studies (ten articles) contained pooled data of men and women and only one of them distinguished data according to gender.
Five articles reported data of male participants and two studies focused only on females. Quality of the individual studies assessed by the Newcastle- Ottawa Scale was relatively high (five to seven stars, Table 1). Due to weighting methods, data with low participant numbers were assigned with lower weights in our analysis. Overall, the quality of Table 1
Description of the studies included in the meta-analyses.
A Study Sample size Gender Age
mean ± SD (range) Applied Stress Scale
Measured parameters of metabolic syndrome Newcastle- Ottawa Quality assessment scale&
BMI WC HDL LDL TG T. chol. SBP DBP FG 1. 2. 3.
Almadi et al. (2013) 204 M 35.15 ± 8.6 ERI ✓ ✓ ✓ ✓ ✓ ✓ ✓ ✓ ✓ ** ** ***
Aschbacher et al.
(2014)
61 F 62 ± 6.5 (50-80) 10-item PSS ✓ ✓ ✓ ✓ ✓ ✓ ✓ ✓ * ** ***
Garbarino and Magnavita, 2015
121 M 41 ± 7.4$ DCS+ERI ✓ ✓ ✓ ✓ ✓ ✓ ✓ ✓ ** – ***
Kang et al. (2004) 167 M 46.85 ± 3.9 JCQ ✓ ✓ ✓ ✓ ✓ ✓ ✓ ✓ * * ***
Kivimäki et al (2002) 540 M and F 18≤$ ERI ✓ ✓ *** – **
Ortega-Montiel et al.
(2015)
1243 M and F 53.8 (52-54.9) single-item question
✓ ✓ ✓ ✓ ✓ ✓ ✓ ✓ ** ** ***
Puustinen et al. (2011) 466 M and F 46.5 ± 6.5 GHQ ✓ ✓ ✓ ✓ ✓ ✓ ** * *
Roohafza et al. (2014) 2815 M and F 44.75 ± 15.1 GHQ ✓ *** – ***
Schmidt et al. (2015) 2757 M and F 40.93 ± 11.16 ERI ✓ ✓ ✓ ✓ ✓ **** – ***
Söderberg et al. (2012) 1067 M and F 35.58 ERI ✓ ✓ ✓ ✓ ✓ ✓ ✓ *** – ***
Trief et al. (2014) 249 M and F 51.65 ± 12.4 14-item PSS ✓ *** – ***
Walvekar et al. (2015) 108 M 42.25 ± 10.39 14-item PSS ✓ ✓ ✓ ✓ ✓ ✓ ✓ ** * ***
Yoo et al. (2009) 223 M 39.25 ± 8.55 14-item PSS ✓ ✓ ✓ ✓ ✓ ✓ ** – ***
B Study Sample size Gender Age Applied Stress
Scale
Applied criteria for metabolic syndrome Newcastle- Ottawa Quality assessment scale&
1. 2. 3.
Abraham et al.
(2013)
299 M and F (18-75) 14-item PSS NCEP/ATPIII **** – **
Chen et al. (2016) 345 M and F 35.7 ± 11.5 14-item PSS modified IDF# **** * **
Khan et al. (2015) 5227 M and F 55.56 ± 12.32 8-item GPSS modified NCEP/ATPIII# **** – **
Räikkönen et al.
(2002)
144 F (42-50) 14-item PSS NHLBI *** ** **
Panel A summarizes characteristics of those 13 studies included in the analysis of the correlation between perceived stress and the parameters of metabolic syndrome.
Panel B summarizes characteristics of those 4 studies included in the analysis focusing on the association between metabolic syndrome and perceived stress.
*: one score.
#: category determined by the authors of the meta-analysis.
$: mean age value for all the participants of the whole study, not just for the specific study group that was included in the analyses.
&: Newcastle- Ottawa quality assessment scale consists of three parts: 1. Selection, 2. Comparability and 3. Exposure/outcome.
Abbreviations: BMI: body mass index, DCS: Job Demand Control Support, DBP: diastolic blood pressure, ERI: effort-reward imbalance, F: female, FG: fasting glucose, GHQ: General Health Questionnaire, GPSS: global perceived stress, HDL: high-density lipoprotein, IDF: International Diabetes Federation, JCQ: Job Content Questionnaire, LDL: low-density lipoprotein, M: male, NCEP: National Cholesterol Education Program, NCEP/ATPIII: National Cholesterol Education Program– Third Adult Treatment Plane, NHLBI: American Heart Association/National Heart, Lung, and Blood Institute, PSS: perceived stress scale, SBP: systolic blood pressure, T. chol.: total cholesterol, TG: triglyceride, WC: waist circumference.
the evidence base was downgraded to low, based on the GRADE score (Guyatt et al., 2008).
3.1.2. Characteristics of included studies focusing on the correlation between perceived stress and parameters of metabolic syndrome
The thirteen articles, which investigated the potential correlation between stress and the metabolic syndrome, used different stress scales (Table 1A). Three studies applied the 14-item PSS (Cohen et al., 1983) and one study the 10-item PSS (Cohen and Janicki-Deverts, 2012). Two articles used the General Health Questionnaire (GHQ; Goldberg and Hillier, 1979), three of them determined stress based only on Effort- Reward Imbalance (Siegrist, 1996), one applied both ERI and Job De- mand Control (JDC; Karasek Robert, 1979; Siegrist, 1996) and one other combined ERI with Job Demand Control Support (Garbarino and Magnavita, 2015). One article worked with the Job Content Ques- tionnaire (JCQ;Karasek et al., 1988) and one applied a simple set of questions for the evaluation of self-perceived psychological stress (Ortega-Montiel et al., 2015).
Ten studies reported BMI values, but only three of them found significant correlation with perceived stress. Seven studies investigated the relationship between stress and waist circumference, but only three of them found a correlation. Only one study found statistical sig- nificance for both parameters, another one for BMI only, whereas no overlap occurred in the rest. Regarding blood pressure, systolic blood pressure was measured in ten articles, the diastolic values were re- corded in eight studies. Only two studies found significant correlation between stress and the systolic and one for the diastolic pressure.
Concerning correlation of stress and parameters of dyslipidemia, nine, eight, nine and seven articles compared TG, HDL, total and LDL cho- lesterol values of high and low-stress groups, respectively. Only one study found significant correlation between perceived stress and all these dyslipidemia parameters, while another one reported correlation between stress versus total and LDL cholesterol. Two of the nine studies found correlation between stress and fasting glucose values. In sum- mary, the majority of the individual studies failed to detect significant effect of stress on parameters of metabolic syndrome.
3.1.3. Characteristics of included studies that focused on the reverse association
Four studies investigated the association between metabolic syn- drome and perceived stress level (Table 1B). Three of them assessed stress level with the 14-item PSS, while one used the 8-item GPSS (Cohen et al., 1983). They also applied different criteria for metabolic syndrome. In addition to criteria of the National Cholesterol Education Program (NCEP) (Grundy et al., 2004), those of the American Heart Association/National Heart, Lung, and Blood Institute were also applied (National Institutes of Health (NIH), 2001), while one study used modified criteria of the NCEP/ Third Adult Treatment Plane (Grundy et al., 2004;Khan et al., 2015) and another one modified the criteria of the International Diabetes Federation tofit its Taiwanese subjects (Chen et al., 2016;Ministry of Health and Welfare, Taiwan, 2014). Only one of the four studies reported significant differences in stress level between women with and without metabolic syndrome, while the other studies failed tofind any difference in either gender.
3.2. Meta-analyses of correlations between perceived stress and parameters of metabolic syndrome
3.2.1. Body mass index and waist circumference
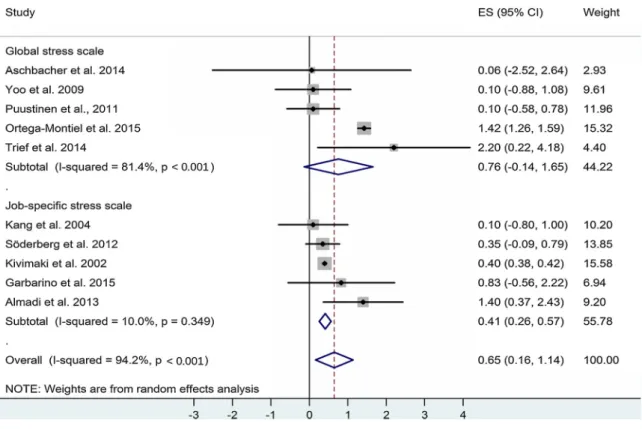
Regarding those ten studies that contained BMI values of high- and low-stress groups, the classic random effect model showed significant positive correlation between perceived stress and BMI (Fig.2), whereas only half of the analyzed individual studies reported significant corre- lations. Our meta-analysis demonstrated a weighted overall effect size (ES) = 0.65 with 95% CI: 0.16, 1.14 p = 0.01. Heterogeneity of the data was high: I-squared = 94.2%, p = 0.001, indicating the presence
of other necessary determining factors in the background. The sig- nificant Egger’s test showed small-study effect (p < 0.01). Based on the Duval and Tweedie's trim andfill algorithm, one additional study was needed to balance the asymmetry. This method yielded the ad- justed value of 0.56 (95% CI: 0.079, 1.042, p = 0.02) that also shows significant correlation. When we compare the adjusted value (0.56) with the original one (0.65), it implies that the small-study effect contributed only to a small extent to our original results. Subgroup analysis based on global and job-specific stress scales showed a positive correlation between job-specific stress and BMI: ES = 0.41 with 95%
CI: 0.26, 0.57 p = 0.0001. Heterogeneity in this subgroup was low: I- squared = 10.0%, p = 0.349. For global stress, no significant correla- tion was found. No difference was detected between the ES values of subgroups p = 0.456. Meta-regression did not show association be- tween the female-male ratio and the ES (p = 0.755).
For waist circumference (WC), an indicator of visceral obesity, our meta-analysis yielded statistical evidence for a positive correlation with the level of perceived stress (Fig. 3), despite the lack of significant correlation reported by most individual studies (four of seven).
Weighted overall ES = 1.84 with 95% CI: 0.79, 2.89 was accompanied by a high level of significance (p = 0.001). Heterogeneity of the data was high: I-squared = 78.4%, p = 0.001. Significant results of the Eg- ger’s test (p < 0.1) suggest a significant contribution of the small-study effect, despite the fact that the Duval and Tweedie's trim andfill al- gorithm did not add any additional new item to balance the asymmetry.
Subgroup analysis confirmed significant correlations between both global and job-specific stress modalities and WC. For global stress:
ES = 1.21 with 95% CI: 0.54, 1.88 p = 0.0001. For job-specific stress:
ES = 3.38 with 95% CI: 1.15, 5.60 p = 0.003. The correlation appeared to be stronger for job-specific stress but the difference between sub- groups did not reach statistical significance (p = 0.068). Meta-regres- sion showed a negative association between the female-male ratio and the ES (p = 0.020). These results suggest that in men there is a stronger correlation between stress and WC.
3.2.2. Lipid parameters
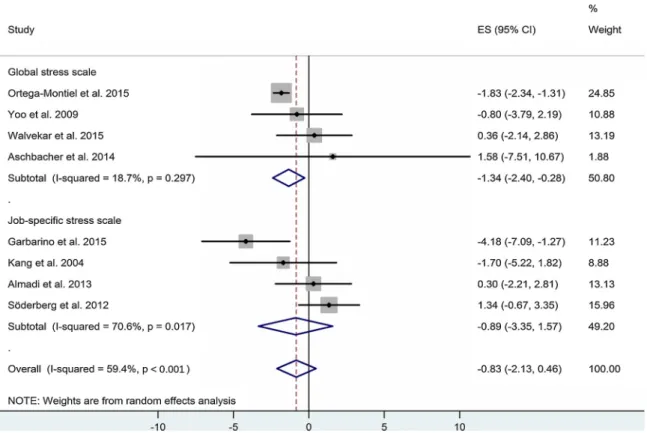
With regard to parameters of dyslipidemia, the correlations between stress and triglyceride levels proved to be significant (p < 0.05) (Fig. 4), while that between stress and total cholesterol was on the border of statistical significance (p = 0.083, not shown). In case of HDL cholesterol, the original meta-analysis failed to detect any correlation (Fig. 5), but following application of the Duval and Tweedie's trim and fill algorithm and the addition of three missing studies to establish symmetry, a significant negative correlation between stress and HDL emerged (p = 0.009). No correlation was found between stress and LDL cholesterol.
For TG an ES of 7.52 mg/dl, with 95% CI: 0.07, 14.96 with high heterogeneity based on I-squared = 71.6%, p = 0.001 were calculated (Fig. 4). Subgroup analysis showed a positive correlation between job- specific stress and TG: ES = 10.12 mg/dl with 95% CI: 0.02, 20.22 p = 0.048. Heterogeneity in this subgroup was high: I- squared = 66.30%, p = 0.018. For global stress, no significant corre- lation was found. The difference between subgroups did not reach statistical significance p = 0.056. Meta-regression indicated a negative association between the female-male ratio and the ES (p = 0.023).
These results suggest that the correlation is stronger in men. Small- study effect did not seem to contribute to these results (Egger’s test:
p = 0.18).
For HDL an ES of−0.83 mg/dl with 95% CI−2.13, 0.46 p = 0.209 were originally calculated (Fig. 5). The heterogeneity was high based on I-squared = 59.4%, p = 0.016. Small-study effect appeared to con- tribute to these results (Egger’s test: p = 0.007). Following the trim and fill procedure, new calculations resulted in an ES of - 1.699 mg/dl with 95% CI:−2.966,−0.432, p = 0.009. Subgroup analysis confirmed a negative correlation between global stress and HDL: ES =−1.34 mg/dl with 95% CI:−2.40,−0.28 p = 0.013 with low heterogeneity, but it
Fig. 2.Forest plot representing the differences in body mass index (BMI) values of low- and high-stress groups with regard to global and job-specific stress. Squares show the difference in mean values with the grey area reflecting the weight assigned to the study. Horizontal bars indicate 95% confidence intervals (95% CI). The diamond shows the overall effect size (ES) with its corresponding 95% CI.
Fig. 3.Forest plot representing the differences in waist circumference values of low- and high-stress groups with regard to global and job-specific stress. Squares show the difference in mean values with the grey area reflecting the weight assigned to the study. Horizontal bars indicate 95% confidence intervals (95% CI). The diamond shows the overall effect size (ES) with its corresponding 95% CI.
Fig. 4.Forest plot representing the differences in serum triglyceride values of low- and high-stress groups with regard to global and job-specific stress. Squares show the difference in mean values with the grey area reflecting the weight assigned to the study. Horizontal bars indicate 95% confidence intervals (95% CI). The diamond shows the overall effect size (ES) with its corresponding 95% CI.
Fig. 5.Forest plot representing the differences in serum high-density lipoprotein (HDL) values of low- and high-stress groups with regard to global and job-specific stress. Squares show the difference in mean values with the grey area reflecting the weight assigned to the study. Horizontal bars indicate 95% confidence intervals (95% CI). The diamond shows the overall effect size (ES) with its corresponding 95% CI.
failed to show any association with job-stress. No difference was de- tected between the subgroups p = 0.739. Meta-regression did not show association between the female-male ratio and the ES (p = 0.587).
For total cholesterol, only a tendency for positive association was detected (not shown). An overall ES of 3.91 mg/dl, with 95% CI:
−0.52, 8.33 p = 0.083 with high heterogeneity based on I- squared = 93.6, p = 0.001 were calculated (not shown). Small-study effect did not seem to contribute to these results (Egger’s test:
p = 0.65). Subgroup analysis showed that neither global nor job-spe- cific stress correlated with total cholesterol: ES = 1.28 mg/dl with 95%
CI:−5.70, 8.25 p = 0.72 for global stress, ES = 5.71 mg/dl with 95%
CI:−0.71, 12.13 p = 0.081 for job-specificl stress. Heterogeneity was high in both subgroups: I-squared = 57.2%, p = 0.097 for global, I- squared = 80.8%, p = 0.001 for job-specific. No difference was de- tected subgroups p = 0.36. Meta-regression did not show association with the female-male ratio (p = 0.204).
3.2.3. Carbohydrate metabolism
Unfortunately, such parameters of carbohydrate metabolism, as glycated hemoglobin level, values indicating impaired oral glucose tolerance or insulin resistance, were not reported in sufficient quantity in the analyzed studies. With regard to the available data, no overall correlation was found between stress and fasting glucose (FG, p = 0.364, not shown). Small-study effect did not seem to contribute to these results (Egger’s test: p = 0.25). However, subgroup analysis re- vealed that job-specific stress correlated positively with FG:
ES = 1.56 mg/dl with 95% CI: 0.76, 2.35 p = 0.001. Heterogeneity in this subgroup was low: I-squared = 0.0%, p = 0.91. For global stress, no significant correlation was found: ES =−0.30 mg/dl with 95% CI:
−2.21, 1.61 p = 0.759. Heterogeneity in this subgroup was high: I- squared = 58.1%, p = 0.049. The difference between the subgroups did not reach statistical significance p = 0.079. Meta-regression de- monstrated a negative association between the female-male ratio and the ES (p = 0.042). These results suggest that the correlation is stronger in men.
3.2.4. Systolic and diastolic blood pressure
No overall correlation was found between stress and systolic blood pressure in our meta-analysis (p = 0.271), however subgroup analysis indicated a surprising negative correlation between global stress and SBP: (ES −1.38 mmHg with 95% CI−1.96,−0.79 p = 0.001) (not shown). Low heterogeneity based on I-squared = 0%, p = 0.484 was calculated. Small-study effect also appears to contribute to these results (Egger’s test: p = 0.03). In the job-specific stress subgroup there was no correlation: ES−0.82 mmHg with 95% CI−3.15, 1.51 p = 0.492) (not shown). High heterogeneity based on I-squared = 75.3%, p = 0.001 was calculated. The difference between the subgroups did not reach statistical significance p = 0.648. Meta-regression did not show asso- ciation between the female-male ratio and the ES (p = 0.771).
Some overall positive correlation was indicated for stress and dia- stolic blood pressure. Although our standard analysis (using the ERI method for the evaluation of perceived stress in the study ofSöderberg et al. (2012)) failed to show any correlation for stress and DBP (p = 0.428), but a slightly modified analysis (using the JDC test in the same study) could detect positive correlation between these factors (ES 1.04 mmHg with 95% CI 0.18, 1.89 p = 0.018) (not shown). Low het- erogeneity based on I-squared = 0%, p = 0.454 was calculated. Small- study effect also appears to contribute to these results (Egger’s test:
p = 0.01). Subgroup analysis indicated a positive correlation between global stress and DBP: ES 1.49 mmHg with 95% CI 0.11, 2.88 p = 0.034 (not shown). Low heterogeneity based on I-squared = 0%, p = 0.516 was calculated. No correlation was found for job-specific stress: ES
−0.07 mmHg with 95% CI−1.68, 1.55 p = 0.934 (not shown). High heterogeneity based on I-squared = 53.6%, p = 0.091 was calculated.
The difference between subgroups was not significant (p = 0.15). Meta- regression did not show association with the female-male ratio
(p = 0.635).
3.3. Meta-analysis of the association between metabolic syndrome and perceived stress
Based on those four studies that reported stress levels of individuals with and without metabolic syndrome, the classic random effects model failed to show any association between metabolic syndrome and per- ceived stress level. Weighted overall ES was 0.013 with 95% CI (−0.212, 0.238), p = 0.909. Heterogeneity of the data was high: I- squared = 79.5%, p = 0.002. No small-study effect was detected by the Egger’s test.
4. Discussion
Our present study aimed to review the literature on the potential correlation between perceived stress as indicated by various ques- tionnaires and parameters of the metabolic syndrome complemented by a meta-analysis of the available human data. We intended to identify possible explanations for previous contradictoryfindings and to suggest new methodological approaches for future clinical studies.
4.1. Correlation between stress, visceral obesity and dyslipidemia Our results confirmed that higher stress shows significant correla- tion with increases in BMI (Fig. 2) and increased waist circumference (WC) (Fig. 3), indicating visceral obesity. Thus, our findings are in agreement with previous reports that describe a similar relationship between stress and visceral obesity (Brunner et al., 2007;Magnavita, 2015;Marniemi et al., 2002) and contradict some Scandinavian studies that failed to show such a correlation (Jönsson et al., 1999). High heterogeneity of the data indicated the involvement of important moderators of these correlations. Further analysis revealed that the correlation of job-specific stress with BMI and WC was stronger and showed low heterogeneity (as compared with global stress). Moreover, the correlation for WC appeared to be stronger for men. This observa- tion suggests that the association between job stress and metabolic outcomes may be stronger among men. It appears that work stress is more likely to influence their metabolic syndrome profile for reasons that are yet to be determined.
Job-specific stress is also closely linked to an effort-reward im- balance or reward deficiency that is a core theory with regard to the literature of overeating (van de Giessen et al., 2012;Verbeken et al., 2012). Mason et al. demonstrated that for obese individuals receiving different life-style interventions, correction of the reward imbalance was a significant mediator, while a general reduction of the global stress score was not (Mason et al., 2016). The individual differences in the readiness to consume high-fat and/or high-refined carbohydrate foods may also contribute to the high heterogeneity of data (Weinstein et al., 1997;Block et al., 2009; Harris, 2015). Unfortunately, in our meta-analysis, dietary information was not reported in sufficient quantity.
We have found a similar correlation between perceived stress and elevated serum triglyceride level (Fig. 4) especially in men that was also significant in the job-specific stress, but not in the global stress sub- group. Thesefindings are in accord with those concerning WC, there- fore they may also emphasize the potential association between higher job-stress of men leading to reward deficiency and consequent over- eating. With regard to the correlation between high stress level and decreased serum HDL, another major parameter used in most diagnostic systems of metabolic syndrome, our standard analysis failed to confirm statistical significance. However, following application of the Duval and Tweedie's trim and fill algorithm and the addition of three missing studies to establish symmetry, a significant negative correlation be- tween stress and HDL emerged. Moreover, subgroup analysis revealed a stronger negative correlation with global stress and no correlation with
job-specific stress (Fig. 5). In this case, gender did not appear to in- fluence the association. Thesefindings indicate a different pattern for HDL, the level of which is higher in females and is more closely asso- ciated with physical activity (Kelley et al., 2004). Unfortunately, phy- sical activity of participants was not reported in the analyzed studies. In case of higher stress and elevated serum total cholesterol, only a ten- dency was detectable that did not reach statistical significance. This tendency follows the pattern of WC and TG, it may be detected only in case of job-specific stress and the effect size appers to be somewhat higher in men. Thus, our results support a correlation between psy- chologic stress and visceral obesity and dyslipidemia. These findings are in accord with the suggestions raised byBergmann et al. (2014)in their systematic review based on the analysis of prospective cohort studies. This agreement between the two reviews reflects a consistent correlation between perceived stress versus elevated BMI and dyslipi- demia, since we had to exclude most studies used by Bergmann as they contained adjusted values (e.g. for age, social status or BMI, etc.) un- suitable for meta-analysis. We arrived to the same conclusion based on an almost entirely different data pool. These results also confirm the conclusion of such reports of the literature that found an effect of stress on various assortments of serum lipid parameters (Belkićet al., 2000;
Djindjic et al., 2012;Gimeno et al., 2010;Jovanovićet al., 2008;Peter et al., 1998). Future studies are needed to resolve the contradictory findings of other clinical studies that failed tofind correlation between stress and serum lipids (Alfredsson et al., 2002;Jönsson et al., 1999).
4.2. Correlation between stress and fasting glucose
With regard to abnormal carbohydrate metabolism, articles re- ported fasting glucose only in sufficient quantity. Fasting glucose values have low stability from day to day especially for higher risk individuals (Nuttal et al., 2004). Despite numerous reports describing positive correlation between stress and indicators of carbohydrate metabolism (Belkićet al., 2000;Ismail et al., 2004;Jovanovićet al., 2008;Kumari et al., 2004;Kawada, 2013;Li et al., 2013), our analysis confirmed such a correlation between stress and fasting glucose only for job-specific stress, but not for global stress. Unfortunately, other more reliable parameters of carbohydrate metabolism such as glycated hemoglobin, impaired oral glucose tolerance or insulin levels were not reported in sufficient quantity in the eligible studies.
4.3. Correlation between stress and blood pressure
We detected a significant, albeit small positive correlation between stress and diastolic blood pressure without any detectable gender-dif- ference. Subgroup analysis revealed a significant positive correlation between global stress and diastolic pressure. Job-specific stress failed to show any such correlation. The positive correlation between stress and diastolic blood pressure is in accord with previous observations, but the lack of correlation with job-specific stress is contradictory with previous reports (Gilbert-Ouimet et al., 2012; Landsbergis et al., 2013). With regard to systolic blood pressure values, the surprising negative corre- lation with stress also appears to contradict previous findings of the literature (Landsbergis et al., 2013).
4.4. Gender differences in the literature on stress and metabolic syndrome There was a low number of available studies that handled female groups separately. Therefore, no comparison between females and males was possible. With regard to men (in case when the ERI stress assessment method was applied in the study ofSöderberg et al. (2012)), BMI alone showed significant correlation with stress. When, on the other hand, the demand-control stress assessment was taken into con- sideration for the study ofSöderberg et al. (2012), significant correla- tions were found for BMI and serum triglyceride level and a tendency for diastolic pressure approaching statistical significance.
In the future more cohort studies should be conducted to investigate the stress-associated cardiometabolic changes in female populations and to reveal gender-differences. In the literature, somefindings seem to suggest that gender influences the reactions to stress (Bale and Epperson, 2015).Söderberg et al. (2012)reported an interesting dif- ference between the effect of stress assessed by ERI in men and women.
While men exposed to high stress (assessed by ERI) show several component of metabolic syndrome (high systolic BP, high TG, high LDL, low HDL), women in the same group were characterized by low BMI and low level of dyslipidemia. Moreover, demand-control job stress assessment proved to be a better indicator in men (especially in blue- collar workers) than effort-reward that is more widely used in clinical studies (Söderberg et al., 2012). Gender may also influence the ex- posure to different types of stress, as women are more likely to become caregivers that is also associated with chronic stress (Seematter et al., 2004;Ardito et al., 2014).
It is also important to note that culture socializes men and women to express different emotions under stress. Women have been shown to express sadness, anxiety or depression more often, whereas a„fight or flight” reaction with increased blood pressure or increased alcohol consumption were more frequently observed in men in chronic stress (Lundberg, 2005; Kajantie and Phillips, 2006; Chaplin et al., 2008).
Such different emotions and behaviors are associated with different patterns of stress physiology (e.g., vagal withdrawal in womenversus higher sympathetic activation in men or different degrees of activation of the HPA axis in women and men) (Lundberg, 2005; Kajantie and Phillips, 2006;Chaplin et al., 2008). Such different stress reactions may have, in turn, different downstream effectsthat should be investigated in the future.
4.5. Limitations of our meta-analysis
Some limitations of our meta-analysis stem from the fact that per- ceived stress is necessarily self-reported and, thus, subjective.
Moreover, stress assessment was based on different questionnaires:
some aimed at the evaluation of job-related stress, others analyzed general life stress, yet others focused on psychological distress (GHQ).
Other sources of limitations included the different metabolic syndrome guidelines and definitions that individual studies used. Those incon- sistencies may have influenced the analysis focusing on metabolic syndrome and stress (Results 3.3). Moreover, reliable parameters of carbohydrate metabolism such as glycated hemoglobin, values in- dicating impaired oral glucose tolerance or insulin levels were not re- ported in sufficient quantity in the eligible studies. Only fasting glucose values were available in sufficient quantity that show considerable day- to-day variation. Such variations may have influenced the outcome of our analysis. Our meta-analysis detected the strongest correlation be- tween stress and visceral obesity. It is well-known that stress-induced inflammation has a close correlation with visceral fat accumulation (Speaker and Fleshner, 2012), however it is not part of the criteria of metabolic syndrome. It is important to emphasize that our data appear to suggest that the future focus of this area of research is less about continuing to investigate a relationship with the aggregate construct of metabolic syndrome, but to better understand the relationships be- tween stress and specific components of the metabolic syndrome, such as visceral obesity, blood lipid profile or blood pressure. Metabolic syndrome as a construct must also continue to evolve in the future, as we increasingly understand the mechanisms activated by visceral obe- sity and with the help of the omics technologies to identify a broad range of biomarkers of this syndrome.
Dietary information and indicators of physical activity of partici- pants were also not reported in the analyzed studies, therefore no fur- ther analysis of additional moderators was possible. Different age, so- cial and job status of participants belonging to different ethnic groups [e.g. Italian and Indian police officers (Garbarino and Magnavita, 2015;
Walvekar et al., 2015), Korean ship workers (Kang et al., 2004), African
American or Mexican volunteers (Khan et al., 2015; Ortega-Montiel et al., 2015), obese patients from an American weight management program (Abraham et al., 2013), postmenopausal women from the San Francisco Bay (Aschbacher et al., 2014), etc.] may also have influenced our analyzed outcomes. The low number of studies that handled and reported data of female groups separately did not allow proper gender analysis. In addition, such variable technical details of available studies, such as the prospective or cross-sectional feature of the studies or the heterogeneous population numbers (from 61 to 5227) or the necessary conversions of parameters given in different units, or contraction of subgroups also added to our limitations.
4.6. Perspectives for future studies
While interesting recent studies have already investigated the in- fluence of different types of stress (reward imbalance versus global stress) on successful weight reducing interventions (Mason et al., 2016), prospective studies conducted in the future should screen perceived stress and parameters of the metabolic syndrome at all phases of the trial. Longitudinal studies would be able to demonstrate the presence or absence of a causal relationship between psychosocial stress and me- tabolic syndrome. In our meta-analysis global stress measures were not as predictive as job-related stress, therefore future studies should tap into role stress, e.g. in case of caregivers, interpersonal or attachment stress should also be tested.
In addition, future studies should analyze the relationship between stress and metabolic syndrome separately in women and men, in order to investigate gender-differences. Concerning stress-induced mechan- isms that may promote metabolic syndrome, the role of visceral obesity should be explored, since some individual high-stress female groups (Söderberg et al., 2012) with low BMI and waist circumference failed to present any feature of metabolic syndrome. Intervention studies (in- volving healthy diet and physical training) aiming at the normalization of body weight and body composition in high- and low-stress groups, could reveal the contribution of visceral fat accumulation in stress-in- duced dyslipidemia or on the other hand they may analyze the effects of different types of stress on the efficacy of such interventions.
Disclosures
All authors disclaim any form of conflicts of interest.
Funding
This work was supported by grants from the European Union and the Hungarian Government (EFOP-3.6.2-16-2017-0006 to P.H.) and from the University of Pécs, Hungary (PTE ÁOK-KA No: 2017/12 to E.P, PTE ÁOK-KA No: 2017/13 to M.B., and PTE-AOK-KA-2015-14 to M.S.).
Acknowledgement
The present scientific contribution is dedicated to the 650th anni- versary of the foundation of the University of Pécs, Hungary.
References
Abraham, S.B., Rubino, D., Sinaii, N., Ramsey, S., Nieman, L.K., 2013. Cortisol, obesity, and the metabolic syndrome: a cross-sectional study of obese subjects and review of the literature. Obesity (Silver Spring) 21 (1), E105–E117.
Alberti, K.G., Zimmet, P., 1998. Definition, diagnosis and classification of diabetes mel- litus and its complications. Part 1: diagnosis and classification of diabetes mellitus provisional report of a WHO consultation. Diabetes Med. 15, 539–553.
Alberti, K.G., Zimmet, P., 2006. The metabolic syndrome: time to reflect. Curr. Diabetes Rep. 6, 259–261.
Alberti, K.G., Zimmet, P., Shaw, J., 2005. IDF epidemiology task force consensus group.The metabolic syndrome-a new worldwide definition. Lancet 366 (9491), 1059–1062.
Alfredsson, L., Hammar, N., Fransson, E., de Faire, U., Hallqvist, J., Knutsson, A., Nilsson,
T., Theorell, T., Westerholm, P., 2002. Job strain and major risk factors for coronary heart disease among employed males and females in a Swedish study on work, lipids andfibrinogen. Scand. J. Work Environ. Health 28 (4), 238–248.
Almadi, T., Cathers, I., Chow, C.M., 2013. Associations among work-related stress, cor- tisol, inflammation, and metabolic syndrome. Psychophysiology 50 (9), 821–830.
Ardito, C., d’Errico, A., Leombruni, R., 2014. Exposure to psychosocial factors at work and mental well-being in Europe. Med. Lav. 105 (2), 85–99.
Aschbacher, K., Kornfeld, S., Picard, M., Puterman, E., Havel, P.J., Stanhope, K., Lustig, R.H., Epel, E., 2014. Chronic stress increases vulnerability to diet-related abdominal fat, oxidative stress, and metabolic risk. Psychoneuroendocrinology 46, 14–22.
Bale, T.L., Epperson, C.N., 2015. Sex differences and stress across the lifespan. Nat.
Neurosci. 18 (10), 1413–2420.
Balkau, B., Vernay, M., Mhamdi, L., Novak, M., Arondel, D., Vol, S., Tichet, J., Eschwège, E., D.E.S.I.R. Study Group, 2003. The incidence and persistence of the NCEP (National Cholesterol Education Program) metabolic syndrome. The French D.E.S.I.R.
study. Diabetes Metab. 29 (5), 526–532.
Belkić, K., Schwartz, J., Schnall, P., Pickering, T.G., Steptoe, A., Marmot, M., Theorell, T., Fossum, E., Høieggen, A., Moan, A., Rostrup, M., Kjeldsen, S.E., 2000. Evidence for mediating econeurocardiologic mechanisms. Occup. Med. 15 (1), 117–162.
Bergmann, N., Gyntelberg, F., Faber, J., 2014. The appraisal of chronic stress and the development of the metabolic syndrome: a systematic review of prospective cohort studies. Endocr. Connect. 3 (2), R55–80.
Bierhaus, A., Wolf, J., Andrassy, M., Rohleder, N., Humpert, P.M., Petrov, D., Ferstl, R., von Eynatten, M., Wendt, T., Rudofsky, G., Joswig, M., Morcos, M., Schwaninger, M., McEwen, B., Kirschbaum, C., Nawroth, P.P., 2003. A mechanism converting psy- chosocial stress into mononuclear cell activation. Proc. Natl. Acad. Sci. U. S. A. 100 (4), 1920–1925.
Block, J.P., He, Y., Zaslavsky, A.M., Ding, L., Ayanian, J.Z., 2009. Psychosocial stress and change in weight among US adults. Am. J. Epidemiol 170 (2), 181–192.
Borráz-León, J.I., Cerda-Molina, A.L., Mayagoitia-Novales, L., 2017. Stress and cortisol responses in men: differences according to facial symmetry. Stress 19, 1–7.
Brunner, E.J., Chandola, T., Marmot, M.G., 2007. Prospective effect of job strain on general and central obesity in the Whitehall II study. Am. J. Epidemiol. 165 (7), 828–837.
Chaplin, T.M., Hong, K., Bergquist, K., Sinha, R., 2008. Gender differences in response to emotional stress: an assessment across subjective, behavioral, and physiological do- mains and relations to alcohol craving. Alcohol. Clin. Exp. Res. 32 (7), 1242–1250.
Chen, Y.J., Lin, C.L., Li, C.R., Huang, S.M., Chan, J.Y., Fang, W.H., Chen, W.L., 2016.
Associations among integrated psychoneuroimmunological factors and metabolic syndrome. Psychoneuroendocrinology 74, 342–349.
Chuang, J.C., Krishnan, V., Yu, H.G., Mason, B., Cui, H., Wilkinson, M.B., Zigman, J.M., Elmquist, J.K., Nestler, E.J., Lutter, M., 2010. A beta3-adrenergic-leptin-melanocortin circuit regulates behavioral and metabolic changes induced by chronic stress. Biol.
Psychiatry 67 (11), 1075–1082.
Cohen, S., Janicki-Deverts, D., 2012. Who’s stressed? Distributions of psychological stress in the United States in probability samples from 1983, 2006, and 20091. J. Appl. Soc.
Psychol. 42, 1320–1334.
Cohen, S., Kamarck, T., Mermelstein, R., 1983. A global measure of perceived stress. J.
Health Soc. Behav. 24 (4), 385–396.
Deak, T., Quinn, M., Cidlowski, J.A., Victoria, N., Murphy, A.Z., Sheridan, J.F., 2015.
Neuroimmune mechanisms of stress: sex differences, developmental plasticity, and implications for pharmacotherapy of stress-related disease. Stress 18 (4), 367–380.
Dickerson, S.S., Kemeny, M.E., 2004. Acute stressors and cortisol responses: a theoretical integration and synthesis of laboratory research. Psychol. Bull. 130, 355–391.
Djindjic, N., Jovanovic, J., Djindjic, B., Jovanovic, M., Jovanovic, J.J., 2012. Associations between the occupational stress index and hypertension, type 2 diabetes mellitus, and lipid disorders in middle-aged men and women. Ann. Occup. Hyg. 56 (9), 1051–1062.
Ervin, R.B., 2009. Prevalence of metabolic syndrome among adults 20 years of age and over, by sex, age, race and ethnicity, and body mass index: United States, 2003–2006.
Natl. Health Stat. Rep. 13, 1–7.
Garbarino, S., Magnavita, N., 2015. Work stress and metabolic syndrome in police offi- cers. Prospect. Study 10 (12), e0144318.
Gilbert-Ouimet, M., Brisson, C., Vézina, M., Milot, A., Blanchette, C., 2012. Repeated exposure to effort-reward imbalance, increased blood pressure, and hypertension incidence among white-collar workers: effort-reward imbalance and blood pressure.
J. Psychosom. Res. 72 (1), 26–32.
Gimeno, D., Tabák, A.G., Ferrie, J.E., Shipley, M.J., De Vogli, R., Elovainio, M., Vahtera, J., Marmot, M.G., Kivimäki, M., 2010. Justice at work and metabolic syndrome: the Whitehall II study. Occup. Environ. Med. 67 (4), 256–262.
Goldberg, D.P., Hillier, V.F., 1979. A scaled version of the General health questionnaire.
Psychol Med. 9 (1), 139–145.
Grimble, R.F., 2002. Inflammatory status and insulin resistance. Curr. Opin. Clin. Nutr.
Metab. Care 5, 551–559.
Grundy, S.M., Brewer Jr, H.B., Cleeman, J.I., Smith Jr, S.C., Lenfant, C., National Heart, Lung, and Blood Institute, American Heart Association, 2004. Definition of metabolic syndrome: report of the National Heart, Lung, and Blood Institute/American Heart Association conference on scientific issues related to definition. Arterioscler Thromb.
Vasc. Biol. 24 (2), e13–18.
Guyatt, G.H., Oxman, A.D., Vist, G.E., Kunz, R., Falck-Ytter, Y., Alonso-Coello, P., GRADE Working Group, et al., 2008. GRADE: an emerging consensus on rating quality of evidence and strength of recommendations. BMJ 336 (7650), 924–926.
Harris, R.B., 2015. Chronic and acute effects of stress on energy balance: are there ap- propriate animal models? Am. J. Physiol. Regul. Integr. Comp. Physiol. 308 (4), R250–R265.
Herzog, R., Álvarez-Pasquin, M.J., Díaz, C., Del Barrio, J.L., Estrada, J.M., Gil, Á., 2013.