Pázmány Péter Catholic University
Faculty of Information Technology and Bionics
Bálint Péter Kerekes
COMBINED TWO-PHOTON IMAGING,
ELECTROPHYSIOLOGICAL AND ANATOMICAL INVESTIGATION OF THE HUMAN NEOCORTEX IN
VITRO
Ph.D DISSERTATION
Budapest 2015
Contents
Contents... 2
List of abbreviations ... 4
1 Introduction ... 6
2 Main goals ... 8
3 Brief overview ... 10
3.1 The Cerebral Cortex ... 10
3.2 Cell types ... 13
3.2.1 Excitatory cells ... 13
3.2.2 Inhibitory cells ... 14
3.3 Electrophysiology ... 15
3.3.1 Electrical properties of the brain... 17
3.3.2 Brain electric recording techniques ... 18
3.3.3 In vitro and in vivo human brain tissue preparations for electrical recordings ... 20
3.3.4 EEG graphoelements ... 21
3.4 Epilepsy ... 23
3.4.1 Tumor based epilepsies ... 25
3.4.2 Cortical dysgenesis ... 26
3.4.3 SPA and interictal activity ... 26
3.5 Two-photon microscopy ... 28
3.5.1 Theoretical background of two-photon microscopy ... 29
3.5.2 Hardware of a two photon microscope ... 31
3.5.3 Laser Sources ... 32
3.5.4 Scanning Methods (x-y plane) ... 33
3.5.5 Objectives ... 34
3.5.6 Detectors ... 34
3.6 Neuronal calcium signals ... 35
3.6.1 Calcium indicators ... 37
3.6.2 Calcium Imaging ... 37
4 Materials and methods ... 39
4.1 Patients ... 40
4.2 Tissue preparation... 41
4.3 Electrophysiology recordings ... 42
4.3.1 Laminar recordings ... 42
4.3.2 Data transmission systems ... 43
4.4 Micropipettes ... 44
4.4.1 Local field potential ... 44
4.4.2 Intracellular ... 45
4.5 Multiphoton imaging ... 46
4.6 Multiphoton glutamate uncaging ... 49
4.7 Data analysis ... 50
4.8 Cell morphology ... 51
4.9 Electron microscopy ... 52
5 Results ... 53
5.1 Recording the spontaneous network activity by simultaneous Ca2+ imaging and field-potential measurements ... 53
5.2 Intracellular recordings ... 58
5.3 Anatomy ... 60
5.4 Electron microscopy ... 62
6 Conclusion... 65
7 Future plans ... 68
8 Acknowledgements ... 69
9 References... 70
10 Publications ... 80
10.1 Papers ... 80
10.2 Posters ... 80
10.3 Presentations ... 81
List of abbreviations
2P – two-photon
ACSF – artificial cerebrospinal fluid AM – Acetoxymethyl
AMPA – α-amino-3-hydroxy-5-methyl-4-isoxazolepropionic acid AO – acousto-optic
AP – action potential
BAPTA – 1,2-bis(o-aminophenoxy)ethane-N,N,N',N'-tetraacetic acid BPAP – backpropagating action potential
BP5AP – 5 backpropagating action potential CSD – current source density
DMSO – Dimethyl sulfoxide ECoG – electrocorticography EEG – electroencephalography
EPSP – excitatory postsynaptic potential fMRI – functional magnetic resonance imaging FRB – fast rhythmic bursting
FS – fast spiking
GABA – γ-amino-butyric acid
GECI – genetically encoded calcium indicator IB – intrinsic burst
IC – intracellular
IP3R – inositol trisphosphate receptors IPSP – Inhibitory postsynaptic potential LFP – local field potential
LFPg – local field potential gradient mGluR – metabotropic glutamate receptors MR – magnetic resonance
MTLE – medial temporal lobe epilepsy MUA – multi-unit activity
NA – numerical aperture
nAChR – nicotinic acetylcholine receptors NCX – sodium-calcium exchanger
NMDA – N-methyl-D-aspartate OGB-1 – Oregon green BAPTA-1
PMCA – plasma membrane calcium ATPase PMT – photon multiplier tube
Pt - patient
ROI – region of interest RS – regular spiking RyR – ryanodine receptors SC – stellate cells
SD – standard deviation
SERCA – sarco-/endoplasmic reticulum calcium ATPase SNR – signal to noise ratio
SPA – Spontaneous synchronous population Activity SR101 – Sulforhodamine 101
SUA – single-unit activity TLE – temporal lobe epilepsy
TRCP – transient receptor potential type C VGCC – voltage-gated Ca2+ channel
1 Introduction
Epilepsies are one of the most common neurological disorders in humans. According to the definition of the WHO, epilepsy is a chronic brain disorder, with different etiology, characterized by spontaneous recurrent seizures emerging from the excessive and pathologically hypersynchronous firing of a large amount of neurons [1] [2].
Though a large variety of antiepileptic drugs are available nowadays, a significant number ofpatients are pharmacoresistant [3]. In those cases, where the epileptic focus can be precisely localized epilepsy surgery is a possible solution for blocking seizures [4].
Healthy neocortical tissue is also routinely removed due to surgical technical reasons from patients with tumor but without epilepsy, when the pathological mass is localized in the subcortical areas. Comparing the morphology and activity of epileptic and non-epileptic human brain tissue offers an excellent possibility to investigate the normal and impaired neuronal mechanisms at the network, single cell and subcellular levels [5] [6] [7] [8].
Spontaneous synchronous population activity (SPA) can be observed in vitro during extracellular electrophysiological recording of local field potentials (LFP) in epileptic human neocortical slice preparations in physiological bathing medium (according to our unpublished observations, [6] [9] [10]). These synchronous population bursts consist of rhythmically recurring extracellular LFP deflections associated with high frequency oscillations and an increased neuronal firing [6]. Both glutamatergic excitatory and GABAergic inhibitory signaling is involved, pyramidal cells show either depolarizing or hyperpolarizing and even mixed responses during SPA (according to our unpublished observations).
Calcium imaging of neurons is widely used to monitor cellular activity in animal slice preparations (for review see [11] however, we have only limited knowledge about Ca2+
concentration changes in human neurons. Calcium imaging of human neurons was investigated in cells differentiated from induced pluripotent stem cell lines [12], and in cultured neurons of the enteric nervous system [13]. Furthermore, a recent study shows spontaneous Ca2+ elevations in human neocortical and hippocampal astrocytes [14], but nothing is known about the intracellular Ca2+ properties of neurons derived from native human tissue of the central nervous system.
While two-photon Ca2+ imaging technique has high spatial resolution (<1 µm), it can cover only a relatively small area of interest (<1x1 mm). On the other hand, multiple channel extracellular electrophysiology can cover large cortical areas (3-4 mm) at the expense of its low spatial resolution (100 µm). The activity of neurons restricted to one or two cortical layers (<1
mm) can be monitored with two-photon imaging, whereas multiple channel extracellular electrophysiology is needed to record the activity of neurons in the entire depth (3-4 mm) of the human neocortex. The temporal resolution of the two techniques is also different:
electrophysiological changes reflecting neuronal activity are considerably faster (<1 ms) than changes in intracellular Ca2+ (usually more than 100 ms). Combining these two methods has several advantages. First, it helps us to gain more information on the role of different neurons in the emergence of population activity. Recording with the aid of the linear multielectrode gives information about the fast electrophysiological properties of SPA, detected in all neocortical layers, whereas Ca2+ imaging reveals the activity of a relatively large group of neighboring neurons (tens of bulk loaded cells), and their contribution to the generation of SPA. In addition, two-photon microscopy can detect inactive neurons, which are unnoticed in extracellular electrophysiological recordings. Second, the simultaneous use of Ca2+ imaging and whole cell patch clamp recording helps us to correlate electrophysiological activity and Ca2+ signals in human neurons. One can simultaneously observe and manipulate the membrane potential fluctuations of neurons with intracellular patch clamp recordings and relate to changes in their Ca2+ concentrations. Completing these measurements with the detection of extracellular activity we can relate electrophysiological and Ca2+ signals of neurons active during SPA. In addition to Ca2+ imaging, two-photon uncaging can be used to investigate neuronal input-output functions and postsynaptic signal integration. Cell filling and anatomical reconstruction at the light and electron microscopic level may add important morphological information about the subcellular, cellular and network properties of human neocortical neurons.
2 Main goals
SPA can be detected with electrophysiological methods in cortical slices of epileptic patients, maintained in physiological medium in vitro. With EEG, and LFP measurements we can only have informations about the summarized activity of a group of neurons. We can’t show how many of the neurons (and which type) were active, and especially how many weren’t even involved in the discharge in the LFP. We wanted to gain additional spatial information about the network mechanisms, and the cells which are involved in the SPA generation, so we needed a new methodology.
The aim of the thesis was to develop a method combining multiple channel extracellular electrophysiology, simultaneous intracellular recording, and two-photon Ca2+ imaging or uncaging supplemented by fine scale morphological analysis, to make it possible to understand what is going on in the individual cells behind the LFP.
Here we report for the first time the two-photon Ca2+ imaging of human neocortical neurons derived from epileptic and non-epileptic brain tissue.
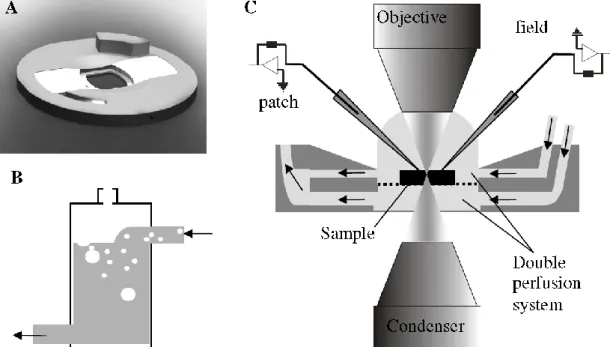
Neocortical slices prepared from postoperative tissue of epileptic and tumor patients were maintained in a dual perfusion chamber in physiological incubation medium. SPA was recorded with a 24 channel extracellular linear microelectrode covering all neocortical layers.
After identifying the electrophysiologically active regions of the slice, bulk loading of neuronal and glial markers was applied on the tissue. SPA related Ca2+ transients were detected in a large population of neighboring neurons with two-photon microscopy, simultaneously with extracellular SPA and intracellular whole cell patch clamp recordings. The intracellularly recorded cells were filled for subsequent anatomy. The cells were reconstructed in three dimensions and examined with light- and transmission electron microscopy.
This complex method -combining high spatial resolution two-photon Ca2+ imaging techniques and high temporal resolution extra- and intracellular electrophysiology with cellular anatomy- is suitable to reveal subcellular, cellular and network properties of human neocortical neurons engaged in spontaneous population activity and may permit a deeper understanding of the structural and functional properties of the human neocortex. The methodological difficulties we faced during the experiments will also be described.
This work is structured around the following theses on the basis of the above-mentioned aims.
Thesis I: A method has been developed for the two-photon Ca2+ imaging of human neocortical tissue (see in the Materials and methods section).
Thesis II: The extracellular recording system was successfully combined with the two- photon microscope system. This way the epileptic and non-epileptic human neocortical neurons Calcium responses during SPA was compared.
Thesis III: The functional coupling of LFP, Calcium responses and intracellular activity in human neocortical interneurons and pyramidal cells during SPA will be demonstrated.
Thesis IV: The electrophysiological and imaging measurements were succesfully combined with anatomical reconstruction of the intracellularly loaded cells, to gain more information of the morphology of the loaded cells.
Thesis V: The electron microscopic ultrastructure of the filled and reconstructed pyramidal cell will be described at electron microscopic level.
3 Brief overview
There will be an overview of the fields necessary to understand the research.
The anatomy and physiology of the cerebral cortex will be presented.
The electrical properties of the brain and the different electrophysiological measurement types will be introduced.
We will present the necessary informations about epilepsy and some pathophysiology, which were involved in this study.
We will provide the LFP signals which upon this study is started, and the principles of Spontaneous synchronous Population Activity. How the LFP signal was defined first, and how its understanding developed. Based on these foundations the importance of the method described in the “Materials and methods” section will be discussed.
We will discuss the field of two-photon microscopy, its phenomenon, and the calcium imaging’s significance in this study.
3.1 The Cerebral Cortex
In this chapter, there will be an overview of the structure and function of the cerebral cortex, because in this research we focus mostly to this part of the brain. The basic cell types, and their role in the system will be also presented.
The cerebrum is covered by the cortex which is the largest portion of the brain. The cortex width is between 2-4 mm in humans, (depending on which area we take). The cortex takes a key part in many higher order processes, like remembering, attention, speaking, learning, and so on. Its surface is around 220.000 mm2, 560 cm3 volume, and 581 g weight in humans [15] [16].
The cortex contains around 14-16 billion neurons, and each of them can connect to more than 10.000 neurons. The phylogenetically older part of the cortex cerebri called allocortex, it contains the archicortex (hippocampus and dentate gyrus) and paleocortex (parahippocampal gyrus, olfactory cortex), the other part called isocortex (neocortex).
There are two distinct compartments of the brain, one is the white matter which contains mostly long myelinated fibers, the other is the gray matter, which contains the cell bodies, a high amount of short fibers, and most of the synapses [17].
In the brain development the cortex grows quicker than the white matter, this is how its fissures (deep ditches), sulcuses (shallow ditches) and gyruses (bossings between the grooves) are formed, and this is how the skull can contain this huge amount. However, this gyrification brings more than functional advantages, for instance, the connection between areas are much shorter. The two hemispheres of the cerebrum are severed by the fissure longitudinalis [18].
In the cortex, we can differentiate 4 major lobes, the frontal, the parietal, the occipital, the temporal lobes, and there are a little part in the lateral cerebral sulcus, the insular cortex.
The frontal lobe is bordered by the lateral cerebral sulcus, and the sulcus centralis. In the frontal lobe, we can find the area of voluntary movement, higher intellectual functions, pain, Broca-s motor speech, and well-being.
The parietal lobe is bordered by the sulcus centralis in the front, the parietooccipital fissure in the back, and the lateral cerebral sulcus in the lower side. The parietal lobe integrates sensory information among various modalities.
The occipital lobe is bordered by the parietooccipital fissure in the front, in the convex, and the basal surface, the occipital lobe is not separated harshly by the parietal, and the temporal lobes.
The occipital lobe is the primer visual area of the brain.
The temporal lobe is severed from the frontal, and parietal lobes by the lateral cerebral sulcus.
Its major role is auditory, but has other functions as well, like process sensory input into derived meanings, the retention of visual memories, language comprehension, and emotion association [19].
We can part the cortex based on cytoarchitectural differences into 52 areas [20]. There was a more detailed division some years after Brodman’s work [15] which made 109 different area, and there are some newer detailed division novadays (see in [21] [22] [23] ), but the Brodman nomenclature is the most commonly used by scientists.
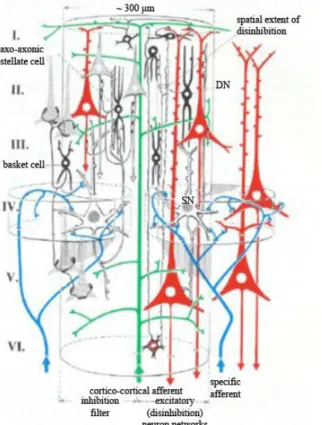
In the depth of the neocortex the neural cells forms 6 layers (Figure 1.):
Layer I. stratum zonale (plexiform): mostly fibers, stellate cells
Layer II. stratum granulosum externum: small granule cells, small pyramidal cells Layer III. stratum pyramidale: small pyramidal cells
Layer IV. stratum granulosum internum: granule cells
Layer V. stratum gangliosum (stratum pyramidale internum): big pyramidal cells Layer VI. stratum multiforme: spindle-, pyramidal cells
It is suggested [19] that the basic structural and functional component of the neocortex is the cortical column, which extends the whole cortical depth and 200-300 μm in diameter.
The cortex has 2 millions of these columns or modules, each contains 5000 cells. All of the modules sends axons to 50-100 other modules, and receives the same amount of afferents, which shows us the complexity of the neocortex [19].
Every region of the cortex has the same types of neurons, and in the connections between the different types of neurons are alike.
The neurons in the cortex can be separated by many aspects, like neurochemical and electrophysiological nature, or morphology. There are cells which use γ-amino-butyric acid (GABA) neurotransmitter molecules for inhibition, or others which use glutamate for excitation [24].
Based on morphological classifications, the pyramidal cell got its name from the shape of the soma. The pyramidal cells are responsible to form the most of the associational, commissural and projection pathways. The stellate (granular) cells, which makes short local networks. The basket cells axons go around the pyramidal cells bodies, while the chandelier cells connect mostly the axon initial segment of the pyramidal cells, and they make a local network. The disinhibitory cells axons go through all the layers of the cortex to cause inhibition on inhibitory cells.
Figure 1. A schematic of a cortical column. How the cells are arranged in the depth of the 6 layer (roman numerals refer to the layers), how the afferent and efferent connections are, and how the disinhibitory network is arranged. The red cells are pyramidal cells, black cells are inhibitory neurons, the green is a cortico cortical afferent fiber, blue lines are specific sensory afferents, (DN = disinhibitory neuron (axon reaches through all the layers), SN = spiny neuron (transmits excitatory nerve impulses)) [19].
A third partition can be made based on the spines (spines are the dendrite buttons, where the synapses are). Pyramidal cells and spiny stellate cells have a lot (mostly communicate via glutamate), but smooth stellate cells (mostly communicates via GABA) have few of the spines.
We can separate the cells by their electrophysiological properties as well. With intracellular current injections we can depolarize the cells in vitro or in vivo and they show different kinds of responses. [25] [26] [27] [28]. Some are fast spiking (FS) some regular spiking (RS), intrinsic burst (IB), and fast rhythmic bursting (FRB) neurons. [28] [29]. The firing can
be adapting, then the firing rate changes by the continuous excitation, or non-adapting, then the firing rate does not change.
The FS neurons can hold a high firing rate (tonic firing) without frequency adaptation, and the action potentials (AP) are short (~0.3 ms). There are inhibitory cells mostly in FS type.
The RS neurons respond quickly or slowly adapting AP sequences to the excitation (most of the pyramidal cells are RS type).
The IB cells respond with bursts for threshold current excitation, and they are followed by relatively long after hyperpolarization (these cells have many spines on their apical dendrites, and they can be found in each layer, except the first) [30] [31].
The FRB cells respond with frequently emerging (30-50 Hz) high frequency bursts (300-600 Hz) for depolarizing current. A portion of these cells are in the deep layers of the cortex, other types are local network making and have a lot or few spines [29].
The classification of the cells by firing rate can be problematic, because by the change of the membrane potential, the modulatory systems activity or the level of alertness can change from one firing type to another [32].
3.2 Cell types
3.2.1 Excitatory cells
The most commonly known cell type in the neocortex is the pyramidal cell, it is easily detectable in Nissl-stained slices. From the cone like soma’s tip (tip points to the surface, bottom to the white matter) one big dendrite goes towards the cortex surface (apical dendrite), there are some dendrites all around their base.
Almost every pyramidal cell’s apical dendrite reaches the layer I. Only exceptions are the pyramidal cells in layer VI. they reach just to layer IV. [33]. The basal dendrites of the layer III. pyramidal cells go towards the layer IV., where they get thalamocortical synaptic inputs. In layer IV. the pyramidal cells have diverse morphology: pyramidal cells with horizontal dendrite tree, bipolar pyramidal cells (they got a main dendrite to towards the surface of the cortex, and one towards the white matter), upside-down pyramidal cells (the tip of their soma looks in the direction of the white matter) [33]. The apical dendrite have many branches in the layer I. called dendritic tuft. The dendrites of the pyramidal cells have many spines. The axon starts from the base of the cell, with only a few collaterals in the beginning till the white matter.
By the electron microscopy terminology there are asymmetrical and symmetrical synapses. Symmetrical synapses are mostly inhibitory, asymmetric synapses are excitatory.
Synapses of the pyramidal cells are mostly asymmetric, but on their soma, axon initial segment, and proximal dendrites they get symmetrical synapses from inhibitory neurons. On the
distal dendrites the synapses are mostly on the spines, and they are asymmetrical, and both types can be found on the dendrite body. This gives rise to the opinion that the main role of inhibition of the pyramidal cell is total inactivation, and AP-s can only occur by a sum of many excitatory synaptic inputs [33].
There are 4 different sizes of pyramidal cells, small (1-12 μm), medium (20-25 μm), big (45-50 μm) and giant (70-100 μm) (for example Betz cells in the layer V.) [33]. The pyramidal cells are either RB or IB type firing. The RS type pyramids in layer V. are slender tufted, with little branching in layer I., the IB cells on the other hand are thick tufted, and have a large branching near the surface of the cortex [30] [34]. Star pyramidal cells are in between pyramidal cells and stellate cells. They have an apical dendrite (they do not reach to layer I., and just a few branches), and the basal dendrites are symmetrical [35]. Their soma are not pyramid like. The axon of the star pyramidal cell goes to layer II., III., and IV. of the cortex, some branches reach layer V., VI.
Stellate cells (SC) are separable by spine density in two distinct group: smooth, and spiny.
The spiny stellate cells have multipolar star-like cell body (mostly in layer IV.), the dendrites go from that in each direction, and the branching starts quite close to the soma, and densely spined [33].Their axon reaches towards the white matter, but branches the close to the soma (sometimes it gives a collateral which ends in the upper layers). They give excitatory asymmetrical synapses. The spiny SC-s get symmetrical synapses to their soma, and proximal dendrites. On the distal dendrite tree, they get a few symmetrical synapses, but mostly excitatory asymmetrical presynaptic connections to the spines. There are big and small sized spiny SC-s [36]. The axon goes through the white matter to other cortical areas in case of the big size Spiny SC-s, the small type has only local branches. In some cortical areas, where there are minimal Spiny SC, this way there is no real layer IV. (like in motor cortex) [19].
3.2.2 Inhibitory cells
The smooth stellate cells and the spiny SC-s have a morphological similarity in soma (10-30 μm diameter), and dendrite tree. Smooth SC’s axon branches locally in the cortex, it uses symmetrical GABA synapses. Smooth SC get different pattern input from those of pyramidal, and spiny SC. On the soma they have some excitatory, and mostly symmetric inhibitory synapses. On the distal dendrites it is almost the same, but the synapses are mostly asymmetrical.
Due their locality, they are often called interneurons. Smooth SC-s are the most heterogeneous group of the above cell types. There are at least 7-8 or even more different inhibitory cell groups by morphology [37]. According to dendrite morphology, there are bipolar, and bitufted. The axon endpoint also can be a basis for classification.
Chandelier cells axons go to the axon initial segment of pyramidal cells. Basket cells make synapses on pyramidal cell somas (with big or small basket). The others innervates mostly the dendrites [37] [38] [39]. The Martinotti cells which are multipolar interneurons with short branching dendrites, with an axon going to the cortex surface. The Cajal-Retzius cells, which are small neurons, the axon goes parallel with the surface (the Cajal-Retzius cells are rare in adults, if there are any).
By staining immunohystochemical agents the different cells stains differently, by these markers the inhibitory cells can be differentiated as well: by calcium-binding proteins (calbindin, calretinin, parvalbumin), or by neuropeptides (vazointestinal peptide, cholecystokinin, and somatostatin). For communication with other interneurons, they use gap junctions as well.
The electrophysiological properties of the interneurons are very diverse too. In general, they are non-adaptable FS cells, or low threshold firing adaptables, but there are more than 10 other type as well according to their spontaneous, and evoked firing pattern [40].
In the cortex, 85-90% of the cells are excitatory (75% pyramidal, 10% stellate cell), and 10-15%
inhibitory [33].
3.3 Electrophysiology
In this chapter, we will introduce the principles of the bioelectric signals in the brain, and the electrophysiological measuring methods. Biological information is processed and communicated by various physical modalities, but the electrical behavior e.g. action potentials, synaptic and intrinsic membrane currents and underlying mechanisms of cells and tissues are studied by electrophysiology.
It is well known that the electrophysiological signals are based on the ion composition (and its alteration) of the two sides of the cell membrane. Inside the cell the concentration of K+ and negatively charged proteins are higher, outside the Na+, and Cl- concentration is higher. The transport of the ions are made by ion channels, and transporter proteins. The ion channels current state (open-closed), the permeability and the concentration gradients of the different ions can alter the membrane potential. The membrane potential can be calculated by the following equation in a steady state (Hodgkin-Katz-Goldman) [41]:
𝑈 =𝑅𝑇
𝐹 𝑙𝑛𝑃𝐾[𝐾]𝑘+ 𝑃𝑁𝑎[𝑁𝑎]𝑘+ 𝑃𝐶𝑙[𝐶𝑙]𝑏 𝑃𝐾[𝐾]𝑏+ 𝑃𝑁𝑎[𝑁𝑎]𝑏+ 𝑃𝐶𝑙[𝐶𝑙]𝑘
R is the gas constant [8.413 J/ (mol*K)], T is the absolute temperature (310 K), F is the Faraday constant (9.649*104 C/mol), P is the permeability of the fitting ion. Typically the resting membrane potential of a neocortical pyramidal neuron is ~-65mV.
If the membrane potential (by some stimuli or by the effect of some presynaptic cell) moves in the positive direction, it is called depolarization, if it goes more into the negative than the process is called hyperpolarization. Chemical or electrical signaling between cells are made by synapses. If some information (for example action potential) comes from the presynaptic cell then Ca2+ flows into the presynaptic terminal and neurotransmitters are released to the synaptic gap, then the neurotransmitters connects to the receptors of the postsynaptic cell. If it is an excitatory neurotransmitter like glutamate, then the postsynaptic cell depolarizes (Excitatory postsynaptic potential occurs (EPSP)) by the Na+ inflow, if it is an inhibitory neurotransmitter like GABA then it hyperpolarizes (Inhibitory postsynaptic potential occurs (IPSP)) by the Cl- channels opening. If these potentials reach the soma, and the summarized EPSP-s and the IPSP- s go beyond a threshold depolarization level, then action potential (AP) occurs, and thereafter the AP is transmitted towards the axon terminal [19] [42] [43] [44]. The axon initial segment is the place of the AP initiation, because of the vast amount of voltage dependent Na+ channels.
The AP conduction on the axon is described by the Hodgkin Huxley equation:
𝐶𝑚𝑑𝑉𝑚
𝑑𝑡 + 𝐼𝑖𝑜𝑛= 𝐼𝑒𝑥𝑡
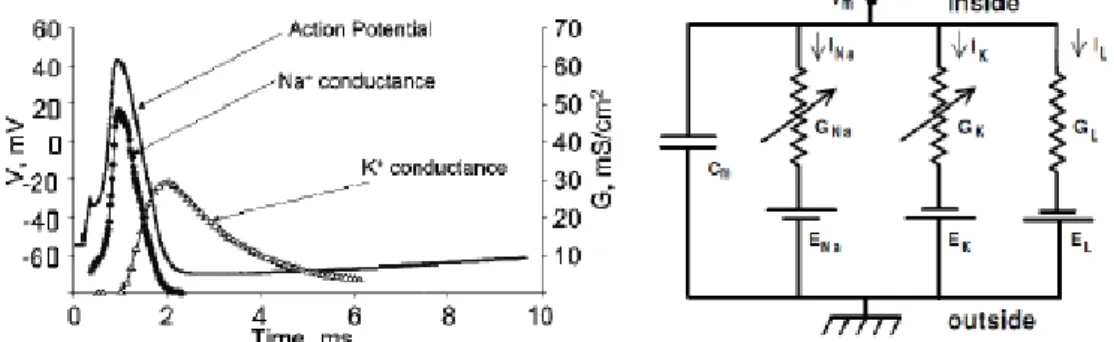
Cm is the membrane capacitance, Vm is the intracellular potential, t is time, Iion is the current going through the membrane, Iext is the external current applied. The ion current which goes through the membrane channels consist of the Na, K, and leaking currents (Figure 2.).
𝐶𝑚𝑑𝑉𝑚
𝑑𝑡 = 𝐼𝑁𝑎+ 𝐼𝐾+ 𝐼𝑙+ 𝐼𝑒𝑥𝑡
The membrane can be modeled by a circuit. In this model there are some conductances which should be the result of open membrane channels. Many ion channel has gates which can block the ion flow through. If these gates are open then by the in- or outflow of the corresponding ion (depending on the concentration gradient) the membrane potential alters closer to the corresponding ions equilibrium potential.
Figure 2. Left) The different channel conductance changes during the action potential. Right) The axon’s (membrane, channels) replacement wiring diagram. G = conductance, I = ioncurrent, E = reverse potential, L = leaking [41] [45].
3.3.1 Electrical properties of the brain
In this chapter the basic properties of bioelectric field potentials and characteristic brain rhythms emerging during different vigilance states in humans will be described. The electric fields generated by neuronal activity can be measured with various electrophysiological methods. Electroencephalography (EEG), which is one of the most widely used techniques to record the potential changes in the brain, will be the main method through which the features of the different neuronal oscillations are demonstrated in this chapter.
Field potentials recorded with the EEG on the scalp represent the summation of the synchronous synaptic activity of a myriad of cortical neurons which have similar spatial orientation. On the level of the single neuron, excitatory postsynaptic activity originating on the dendrites generates an inward current flow into the cell (active sink) at the site of the origin, with a simultaneous outward current on the soma (passive source), latter acting as a return current [46]. The electric field generated by this current dipole can be detected with voltage recording electrodes. In a simplistic view, the field potentials registered with the EEG are the resultant of thousands of spatially and temporally superponed dipoles. If the activity of the neurons is temporally synchronized, then the recorded EEG signal contains high amplitude waves with low frequency (synchronized activity). On the other hand, if the activity is temporally asynchronous, low amplitude waves with high frequency can be detected (desynchronized activity). However, the amplitude and frequency content of the EEG signals depends on various factors: e.g. the age of the patient, the vigilance state, and certain diseases can alter these properties as well.
Based on the frequency of the recorded bioelectric field potentials, we can characterize different brain rhythms or oscillations, including the first-discovered and well-known alpha waves [43].
1. Delta (1-4 Hz): Delta waves belong to the brain rhythms with the lowest frequency.
The activity of neuronal populations is highly synchronized during delta oscillations, therefore high amplitude waves can be recorded on the entire scalp. This particular brain rhythm arises in the thalamus and neocortex during the deepest stage (slow-wave sleep) of the non-rapid eye movement (NREM) sleep in adults. High amount of delta waves recorded in the awake state usually refers to pathological conditions (e.g. brain tumor).
2. Theta (4-8 Hz): Theta waves are faster compared to the delta rhythm. In humans theta rhythm can be recorded with the EEG during stage 2 of the NREM sleep, but it can occur in meditation in the limbic cortical areas as well [43]. There is another type of theta rhythm which was observed in the hippocampus of rodents during exploration of their environment and during rapid eye movement (REM) sleep [46].
3. Alpha (8-13 Hz): The alpha waves were discovered by Hans Berger, the inventor of the EEG. This brain rhythm can be recorded on the occipital sites of the EEG during periods of eyes closed, but they are present during stage 1 of the NREM sleep as well [46].
4. Beta (13-30): Desynchronized activity with higher frequency oscillations (>13), such as beta and gamma rhythms are the characteristic features of the awake state. Beta waves are present in adults on the frontal and central cortical areas and are associated with active thinking, attention, focusing and problem solving [46].
5. Gamma (30-80 Hz): The neuronal mechanism underlying the gamma waves is actively researched, and this phenomenon may have a major role in the conscious perception (e.g. the binding problem, see ref. [32] [46] [47] [48] [49]. These waves are the hallmark of the awake and attentive brain, where desynchronized activity with low amplitude EEG signals can be observed.
3.3.2 Brain electric recording techniques
Measurements of brain electrical properties require a connective medium between the tissue and the recording device. The connective medium is called electrode, which is formed by an electron conductor placed in an electrolyte [50] [51]. In order to measure potential differences, such as brain electric potentials, at least two electrodes are needed. One electrode is always placed over active tissue. Placement of the other electrode can be also over active tissue, in which case the recording is bipolar. When the second electrode is placed over a zero potential area as a reference electrode, the recording is called monopolar. Both arrangements are widely used in research, so several different properties should be carefully taken into account when choosing one of them for a specific experiment [50].
Brain electric potentials can be both recorded from outside and from inside the brain (Figure 3.). EEG recorded from the scalp and ECoG recorded from the brain surface are the two typical recording techniques for measuring potentials outside the brain. Extracellular and intracellular recordings are the two main types of electric potential measurements performed in the brain.
Extracellular recordings are carried out by placement of a recording electrode in the extracellular medium. Recording electrodes can be metal wires, silicon microprobes with metal recording contacts or glass micropipettes filled with electrolyte solution and connected to an Ag/AgCl electrode. Extracellularly, local field potentials (LFP), multiunit (MUA) and single unit activity (SUA) can be measured. SUA is obtained from MUA recordings when the electrode arrangement, such as tetrode configuration, allows for sorting of recorded spikes based on their
waveform characteristics [50]. MUA and SUA are only recorded from neurons in close proximity of the electrode, since action potential waveforms quickly vanish in the highly conductive extracellular medium [50] [52]. Using multichannel extracellular electrodes enables recording activity from larger brain areas, such as several cortical layers or multiple subcortical nuclei simultaneously. Extracellular recordings can be performed both in vitro in prepared brain slices or tissue cultures and in vivo in anesthetized or freely moving subjects. Potentials recorded extracellularly are in the µV range.
Intracellular recordings are performed inside a single cell. For this purpose glass micropipettes are always used. The two main types of intracellular recording electrodes are sharp and patch electrodes. A sharp electrode has a tip less than 1 µm thick which can easily penetrate the cell membrane [53] [54]. Sharp recordings are mostly performed in brain slices and carried out in current clamp mode. Current clamp mode means injecting constant current into the cell and measuring resulting membrane potential changes, which are in the mV range.
Sharp recordings are used to measure whole-cell membrane potential dynamics but are not able to record single channel potential changes [53] [54]. For this purpose the patch recording technique is widely used. Patch electrode tips are thicker than the tips of sharp electrodes; their thickness is about 1 µm [53] [54]. In contrast to the sharp electrode technique, patch electrodes do not penetrate the cell membrane but form a tight seal on a small patch of the membrane.
There are four different types of patch recording [53] [54]. Firstly, cell attached technique means that the patch pipette is tightly attached to the intact cell membrane with negative pressure. In contrast, whole-cell patch recordings are carried out by attaching the recording micropipette to the cell membrane and then ripping the membrane patch inside the micropipette. The other two patch clamp techniques, inside-out and outside-out patch clamp, are performed on membrane patches ripped off the cell. The difference between the two techniques is the side of membrane facing the electrolyte solution in the micropipette. In patch clamp recordings, both current and voltage clamp modes are used. Opposed to current clamp mode, in voltage clamp mode the amount of injected current required for keeping the voltage of the membrane patch at a constant level is measured [53] [54]. Single cell recordings during hippocampal SPA described in this dissertation were made using whole-cell patch clamp in current clamp mode.
Figure 3. Recording techniques (EEG: Electroencephalogram, AEP: Auditory Evoked Potential, EcoG:
Electrocorticogram, EP: Evoked Potential, FP: Field Potential, RP: Resting Potential, PSP: Post-synaptic Potential [51]
3.3.3 In vitro and in vivo human brain tissue preparations for electrical recordings
Electrical recordings from human brain tissue can be either made from different tissue preparations or from the brain of a living patient. In vitro preparations have the advantage of easy manipulation but provide limited access to mechanisms in an intact brain [53]. The easiest way to measure electrical potentials from brain cells is the recording from isolated brain cell cultures. These cultures can be tested in many different conditions by just changing the ingredients of their bathing solution. Heterologous expression systems are cell cultures that express a foreign gene coding for example an ion channel [53]. These systems allow for easy testing of different ion channels in a controlled way. However, in vitro tissue preparations closest to the intact brain are acute brain slices. These slices are kept in a solution called ACSF, which closely resembles the cerebrospinal fluid in the brain. Acute brain slices contain small networks of neurons so that measurements of these slices can reveal valuable information about functions of neuronal networks in the brain [53]. Results of this dissertation were obtained from recordings performed on human acute brain slices.
While all of the previously described extracellular and intracellular recording techniques can easily be used in in vitro tissue preparations, in humans in vivo only extracellular recordings can be performed. However, in vivo recordings have the great advantage of recording from a tissue in its whole physiological environment. Human in vivo recordings are always carried out in subjects undergoing therapeutic brain surgery [55] [56]. Brain surgeries are
preceded by simultaneous video and EEG recordings and also by different brain imaging sessions to localize the area for surgery. During surgery, different recording electrodes are implanted onto the surface of the brain, such as grid and strip electrodes, or into the brain, such as the thumbtack electrode [55] [56](Figure 4.). Recordings by such electrodes are of great value since they are obtained from tissue that is later removed and used in in vitro recordings. This allows for direct comparison of data recorded from different tissue preparations [55] [56].
Figure 4. Subdurally implantable thumbtack- (A and C), and grid electrode (B) [55].
3.3.4 EEG graphoelements
EEG graphoelements are manifestations of brain electrical activity recorded on the scalp. These elements are results of both spontaneous and evoked potential changes in the brain.
Graphoelements help in categorizing and describing EEG recordings, thus providing a powerful tool for both researchers and clinicians. In 1924, Hans Berger described the first EEG graphoelement as the alpha wave, which is measured from occipital areas during wakefulness with eyes closed [57] [58]. As such, the definition of alpha wave is as old as the EEG recording technique itself. Since then, several different EEG graphoelements were introduced.
From a healthy brain, various categories of graphoelements can be recorded [48].
Regular rhythmical oscillations are mostly recorded during slow wave sleep and characterized by low frequency and high amplitude waves. Certain frequency sinusoidal waves are characterized by a single frequency and appear as a sinusoid-like wave on the recording. One of the most easily recognized certain frequency sinusoidal wave is the alpha wave. In many cases, certain frequency waves do not appear and disappear instantly but form waxing and waning oscillation snippets, called spindles. These spindles can be observed in many cases, such as sleep spindles during the deepening phase of slow wave sleep or alpha spindles during eyes closing in wakefulness. The most prevalent EEG graphoelements during a resting wakefulness with open eyes are the irregular arhythmical EEG waves. These consist of various frequencies and reflect the ongoing activity of the wake brain. More complicated graphoelements which consist of many different frequency waves are called complexes. The most well-known complex in the EEG is the so called K-complex which can be observed during stage-2 non-REM sleep in humans [48].
In addition to the graphoelements recorded from a healthy brain, several EEG graphoelements can be indicative of pathological phenomena (Figure 5.). The most prevalent pathological graphoelements are the sharp waves, spikes, spike and wave complexes, polyspikes and polyspike and wave complexes [48]. These elements play a key role in diagnosing and localizing pathologies such as epilepsy.
Figure 5. Examples of the above mentioned EEG graphoelements [48]
3.4 Epilepsy
Epilepsy is one of the earliest recognized neurological disorders. The Babylonians wrote down most of the seizure types, but they thought that it is some kind of evil spirit taking possession of the body.
The first person to claim that epilepsy is a kind of brain disorder was Robert Bentley Todd in 1849: he suggested that the seizures were electrical discharges from the brain.
John Hughlings Jackson was the one who had made this approach popular among the public at large, and with his guidance Victor Horsley was the first who performed craniotomy to cure epilepsy. This was the beginning of the discipline of epilepsy surgery.
The first antiepileptic medication -phenobarbital- was invented in 1912, and till now this is the most widely used medicine in the pharmacological treatment of epilepsy [3] [59] [60]
[61] [62].
In 1935 Wilder Penfield and Herbert Jasper were the first who made awake EEG assisted surgeries in the Montreal Neurological Institute [63]. They stimulated different cortical areas during the surgeries and mapped the evoked responses (like movement of the mouth etc.), or what sensations the patients experienced.
Epilepsy is a frequent neurological disorder; approximately 65 million people suffer from epilepsy worldwide. Epilepsy affects seriously the quality of life of the patients and their families. Epilepsy is not curable, but large scale of antiepileptic drugs are available, which can attenuate or stop the seizures. Epilepsy is frequently accompanied by other psychiatric disease patterns like depression, psychotic symptoms, personality disorder, anxiety, cognitive failures and a higher suicide rate compared to the non-epileptic population [59] [60] [61] [62]. This can be explained either by the disease itself or by the side effects of the different antiepileptic drugs.
There is an increased mortality (2-10 times higher) in the case of epileptic patients. However, this is not the consequence of the brain disorder, but the injuries connected to the seizures [64]
[65].
It is important to be mentioned that an epileptic seizure is not equal to epilepsy. On one hand, a seizure can be a symptom or a momentary signal. It can be synchronous or excessive, but it is always the consequence of some pathologic activity of the brain. On the other hand, epilepsy is a long lasting susceptibility to seizures by the dysfunctional behavior of the brain.
On the neuronal network level epileptic seizures manifest as states of pathological hyperexcitability and hypersynchronous activity of large populations of neurons with concomitant synaptic reorganization of the affected brain region [2] [66].
The epileptogenecity of the different brain regions are diverse. Neocortical neuron populations are especially capable to produce excessive, synchronous firing during physiological conditions which is indispensable in several processes like formation of memory.
Therefore, they have the potential to display extensive hypersynchronous firing under pathological conditions [67].
According to the most well-known hypothesis, epilepsy is linked to an impaired balance of excitation and inhibition in the affected brain region [2]. The role of an altered GABA- mediated inhibition in epileptogenesis and seizure activity has been studied for decades, as well as the sprouting of certain excitatory pathways [8] [68].
There are a lot of syndromes of epilepsy, and the International League Against Epilepsy tried to distinguish the different types. There are two main categories: they are either separable by the seizure focus, or by the etiology of the seizures/epilepsy.
When separating by the focus, there are focal/partial seizures (the epileptogenic zone is well localized), and there are generalized seizures (both of the hemispheres are involved in the emergence). Regarding etiology, there are idiopathic, or symptomatic epilepsies. Symptomatic epilepsies occur along with other disorders of the central nervous system. There is not any other disease before the occurrence of idiopathic epilepsies; they are the result of some kind of heritable susceptibility.
The seizures which are connected to a specific brain region are called partial seizures.
Partial seizures which do not involve disturbance of the consciousness are the simplex partial seizures. Seizures involving the frontal and temporal lobe are the complex seizures (mostly with loss of consciousness). If the motor cortex of both hemispheres are involved, than grand mal seizure occurs (generalized tonic-clonic-seizure). When the area of the epileptic seizure is not definable then it’s a generalized seizure, with symmetrical motoric phenomenons appearing in the EEG signal, the seizure appears on systems which innervates areas on both hemispheres.
There are some generalized seizures during which no or only a few excitation signs appear (petit mal). These seizures cut off extensive areas for a few seconds with cortical spike trains [3] [59] [60] [61] [62]. Focal seizures are most often of temporal lobe origin [3] [69], but frontal, occipital or parietal lobes are also frequently the focus of the seizures.
Despite the large variety of antiepileptic drugs available, a considerable part of the patients are resistant to pharmacological treatment. In case of temporal lobe epilepsy, the percentage of drug resistant patients is extremely high [70] [71].
Nowadays, the surgical treatment emerges in some type of epilepsy. The progression of the surgeries is due to the advances of imaging techniques. With the ever growing influence and quality of the imaging techniques, there is a possibility now to gain much more insight into the localization, extension, and pathological nature of the epileptogenic brain disorder in a variety of lesion types. The vascular malformations diagnostics have improved greatly in recent years, and by the characteristic MR signals of an epileptogenic cavernome gives us the opportunity to surgically treat it. MR is good for recognizing epileptogenic sub-acute, or chronic encephalitis.
Some of the newest application of fMRI is that it can localize the motoric and speaking functions areas, so it gives the opportunity to make a surgery close to these areas.
The development of subdural electrodes allows a much better localization of the seizure onset zone, where the scalp electrodes are not sufficient enough. Using the two techniques together the seizure onset zone can be connected to a specific anatomical structure in the brain.
Since the majority of partial epilepsies are of temporal lobe origin, temporal lobectomy is performed most often, during which the parts of the hippocampus and the temporal lobe are removed [3] [4] [72] [73]. After the surgery the majority of the patients is seizure free, or has seizures less frequently.
3.4.1 Tumor based epilepsies
20-45%of tumor patients have some kind of epileptic event. The age, the place of the lesion, the pathology of the tissue can all influence the seizure’s appearance. The etiology of the tumor caused epilepsies are quite diverse [3] [59] [60] [61] [62] [74] [75].
- Central nervous systems disorders
o Primary brain tumor: glial, neuronal
o Increase in the number of excitatory neurotransmitters, increase of the pH o Morphological alterations in the tissue (abnormal neuronal migration), receptor
binding site alteration
o Brain metastasis (lung-, breast melanoma) - Toxic, metabolic effects
o Medicine side effect o Liver- or renal failure
o Non-central nervous system infection o Electrolyte disorder
- Treatment caused seizures o Chemotherapy o Other agents
[3] [59] [60] [61] [62] [74] [75] [76].
The tumor caused epilepsy treatment needs to be cautious, because the treatment can cause seizure as well, or the different agents can effect each other. Yet, antiepileptics are often used in case of these patients (mostly monotherapy to eliminate interactions). Surgery comes only after unsuccessful medical treatments. First, the primary brain tumor or metastasis is removed and after this the epileptogenic zone. Sometimes the chemotherapy and radiotherapy can offer solution for some of the problems.
3.4.2 Cortical dysgenesis
Cortical dysgenesis derives from a disorder in the brain’s development. These alterations are hard to detect without a high-resolution MRI. 24% of the epilepsies are due to cortical dysgenesis [77] [78] [79].
The cortical cells are developed from the neuroblasts of the ventricular zone near the developing brain’s midline. These cells divide, differentiate and migrate continuously before birth. More than 25% of the primer neurons will die by programmed cell death. Cortical dysgenesis is a disorder that can occur in the whole pregnancy but mostly between the 7-16th week. The pathology depends more on the occurring time of the defect, than its cause. MRI can be used for the detection of the structural difference, but not the etiology of it [77] [79].
A useable classification of the dysgenesis caused epilepsies was based on MRI, which takes into account the histological properties (many times the cause is a subependymal or subcortical heterotopy). Misplaced cell groups can be formed by abnormal migrating endpoint, excessive migrating, or the absence of the programmed cell death before birth.
3.4.3 SPA and interictal activity
For patients with pharmacoresistant focal epilepsy, resective surgery provides a good treatment alternative. The possibility of examining the removed epileptogenic zone revolutionized epilepsy research, as it raised the opportunity of measuring the activity of single neurons in a physiological or quasi-physiological state. In the experiment described in this manuscript, this is important, because our aim was not just to record and analyze LFP changes caused by the cells, we also wanted to know the underlying mechanisms involved in SPA generation. For this purpose, it was examined how all the separate cells are responding to the activity that is recorded using a laminar microelectrode. It has been shown that interictal spikes don’t depend on age, gender, pathology, histology, or used antiepileptics [6].
Distinct from these pathologic interictal events, spontaneously occurring synchronous population activity could be detected in vitro in brain slices obtained from resected human epileptic neocortices, subiculum, and hippocampus [6] [80] [81] [82] [83].The emergence of synchronized events in the neocortex is probably based on the complex interactions between and within the neural network’s inhibitory and excitatory components.
The work of Köhling et al. [6] involved the investigation of human neocortical tissues resected during epilepsy surgery. They investigated the role of glutamatergic and GABAergic synaptic transmission, as well as the role of voltage gated calcium channels in the generation of the spontaneous activity they describe [6]. In their work, the extracellular field potential gradient
was measured in the cortical layers II and V. However, Köhling et.al. measured this activity only in tissue obtained from epilepsy patients. Their characteristics of the spontaneous field potentials were:
- amplitude 20-323 μV (72+-13 μV) - duration 20-200ms (151+-18ms)
- repetition rate 4-108 per minute (43+-4 per minute) - monophasic [6]
While some have argued that SPA is distinct from the pathologic interictal events occurring in epilepsy patients [84], it is still controversial whether SPA is epileptic, or whether it can be found in physiological conditions.
Many studies demonstrated the importance of transmembrane calcium currents and the effects of glutamate, and GABA during spontaneous field potential transients [82] [83] [85]. It has been shown, that an increase in the Mg2+ concentration reduces the recurrence frequency of spontaneous population activity, but application of APV does not, which points to a calcium- antagonistic effect of Mg2+. Calcium currents play a crucial role in the generation of spontaneous activity, and epileptiform activity induced in experimental models and in seizures in epilepsy patients [6]. Blocking the non-NMDA type glutamate receptors, the GABAA receptors, or calcium channels can suppress this type of activity, but blocking the NMDA type or GABAB
receptors does not have any effect on these field potential transients [6] [80] [86] [87].
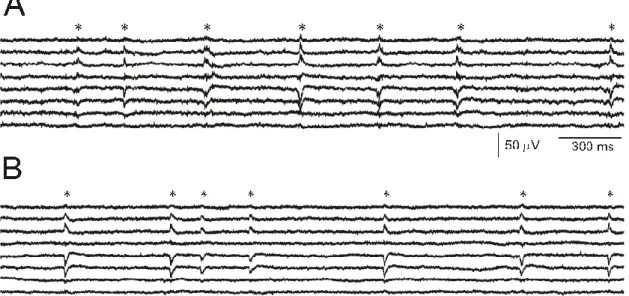
Our group’s preliminary results [83] [85] [88] indicate that an activity similar to interictal spikes (as in Köhling et. al. [6]) is detectable in non-epileptic tissue (derived from deep brain tumor patients, non-epileptic part not infiltrated by the tumor (Figure 6.)).
Using current source density (CSD) analysis the flowing currents between cell compartments can be estimated. Using CSD analysis, it is possible to evaluate which neuronal populations generate the changes in the field potential. During spontaneous interictal discharges in vitro, the current sinks are mostly located in layers II. and III. (positive charges flowing into the cells) even after Mg2+ withdrawal. However, where spontaneous activity did not occur, the Mg2+ withdrawal, or Bicuculline (GABAA receptor antagonist) application caused the sinks to spread over the whole extent of the cortex, especially in layer V. [87].
Figure 6. Example recording of SPA from an epileptic (A), and from a tumor (B) patient. The SPA discharges are marked with an asterisk (*). SPA is mostly generated in the supragranular layers, shows increased cell firing (indicated by an increase in MUA), and the occurrence of High frequency oscillations during the LFP discharge [83] [85] [88].
In the present study, we want to further investigate the origins of this SPA.
Measurements performed with an extracellular laminar multielectrode provide the desired spatial information on how the different cortical layers respond.
However, this approach does not yield extensive information on single cell activity.
Thus, it is difficult to address the question of cellular mechanisms, as it is not feasible to patch each of the cells to obtain cell specific information. Question addressed in the present study are:
How are the cells involved in the generation of SPA? What proportion of cells is active during SPA? Which types of cells are active (neurons, interneurons, glial cells) during SPA? When are they most active (before/during/after the LFP transient)?
Since SPA can occur both in epileptic and in healthy tissues, we decided to investigate the differences in how the healthy and versus the pathological tissue generate a very similar activity. To be able to answer the questions stated above, our research group used 2-photon microscopy. In addition, histological analysis of the tissue is included (cell labeling and staining, followed by light and electron microscopy and 3D reconstruction) to address the question of morphological differences between epileptic and non-epileptic tissue.
3.5 Two-photon microscopy
Neuroscientists have become more and more interested in two-photon microscopy over the last decades because of the numerous advantages. Two-photon microscopy allows high resolution imaging in living tissue compared to confocal microscopy. Another great advantage
of this method is that it makes achievable to image even in great depths (several hundred microns 1 millimeter compared to 30-50 um) by, solving the light scattering problem causing deterioration of optical signals. The improvements of the fluorescent staining and marking techniques in the last few years allowed the functional exploration of neuronal activity from single cell (or subcellular) activity, through cellular networks, to even the measurement of a cortical column (with 3D scanning technology). In this chapter the principles of two photon microscopy will be introduced and its application in the field of neuroimaging will also be discussed.
3.5.1 Theoretical background of two-photon microscopy
In 1931 Maria Göppert-Mayer set the theorem of two-photon absorption [89]. However, because of technological reasons it was experimentally confirmed in the 1960s. With the production of ultra-short pulsed lasers, two-photon microscopes became designable [90].
Fluorescence techniques addressed the problems of neurobiology. Currently, two- photon microscopy became an essential tool for the examination of biological tissues (living or fixed), because the fluorescent objects can be visualized selectively (even with small fluorophore concentration) with good signal-to-noise ratio. Light microscopy is able to track spatially complex dynamics [91] over a great depth, and can resolve single synapses [17] [92].
For light microscopy intact cortical tissue is challenging, but if it is possible neurons should be studied in their natural domain.
The drawback of conventional fluorescent microscopy is that in thick (over 100 μm) samples contrast and resolution are degraded because of the scattering of the tissue [93] [94].
By confocal microscopy some of the scattering effects were overcame by the pinhole detectors, because it rejects fluorescence from off-focus locations [93] [94]. However, scanning a section excites the whole specimen, and thus could damage it. Furthermore, pinhole rejects the scattered signal photons emerging from the focus. In great depth confocal microscopy loses untolerably high amount of signal photons by the scattering [93] [95]. Signal loss can be compensated by increased fluorescence excitation, but it can lead to photobleaching and phototoxicity.
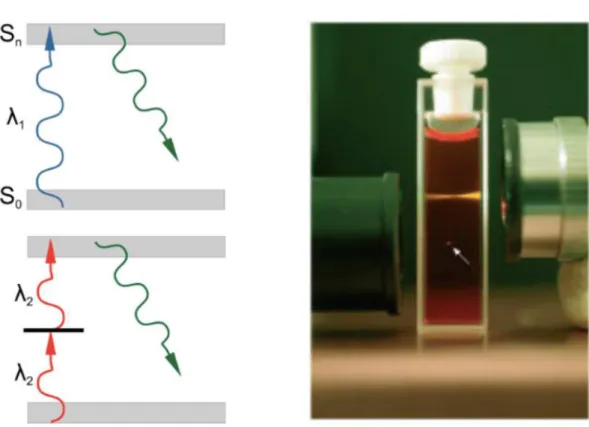
The theory of two-photon excitation is based on the concept when two low-energy photons hits a fluorescent molecule causing an electronic transition to a higher-energy state. Each photon carries the half of the energy necessary to the excitation, and results in the emission of a fluorescent photon (the photon is at a higher energy than either of the excitatory ones (Figure
7.)).
Figure 7. Left: Single and two-photon excitation of a fluorescent molecule (from the excitation it goes up to an excited energy state, and when it descends back to the original a photon is emitted). Right: the focus of the laser beam by confocal or two-photon (marked with white arrow) technology [96].
In a focused laser, the intensity is highest in the focus, and degrades quadratically by the distance. A fluorescent molecules excitation probability has a quadratic dependence on light intensity, resulting in an excitation exclusively only a small diffraction-limited focal volume (Figure 7.). If the objective (used to focus the beam) has a high numerical aperture (NA), most of the fluorescence excitation occurs in a focal volume of ~0.1 mm3 [97]. This way the point spread function’s axial spread is significantly lower than for single-photon excitation.
Photobleaching and photodamage are greatly reduced to the tissue, and no fluorescence is emitted from out of focus locations (automatic optical sectioning), so there is no need for out of focus rejection strategy (like in confocal microscopy). The signal to noise ratio (SNR) is greatly increased by the collection of scattered photons, in contrast to confocal microscopy where they are rejected.
The most commonly used fluorophores have excitation spectra in the 400–500 nm range, whereas the laser used to excite the two-photon fluorescence lies in the ~700–1000 nm (infrared) range. The living tissue scatters light more in the visible wavelengths than in the infrared, thus fluorescent objects in living tissue can be examined in greater depth [98] [99].
Nowadays it ranges from hundreds of micrometers to a millimeter.
For its above mentioned advantages two-photon microscopy became a unique tool for imaging samples in depth (especially in vivo), or in local photochemistry. However, on transparent or very thin slices two-photon microscopy is not as effective as confocal or wide field fluorescence microscopy since the achievable spatial resolution is reduced by the longer wavelengths.
Two-photon functional imaging, and calcium imaging have an extensive background [100], either focusing on its technical aspects [97] [99] [101] [102], on its applications [103]
[104] [105] [106], or on its place in the wider context of the various recent technological developments, which provide tools for the "reverse engineering" of the brain [107].
3.5.2 Hardware of a two photon microscope
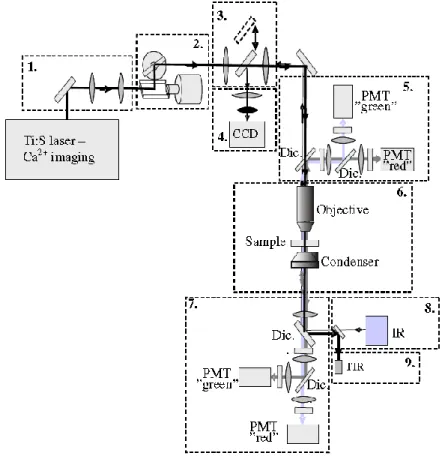
Two-photon microscopy is typically implemented in a simple laser scanning microscope. The setup consist of the following main elements: laser source, scanner, objective and detectors (Figure 8.).
.
Figure 8. Schematic drawing showing the optical design and modular nature of the 2P microscope used. Modules: 1 - Dispersion compensation. 2 – Laser beam positioning. 3 – CCD/2P switcher. 4 – CCD camera. 5 – Upper detectors (PMT – photomultiplier; Dic. - dichroic mirror). 6 – Perfusion chamber and focusing. 7 – Lower detectors. 8 – Infrared lamp (IR). 9 – Transmission infrared detector (TIR). Dic: Dichroic mirror. Source: [108].
The typical differences between two-photon and confocal microscopes are the laser (see below) and the fluorescence detection path. In two-photon microscopy, all useful fluorescence photon collected by the objective. The optimal solution is to project the objective back-aperture onto the photosensitive area of the photodetector [109] [110]. Fluorescence photons can appear to originate from a large effective field of view because the multiple scattering before exiting the tissue [108]. In confocal microscopy, the epifluorescent light passes back through the scan mirrors and through a pinhole before detection [93].
In two-photon microscopy the laser beam is directed into the microscope through an epifluorescent light path. To focus in the specimen, the excitation light is passed through a dichroic mirror to the microscope objective. Two-photon induced fluorescence occurs only at the focal spot. By scanning the fluorescent volume with a galvanometer-driven scanner, the images can be constructed. The emission signal is collected by the same objective and reflected to the detector by the dichroic mirror. A barrier filter is also needed to attenuate the scattered excitation light. To ensure maximal detection efficiency high-sensitivity detectors and electronics are used.
3.5.3 Laser Sources
Opposed to confocal microscopy (continuous wave emitting lasers) two photon microscopy requires pulsed lasers (for precise technical details see the corresponding part of the methods section).
Two-photon excitation efficiency increases with the inverse of the pulse duration, if the average pulse repetition rate, and power are constant. The most commonly employed lasers for two photon microscopy are mode-locked Ti:sapphire lasers. Mostly the excitation light is tunable between 700-1000nm [112].
Pulse rates should balance the onset of saturation and the fluorophore’s excitation efficiency. This criterion is met by the used laser for most common molecules (e.g. Ti:sapphire laser), that is fortunate because mode-locked lasers pulse rate is difficult to change. For stable excitation rate, it is essential that a constant number of pulses arrives on a pixel. More than 100 pulses arrive on a pixel, assuming a pulse rate of 100 MHz and 1 μs dwell time, so the number of pulses per pixel will be stable at the 1% level [112].
The imaging depth is determined by scattering: with increasing depth, a smaller fraction of the incident photons are delivered to the focus. Since rays entering the brain at higher angles have longer paths to reach the focus they are more likely to be scattered, causing a loss of resolution with imaging depth [105]. SNR is also worsened with depth, because extensive scattering and absorption occurs on the lower wavelength emitted light.

![Figure 4. Subdurally implantable thumbtack- (A and C), and grid electrode (B) [55].](https://thumb-eu.123doks.com/thumbv2/9dokorg/1303917.104910/21.892.164.782.268.788/figure-subdurally-implantable-thumbtack-c-grid-electrode-b.webp)