THESES OF DOCTORAL (PhD) DISSERTATION
GÁBOR SZAFNER
MOSONMAGYARÓVÁR 2014
UNIVERSITY OF WEST HUNGARY Faculty of Agricultural and Food Sciences
Mosonmagyaróvár
Institute of Mathematics, Physics and Informatics
Imre Ujhelyi Doctoral School of Animal Sciences Head of Doctoral School:
Dr. Ferenc Szabó DSc Full Professor Program Manager:
Dr. Jenő Szigeti CSc Full Professor Dissertation Adviser:
Dr. Ottó Dóka CSc Full Professor
Determination of thermal effusivity of foods by photopyroelectric method
Written by:
Gábor Szafner
Mosonmagyaróvár 2014
Introduction:
The objective of this study was to show the applicability of the relatively new photopyroelectric (PPE) method in food quality measurement. PPE methods are capable to measure thermal properties of foods in a relatively fast and simple way.
The thermophysical properties (thermal diffusivity, thermal conductivity, volume-specific heat) of foods are increasingly challenging for industrial processing.
A deep insight into physical and chemical parameters is very important in the quality measurement of a new food product. So, new method that cheaper, easier or faster than the other well-known methods is determinative in the investigations. The photopyroelectric method is also one of these categories. Two variants of the PPE method are known: the inverse (IPPE) and the standard (SPPE) configuration. Our samples were measured by a home-made inverse configuration.
The IPPE method is capable to determine the effusivity value of certain foods (e.g., mayonnaise, sour cream, cream, pork meat, processed cheese) versus the fat content. Additionally, it is capable to determine the added carbohydrate content of honey and wine samples.
Furthermore, we measured the effusivity values of some bird species’ eggs and rehydrated hen’s egg powder. The effusivity values of rehydrated egg white samples were measured versus the protein content.
Theoretical background:
In the IPPE method the sensor is a pyroelectric foil made from polyvinylidene fluoride (PVDF) provided on both sides with metal coating. When the pyroelectric foil is heated, the polarized charge is generated on both sides of the foil. Such heating can be accomplished by a modulated laser beam. In the IPPE configuration the modulated laser beam is absorbed at the blackened rear side of the pyroelectric foil which leads to periodic heating. Due to the temperature change the polarised charge density differs at the two surfaces of the foil and leads to the polarised current across the two sides of the foil. This generated polarised charge was detected with a phase sensitive lock-in amplifier, which amplified the signal with the same periodicity as that of the modulation frequency.
The phase sensitive lock-in amplifier amplifies the IPPE signal to optimise the signal to noise ratio at the given modulation frequency.
For a given experimental arrangement this implies that the ratio of the signal Vsample obtained from the sample being studied and the signal Vreference acquired from a reference sample (thermo physical parameters of which are well known) is solely a function of their effusivities, i.e.:
sample water . diszt water . diszt sample
V e V
e = ⋅ ,
where e is the effusivity and V is the amplitude of the signal.
In our measurements, distilled water was used as known sample, whose effusivity value is as follows:
K m
s 1580W
e 2
2 1
water . diszt
⋅
= ⋅
The IPPE signal of the distilled water (Vdiszt.water) was measured directly by our home-made measurement system.
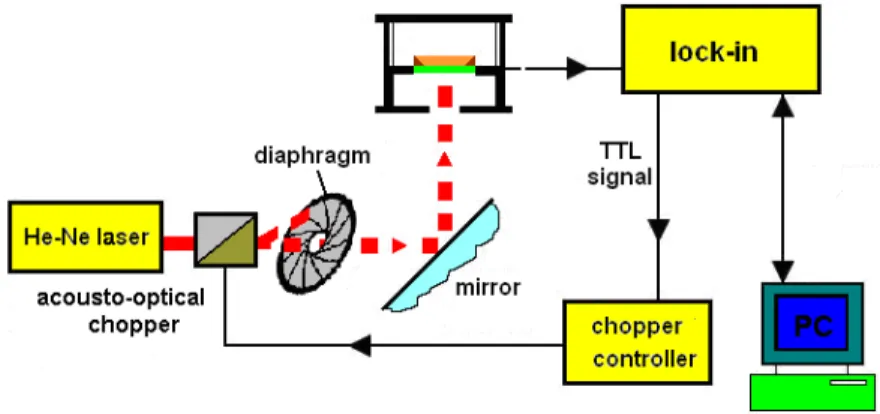
The measurement system contains light source, modulator, sample holder and the detection system of the signal. Fig. 1 shows our home-made IPPE measurement system.
Fig. 1 The IPPE measurement system
The light beam was a Melles Griot 05-LHP-141 Helium-Neon laser with 3.6 mW power. The laser beam was modulated with an acousto- optical modulator, which was driven by the TTL signal of the lock-in amplifier. The modulated laser beam was directed to the blackened rear side of the PVDF foil by means of a plane mirror. The IPPE signal was to the lock-in amplifier interfaced with the computer for data processing.
Results and discussion
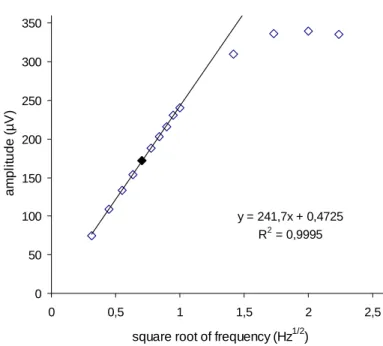
As a first step, the amplitude of the distilled water was measured. The knowledge of the amplitude value of distilled water is necessary to determine the effusivity value of an unknown sample. Fig. 2 shows the amplitude values of distilled water versus the square root of the modulation frequency.
y = 241,7x + 0,4725 R2 = 0,9995
0 50 100 150 200 250 300 350
0 0,5 1 1,5 2 2,5
square root of frequency (Hz1/2)
amplitude (µV)
Fig. 2 IPPE amplitude values of distilled water versus square root of modulation frequency
As shown in Fig. 2, the amplitude values of distilled water versus the square root of the modulation frequency are linear in the range of 0.2- 1 Hz frequency (R2=0.9995). Frequencies higher than 1 Hz the signal
is not linear anymore and the effect of saturation becomes obvious.
Because of the favourable signal-to-noise ratio, the modulation frequency of 0.5 Hz was eventually selected for the remaining measurements (black square in Fig. 2).
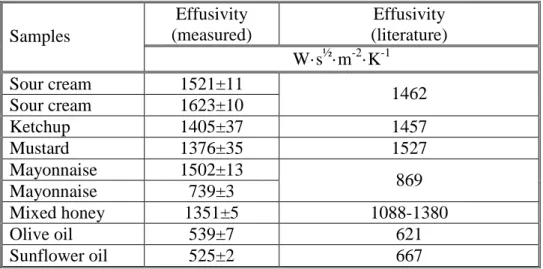
Some food samples with known effusivity values in the literature (e.g., sour cream, ketchup, mustard, mayonnaise, mixed honey, olive oil, sunflower oil) were measured by means of the above-mentioned relative measurement method and the obtained effusivity values were compared to the effusivity values found in the literature (Table 1).
Table 1: Measured effusivity values compared data in the literature Effusivity
(measured)
Effusivity (literature) Samples
W·s½·m-2·K-1
Sour cream 1521±11
Sour cream 1623±10 1462
Ketchup 1405±37 1457
Mustard 1376±35 1527
Mayonnaise 1502±13
Mayonnaise 739±3 869
Mixed honey 1351±5 1088-1380
Olive oil 539±7 621
Sunflower oil 525±2 667
Table 1 shows that differences between the measured effusivity values and those in the scientific literature are not significant. Deviations between values found in the literature and those measured by us are caused by the varying fat contents of mayonnaise and sour cream samples. The differences are acceptable for ketchup, mustard and various oil samples because such commercially available foods very
different in terms of composition. The measured effusivity value of mixed honey is in agreement with literature data.
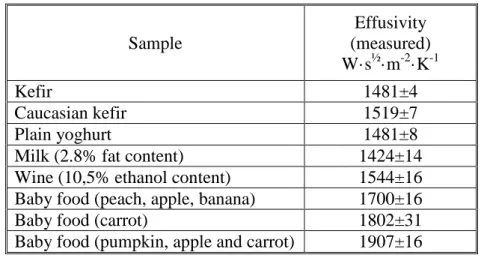
Table 2: Effusivity values of various food samples (no literature data are available)
Sample
Effusivity (measured) W·s½·m-2·K-1
Kefir 1481±4
Caucasian kefir 1519±7
Plain yoghurt 1481±8
Milk (2.8% fat content) 1424±14
Wine (10,5% ethanol content) 1544±16 Baby food (peach, apple, banana) 1700±16
Baby food (carrot) 1802±31
Baby food (pumpkin, apple and carrot) 1907±16
The results in Tables 1 and 2 are expressed as mean value ± standard deviation.
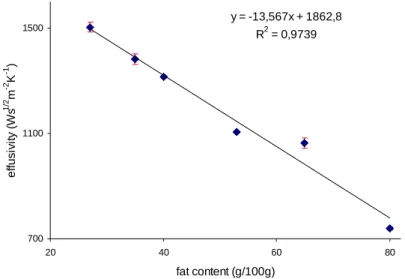
Next, the effusivity values of different foods (cream, sour cream, processed cheese, mayonnaise and pork) were measured versus the fat content. Our results show that if the fat content increases the effusivity value decreases. This decline was linear in all measured samples. The effusivity values (pork and mayonnaise) versus the fat content of the samples are plotted in Fig. 3 and Fig. 4.
y = -13,567x + 1862,8 R2 = 0,9739
700 1100 1500
20 40 60 80
fat content (g/100g) effusivity (Ws1/2 m-2 K-1 )
Fig. 3 Effusivity value of mayonnaise samples versus fat content
y = -6,8315x + 1259,4 R2 = 0,9885
400 600 800 1000 1200 1400
0 20 40 60 80 100
fat content (g/100g) effusivity (Ws1/2 m-2 k1 )
Fig. 4 Effusivity value of pork versus fat content
In the case of honey and wine samples, the added carbohydrates (glucose-fructose syrup, glycerine) decreased the effusivity value in
all measurements. The decrease in effusivity was linear in both measurements (honey R2=0.9985, wine R2=0.9981).
The measured effusivity values of honey samples ranged from 1110 W·s½·m-2·K-1 to 1070 W·s½·m-2·K-1, whereas the effusivity values of wines were between 1400 W·s½·m-2·K-1 and 1560 W·s½·m-
2·K-1.
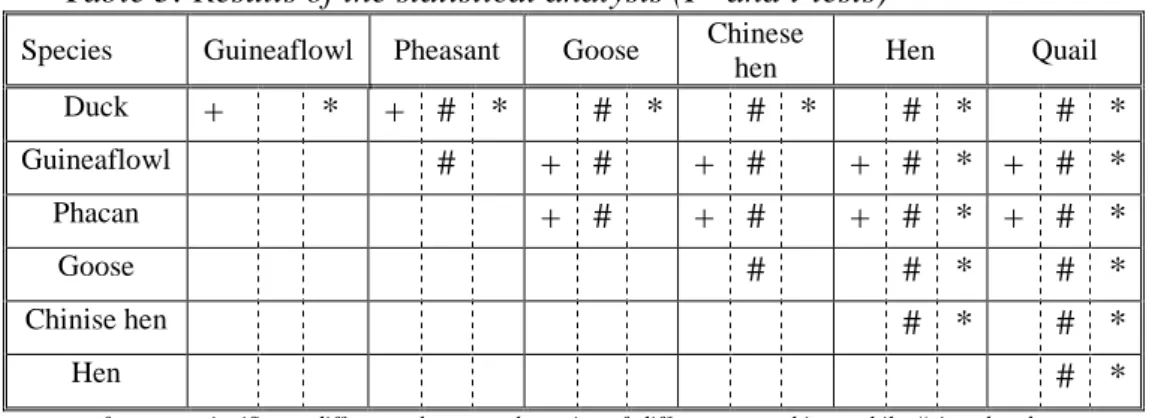
Thereafter, effusivity values of eggs deriving from various bird species were measured. The experimental data were d by applying the F and t-tests at p=0.95 level. The results are presented in Table 3.
Table 3: Results of the statistical analysis (F- and t-tests)
Species Guineaflowl Pheasant Goose Chinese
hen Hen Quail
Duck + * + # * # * # * # * # *
Guineaflowl # + # + # + # * + # *
Phacan + # + # + # * + # *
Goose # # * # *
Chinise hen # * # *
Hen # *
+refers to a significant difference between the pairs of different egg whites, while # is related to a significant difference between the two different egg yolks. Finally, symbol * is reserved for blends prepared from the yolk and white of an egg (p=0.95)
Fresh hen egg is a very important food. Because the constituents of egg (i.e., white and yolk) are sold at different commercial prices; determination of the ratio of egg yolk and egg white in egg liquid is primary. Fig. 5 shows the effusivity values of egg white samples with different egg yolk content.
y = -3,6988x + 1484,4 R2 = 0,973
1000 1100 1200 1300 1400 1500
0 20 40 60 80 100
egg yolk content (g/100g) effusivity (Ws1/2 m-2 K-1 )
Fig. 5 Effusivity value of hen’s egg white versus added egg yolk content
It is obvious that the added egg yolk decreased linearly (R2=0.973) the effusivity value of egg white. The results show that the photopyroelectric method is capable to measure the effusivity value of different egg ingredients. Since effusivity depends on the composition of the sample, thus it is capable of determining the ratio of egg white and egg yolk in egg liquid.
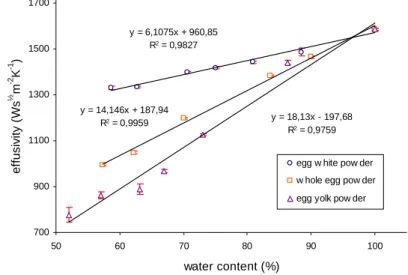
Different egg powders were also measured. The samples were rehydrated with tap water in accordance with the manufacturer’s instructions. The effusivity values of rehydrated egg white, yolk and whole egg were compared to the same fresh egg components (white, yolk, and whole egg). Effusivity values for the rehydrated egg white and egg yolk were similar to the effusivity values of the same fresh egg components. The effusivity value of rehydrated whole egg
samples largely differed from that of fresh whole egg samples. So the effusivity value of rehydrated whole egg powder was measured versus the water content. The measured effusivity values are shown in Fig. 6.
It is seen in Fig. 6 that the measured effusivity values were linear versus the amount of added tap water in the powders (rehydrated egg white powder R2=0.9827, rehydrated egg yolk powder R2=0.9759, rehydrated whole egg powder R2=0.9759).
y = 6,1075x + 960,85 R2 = 0,9827
y = 14,146x + 187,94
R2 = 0,9959 y = 18,13x - 197,68
R2 = 0,9759
700 900 1100 1300 1500 1700
50 60 70 80 90 100
water content (%) effusivity (Ws½ m-2 K-1 )
egg w hite pow der w hole egg pow der egg yolk pow der
Fig. 6Effusivity of rehydrated samples of egg white powder (o), whole egg powder (□) and egg yolk powder (∆) plotted versus the content of
added water.
One percent of added water causes different increases in effusivity values for different rehydrated egg powders. Since the fat content of egg white powder is practically zero (according to the analyses), therefore the changes in the effusivity value are due to the change in the protein content of these samples.
New scientific results of doctoral research
1. It has directly been proved that the measured effusivity values and the effusivity values calculated from other physical properties are the same and satisfy the equation of the effusivity value [e=(κρc)½].
2. The effusivity values of kefir (1481±4.52 W·s½·m-2·K-1), Caucasian kefir (1519±7.92 W·s½·m-2·K-1), yoghurt (1481±9.05 W·s½·m-2·K-1), milk (1424±15.84 W·s½·m-2·K-1), wine (1544±18.11 W·s½·m-2·K-1) and baby foods (1700±18.11 W·s½·m-2·K-1; 1802±35.07 W·s½·m-2·K-1; 1907±18.10 W·s½·m-2·K-1) were determined for the first time (with known protein, fat and carbohydrate contents). The effusivity values of foods with high water content, i.e., milk and wine, approximate the effusivity value of water. The effusivity values of baby foods – because of their structural properties – exceed the effusivity value of water.
3. I evinced that the effusivity value decreases – for mayonnaise, pork, cream, sour cream and processed cheese – if the fat content increases. The decline was found to be linear in all five cases (cream R2=0.987, sour cream R2=0.9872, processed cheese R2=0.9967, mayonnaise R2=0.9739, pork R2=0.9885).
4. It was demonstrated for avian eggs that the effusivity value of egg white exceeds by more than 40% the effusivity value of egg yolk. Therefore, a calibration curve was constructed for the effusivity value versus the ratio of egg yolk and egg white in egg liquid. By means of this curve the IPPE measurement system proved to be capable of determining the ratio of egg yolk to egg white, provided that the bird species is known.
5. I have determined the amount of added optimum water content for egg powders during rehydration. By means of direct measurements, it was demonstrated that the effusivity values of egg white and whole egg powders did not differ significantly from the effusivity value of fresh egg white and whole egg. However, for egg yolk the difference in the effusivity value is 70%. In this latter case, more water needs to be added to egg yolk powder so that its thermal properties will be about the same as those of fresh egg yolk.
6. The quality of wine (full-bodied wine) depends on several things, including also its glycerine content. Therefore, there are regulations for the amounts of glycerine in wines. In the practice sometimes occurs that oenologists improve light- bodied wines with glycerine. The applied IPPE method is capable to determine the effusivity value versus the glycerine content and so this technique is up to determine this kind of food adulteration.
7. Honey is most commonly adulterated by the addition of glucose-fructose syrup. The presence of glucose-fructose syrup affects the effusivity value of honey. I determined with direct measurements the effusivity value of mixed honey samples containing honey and glucose-fructose syrup. The correlation between the ratio of glucose-fructose syrup and the effusivity value is linear. This pyroelectric method is thus capable of detecting the amount of added glucose-fructose syrup in honey.
8. I demonstrated by experiments that the effusivity value decreases with increasing protein content The correlation is linear, and an increase of 1% in protein content results in a decrease of 6.1 W·s½· m-2·K-1 in the effusivity value of rehydrated egg white powder.
List of Publications
Papers published in peer-reviewed scientific journals:
1. Szafner Gábor – Bicanic Dane – Dóka Ottó (2010):
Élelmiszeripari termékek hőeffúzivitásának fotopiroelektromos meghatározása. Acta Agronomica Óváriensis, 52 11-20.
2. Szafner Gábor – Dóka Ottó (2010): Effect of fat content on thermal effusivity of food products. Review of Faculty of Engineering Analecta Technica Szegedinensia, 2-3 237-242.
3. Szafner Gábor – Dóka Ottó (2010): Különböző zsírtartalmú tejtermékek termikus effúzivitásának közvetlen meghatározása. Tejgazdaság, 1-2 31-37.
4. Szafner Gábor – Bicanic Dane – Dóka Ottó (2011): The effect of the fat content on the thermal effusivity of foods: an inverse photopyroelectric study. International Journal of Food Properties, 3 666-674. IF: 0.947
Független hivatkozások száma: 1
5. Szafner Gábor – Dane Bicanic – Kovácsné Gaál Katalin – Dóka Ottó (2012): Direct measurement of thermal effusivity of avian eggs and their constituents: a photopyroelectric study.
Food Technology and Biotechnology, 50 350-354. IF: 1.195
6. Gábor Szafner - Dane Bicanic - Róbert Kulcsár - Ottó Dóka (2013): Direct measurement of thermal effusivity of foods by front configuration of the photopyroelectric method. Journal of Food Physics, 26 4-10.
7. Gábor Szafner - Csaba Németh - Dane Bicanic – Zsuzsanna Lantos - Ottó Dóka: Photopyroelectric assessment of the thermal effusivity of fresh hen egg and of rehydrated egg powders. Journal of Thermal Analysis and Calorimetry. (to be submitted)
Poster presentation at scientific conferences:
1. Szafner Gábor – Dóka Ottó: Élelmiszerek hamisításának fotopiroelektromos vizsgálata. XXXIII. Óvári Tudományos Nap 2010. október 7.
Oral presentations (in English):
1. Szafner Gábor – Dane Bicanic – Dóka Ottó: Thermal effusivity of creams and sour creams determined by inverse photopyroelectric (IPPE) technique: The effect of a varying fat content. XXXIII. Óvári Tudományos Nap 2010. október 7.
2. Szafner Gábor – Dóka Ottó: The effect of fat content on thermal effusivity of food products. ICoSTAF 2010, International Scientific Conference. 3-4th November 2010.
3. Szafner Gábor – Kulcsár Róbert - Dóka Ottó: Influence of fat content to the thermal properties of foods. ICFP, 10th International Conference on Food Physics. 3-5th June 2012.
Oral presentations (in Hungarian):
1. Szafner Gábor – Dóka Ottó: Rehidratált tojásporok és sertéshús hőeffúzivitásának közvetlen meghatározása fotopiroelektromos módszerrel. XXXIV. Óvári Tudományos Nap 2012. október 5.
2. Fülöp Attila – Takaró Lajos – Szafner Gábor: Magyar eredetű, hagyományos karakterű sajtok nagyüzemű gyártástechnológiájának fejlesztése. XXXIV. Óvári Tudományos Nap 2012. október 5.
3. Szafner Gábor – Dóka Ottó: Tojások és hús hőeffúzivitásának közvetlen meghatározása fotopiroelektromos módszerrel.
Hungalimentaria 2013. április 16-17.
Abstracts:
1. Szafner Gábor – Dóka Ottó (2010): Effect of the fat content on the thermal effusivity in food products: an inverse photopyroelectric study. International Conference on Science and Technique in the Agri- Food Business. Abstracts, pp. 68.
2. Szafner Gábor - Kulcsár Róbert - Dóka Ottó (2012): Influence of fat content to the thermal properties of Foods. 10th International Conference of Food Physics. Book of Abstracts.
pp. 19-20
Papers published in conference proceedings:
1. Szafner G. – Bicanic D. – Dóka O.: Thermal effusivity of creams and sour creams determined by inverse photopyroelectric (IPPE) technique: The effect of a varying fat content. XXXIII. Óvári Tudományos Nap, 2010. október 7.
Megjelent CD-n, pp:5. ISBN 978-963-9883-55-0.
2. Szafner G. – Dóka O.: Élelmiszerek hamisításának fotopiroelektromos vizsgálata. XXXIII. Óvári Tudományos Nap, 2010. október 7. Megjelent CD-n, pp:5. ISBN 978-963- 9883-55-0.
3. Szafner G. – Dóka O.: Rehidratált tojásporok és sertéshús hőeffúzivitásának közvetlen meghatározása fotopiroelektromos módszerrel. XXXIV. Óvári Tudományos Nap, 2012. október 5. Megjelent CD-n, pp:5. ISBN 978-963- 9883-93-2.
4. Fülöp A. – Takaró L. – Szafner G.: Magyar eredetű, hagyományos karakterű sajtok nagyüzemi gyártástechnológiájának fejlesztése. XXXIV. Óvári Tudományos Nap, 2012. október 5. Megjelent CD-n, pp:5.
ISBN 978-963-9883-93-2.
5. Szafner G. – Dóka O.: Tojások és hús hőeffúzivitásának közvetlen meghatározása fotopiroelektromos módszerrel.
Hungalimentaria 2013, 2013. április 16-17. pp:57-58. ISBN 978-963-89274-2-2.