Table of Contents
... 1
1. Preface ... 2
2. 1. Society and social development as the keystones of sustainable development ... 2
2.1. 1.1. Content ... 2
2.2. 1.2. Review of the curriculum ... 3
2.3. 1.3. Questions, tasks ... 10
3. 2. Global demographical processes, problems I. ... 11
3.1. 2.1. Content ... 11
3.2. 2.2. Review of the curriculum ... 11
3.3. 2.3. Questions, tasks ... 20
4. 3. Global demographical processes, problems II. ... 20
4.1. 3.1. Content ... 20
4.2. 3.2. Review of the curriculum ... 20
4.3. 3.3. Questions, tasks ... 26
4.4. 4.1. Content ... 27
4.5. 4.2. Review of the curriculum ... 27
4.6. 4.3. Questions, tasks ... 35
4.7. 5.1. Content ... 35
4.8. 5.2. Review of the curriculum ... 35
4.9. 5.3. Questions, tasks ... 41
4.10. 6.1. Content ... 42
4.11. 6.2. Review of the curriculum ... 42
4.12. 6.3. Questions, tasks ... 52
5. 7. Regional characterics of international migration ... 52
5.1. 7.1. Content ... 52
5.2. 7.2. Review of the curriculum ... 52
5.3. 7.3. Questions, tasks ... 59
5.4. 8.1. Content ... 59
5.5. 8.2. Review of the curriculum ... 60
5.6. 8.3. Questions, tasks ... 67
6. 9. Problems of urbanising world II. ... 67
6.1. 9.1. Content ... 67
6.2. 9.2. Review of the curriculum ... 67
6.3. 9.3. Questions, tasks ... 70
7. 10. Human resources, human resource development – the role of human factors in the socio- economic development ... 70
7.1. 10.1. Content ... 70
7.2. 10.2. Review of the curriculum ... 70
7.3. 10.3. Questions, tasks ... 76
8. 11. Socio-spatial disparities in educational attainment of the population ... 76
8.1. 11.1. Content ... 76
8.2. 11.2. Review of the curriculum ... 76
8.3. 11.3. Questions, tasks ... 83
9. 12. The cultural and cultivational polarization of society ... 84
9.1. 12.1. Content ... 84
9.2. 12.2. Review of the curriculum ... 84
9.3. 12.3. Questions, tasks ... 88
10. References ... 88
society as resource and risk I.
lecture
Dr. Antal Tóth
Eszterházy Károly College 2013
This course is realized as a part of the TÁMOP-4.1.2.A/1-11/1-2011-0038 project.
1. Preface
Geographer MSc started in 2011/12 school year in the Department of Geography, in the Eszterházy Károly College. Students can choose between two unique specializations: resource and risk analysis and regional manager.
Students of geographer specialized in resource and risk analysis will be able to explore new resources, the sustainable utilization of them, in addition the recognition and rational moderation of global and local environmental risks.
Besides natural and physical geographical knowledge the integration of topics relating to society and social environment into the educational program is provided, since these are necessary in the world of 21th century that can be characterized with the appreciation of human resources and risks as well.
Course of society as resource and risk is involved into the differentiated professional knowledge of the specialization, in the third semester as lecture, in the fourth as seminar.
Present e-teaching material is made for the lecture of the course, it is the continuation of seminar e-teaching material.
However many literature are available in the topic, according to our knowledge there is not any academic textbook or lecture note, which would present knowledge relating to society with similar thematic and aspect.
I would like to express my thanks for my helpful and supporting colleagues, who contributed to make this lecture note, Dr. György Kajati associate professor, Zsuzsa Piskóti-Kovács and Enikő Kovács junior researchers.
2. 1. Society and social development as the keystones of sustainable development
2.1. 1.1. Content
Definition of the society; explanation of sustainability and sustainable development; role of the society in the process of sustainable development.
2.2. 1.2. Review of the curriculum
The definition of the society
There is no absolute definition about the society.
“A society is a group of people involved with each other through persistent relations, or a large social grouping typically subject to the same political authority and dominant cultural expectations.”[1]
In common sense, the society indicates a large group of people, whose members live together according to a sense of order. The term society came from the Latin word societas, which in turn was derived from the noun socius.
“The social sciences use the term of the society on semi-closed (or semi-opened) groups of people who constitute a social system; where most of the interactions occur between the group members and here take place the social influence and social impact as well. More abstractly, the society is the network of social relations between independent entities. The term society, also often used as communities based on reciprocal relationship system.”[2]
The political perspective of the term often means the community of citizens of a country. The phrasing of Giddens, A. (1997) is that “The society is a group of people who are the subjection of a given political rule;
living in separate areas; and having a different identity compared to the groups of people around them.”
Sociologists place societies into the following categories: hunting and gathering, pastoral, horticultural, agrarian, urban, industrial and post-industrial societies.
Sustainability and sustainable development
The term of “sustainability” or “sustainable development” first appeared in the international literature in the early 1980s. The monograph[3] of Lester R. Brown about the sustainable development of the society got general recognition, which was published in 1981. In this monograph, Brown linked the growth of the population with the utilization of natural resources; by to solve the minimizing of the quality and quantity destruction of the natural environment.
By the decision of the United Nations General Assembly in 1985, the World Commission on Environment and Development (WCED) started to operate with independent professionals by the leading of the Norwegian Prime Minister, Gro Harlem Brundtland. The Commission released its report in 1987, called “Our Common Future”
(also known as the Brutland Report); outlined the possibility of a new era of economic growth, that builds global implementation of sustainable development; preserves natural resources; and which could be the solution to overcome the pervasive poverty in most of the developing countries as well.[4]
The report defined the term of sustainable development: “sustainable development is development that meets the needs of the present without compromising the ability of future generations to meet their own needs”
(Transition to Sustainability in the 21st Century: The Contribution of Science and Technology: a Statement of the World's Scientific Academies; Tokyo, 2000).[5] The aim is to create harmony between man and his environment, together with people-to-people relations (Rakonczai, J. 2003)
According to the phrasing of Herman Daly: “the sustainable development is the achieving of continuous social welfare; increasing without exceeding the limits of ecological carrying capability.”
Sustainable development is an activity designated to reach and maintain social progress – equitable living conditions, social welfare – and economic development; and preserve environmental conditions. So the sustainable development recognizes and answers the purpose to ensure the equal right to the proper standard of living of the successive generations.[6]
The sustainable development is based on three pillars: social, economical and environmental pillars (Figure 1.1). All the three should be taking into account together with their interactions; they have to be weighted up in the course of different development strategies, elaboration of programs; concrete actions and arrangements.[7]
Figure 1.1 The three pillars of sustainable development
Source: http://hu.wikipedia.org/wiki/Fenntarthat%C3%B3_fejl%C5%91d%C3%A9s –12/04/2013 Three main features of sustainability:
- Maintains the current quality of life;
- Ensures the continuous availability of natural resources;
- Avoids lasting environmental damage.
Main principles of sustainable development (Gyulai, I.):[8]
1) Holistic approach 2) Integration 3) Continuance
4) Synchrony of use and preservation of natural 5) Prevention and providence
6) Preservation of adaptation forms 7) Application of local resources
8) Appropriate ecological usage to capability 9) Preservation of stability and diversity 10) The intangible benefit values
11) Usage according to capability and tolerance level 12) Interconnection in circle processes
13) Subsidiarity 14) Coexistence 15) Entropy
The more important and specific, ecological and people-oriented principles of sustainable development:
- to care about natural biomes;
- improve the quality of human life;
- the capacity and diversity have to be preserved;
- exploitation of non-renewable resources should be kept on minimum;
- to live within the Earth‟s carrying capacity;
- change the human attitude and practice where it needs to be;
- human communities must become able to care for their environment;
- national framework needs to be developed to coordinate the environment protection and development - global alliances and agreements need to be concluded for the sake of the health of the environment.[9]
The question arises in context of the sustainable development, to which extent can be replaced the natural capital. The “weak sustainability” is the intersection of the three pillars like sets, where the natural capital can be replaced with economic capital (Figure 1.2).
Figure 1.2 Two approaches of sustainable development
Source: http://mkweb.uni-pannon.hu/tudastar/ff/03-fgazdasag/FGazdasag.xhtml – 12/04/2013
The natural systems “strategies” and human management strategies differ greatly. In nature, the system of negative feedback works, while the man tries to eliminate the negative feedbacks or to delay their effects. Iván Gyulai summed up the following key differences: Table 1.1.
Table 1.1 Differences between natural and social strategies
Strategy Nature Society
Control The control ensures the consistency
of guidance and management
Mainly controlled system on behalf of constant growth
Negative feedback Present and determining Delayed
Organized Heterogeneous Homogeneous
Treatment of effects “strategy” Diversion Reaction
Energy „strategy” Soft Hard
Time horizon Long term Short term
Stability Dynamic balance Great uncertainty
Subsystems Same structure and function Different
Number of elements Many Few
Source: http://weblaboratorium.hu/kornyezetvedelem/korny_termved/3.doc – 12/04/2013
It is important to highlight that the sustainable development is not equal to the protection of environment.
Environmental problems cannot be handled separately from the social and economic problems, if we want to solve them through sustainable manner. We need a new culture in which we can integrate the different needs (Figure 1.3).
Figure 1.3 Closing of the open chains of biosphere and economy Source: Szlávik, J. 2006, 88. p.
What materials and methods should be used to achieve sustainable development? There are no universal materials and methods. Every community should be able to find the most suitable for them. It is also important to learn from the experience of others; and pass on our own ones.[10]
The most important criteria and the essential requirements of the sustainable society:[11]
- social justice, which is the root of the access to opportunities, ensures the equality of opportunities and the common share of common charge;
- strive for the continuous improvement of quality of life;
- sustainable use of natural resources, the implementation of it requires the environmental movement and eco-ethical behaviour of the society;
- the preservation of environmental quality.
“The quality of life includes the health – the state of the complete physical, mental and social well-being – and the related wealth; wholesome environmental conditions; democratic rights, security; education available for anyone, etc. The system approach thinking and leading is essential for the implementation; which is incorporated in institutionally; governmentally form by institutions which are integrating all dimensions of the sustainable development. To achieve the objectives of each sub-field of sustainable development; education and approach-forming communication are needed.”
The objectives of the education of sustainable development: [12]
1) Education of system approach;
2) Learn the alternative thinking;
3) Understand the global questions;
4) Show the values to choose a better quality of life;
5) Development of behavioural norms and forms belong to quality of;
6) Understand the importance of nature, life and biodiversity;
7) The importance of review of the cultural heritage in sustainable development.
Table 1.2 The conditions for the implementation of sustainability
Strategy Action
Cooperation Throughout the cooperation of individuals, groups, smaller and larger organisations.
Consensus Encourages the groups despite of the different interests to leave no stone upturned to reach the common assent.
Action Develops form of activities to help to change the quality of life and lifestyle into a sustainable direction.
Indicators Develop local indicators which will help the community to set off the development into a sustainable direction.
Objectives Set realistic objectives which are acceptable to the majority in order to achieve sustainability.
Education Creates the possibility through education, to make possible everyone to access that kind of information that can help increase the environmental awareness within the community.
Communication Provides the continuous flow of information and straightforward exchange of ideas between the various organizations and interest groups.
Local specialities Help and support those activities which help to strengthen the local image.
Consultancy and guidance
Give advice and show example to help to change the home and work activities into a sustainable direction.
Equality Help any minority or disadvantaged group (ethnic groups, the disabled, etc.) to participate in the local sustainable development program.
have to come out.
Source:
http://www.nyf.hu/others/html/kornyezettud/megujulo/Fenntarthato%20fejlodes/Fenntarthato%20fejlodes.html – 12/04/2013
The relationship between the development and the principles of sustainable development:[13]
„Eco-societies”: The human as tool user and cognitive being displayed in the world; as much a part of nature as any species; therefore the communities which live at the most primitive level called as “eco-societies”. These societies have harmonious relationship with nature; so to speak they are part of the material cycle: acquire all that it offers, then “give it back” and do less damage in it.
Human development: However, a few thousand years ago, the relationship between the nature and humanity had started to change; and the humanity stepped on the path of “development”. As soon as the man becomes civilized, begins to destroy the nature irrevocably, and disrupts the original dynamic balance. The overpopulation, the urbanization and the wasteful consumption have accelerated the transformation of nature.
The pollution has become a global problem during the second half of the 20th century. The developed countries have begun to act against the pollution of water, air and soil; but in the countries of the larger, less-developed areas of the world; which has just stepped on the path of modernization; just as negligent destruction occurs in the nature than in Europe and North America in the 19th century and first half of the 20th century.
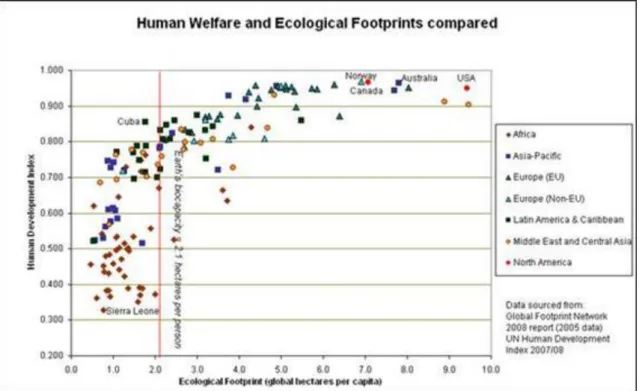
It also should be noted that countries with the largest ecological footprint[14] can be found especially among the members of the then most developed ones. (Figure 1.4 and 1.5)
Figure 1.4 The degree of ecological footprint by countries (2007)
Source: http://mkweb.uni-pannon.hu/tudastar/ff/03-fgazdasag/FGazdasag.xhtml – 12/04/2013
Figure 1.5 HDI (Human Development Index ) and Ecological Footprints compared (2008) Source:
http://upload.wikimedia.org/wikipedia/commons/0/0f/Human_welfare_and_ecological_footprint.jpg – 12/04/2013
Developed and developing countries:[15]
While the problems of environmental pollution; population growth; run-down of natural resources; and problems caused by the need of raw material, energy of the growing consumption needs are increasingly prevalent to be handled in the developed countries; till then the developing countries considered these issues relating to the “rich” countries of the Northern Hemisphere. Despite of the rapid technological development in the developed countries; the resource use and environmental impact have increased significantly, related to them (Figure 1.6 and 1.7).
“The use of natural resources in the developing was relatively low even though the environmental pollution caused by the economic activities. Their primary task was considered as the fight down of the epidemics which bear a relation to poverty; and to compose the similar living conditions which the developed countries have.
Therefore attempts have been made to industrialize their economies by the manner of use the fastest possible and least capital intense technologies, which significantly contributed to the formation of environmental problems.”
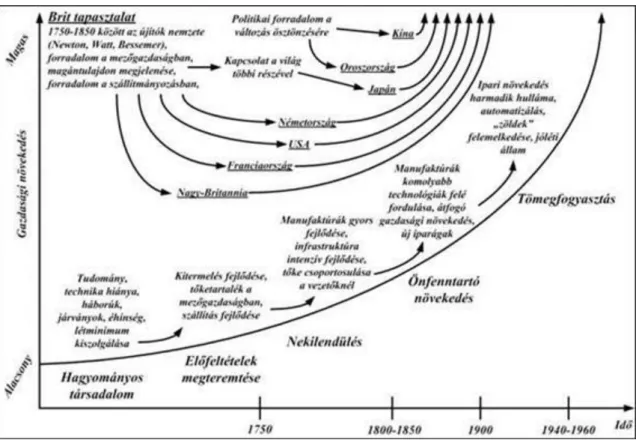
Figure 1.6 Rostow’s stages of economic growth and development
Source: http://mkweb.uni-pannon.hu/tudastar/ff/03-fgazdasag/FGazdasag.xhtml – 12/04/2013
Figure 1.7 The Rostow model by the example of some countries
Source: http://fdmc12geo.blogspot.com/2008/06/rostow-model.html – 12/04/2013
2.3. 1.3. Questions, tasks
1. How would you define term of the society?
2. What do we call sustainable development?
3. How is social development related to sustainability?
4. What are the stages of the implement of sustainable development?
3. 2. Global demographical processes, problems I.
3.1. 2.1. Content
The demographical transition; the growth of the world‟s population; population explosion vs. population decline – territorial differences between the indicators of the natural population growing (birth, death); changings of the territorial distribution of the world population; extremely high populated areas.
3.2. 2.2. Review of the curriculum
The conception of the demographic transition[16]
The first edition of Malthus theory was falsified by the European demographical and economical growth because the increasing in long-term of the standard of living has not boosted only just throttled down the population growth. The advance of the mortality rate was followed by the fertility decline.
A new demographical theory was born in the period between the world wars. That was the theory of the demographical transition.
Blacker‟s got five phase:
1. High stationary phase, when the mortality and fertility rate are evenly high.
2. The early expanding phase, when the mortality is getting better (declining) but the fertility rate is still high, therefore the increase of the population is quickened.
3. The late expanding phase, when the mortality rate is still decreasing but the fertility rate is also turned to decline, so the rate of natural increase is still high.
4. The low stationary phase, when the mortality rate is low with equally low fertility rate, that‟s why the natural increase is drawn near to the zero.
5. The declining phase, when the rate of the fertility is getting lower than the mortality rate.
From that time, the mortality rate decreasing was not a result for the low fertility rate, but economical-, social- and cultural changes related to the economical growth were the main reasons for the declination of the fertility rate.
“Traditional socialfeatures: highmortality, particularlyinfant andchild mortality,agriculturalsociety,domination of theruralcommunities, shortandlow levels ofeducation, lowstandard of living, scarcefacilities, limitedopportunities to women, in addition toachieve something outside the family, thecost of raising childrenis low,theworkis organizedinthe framework of family, the role of thefamilyinfinancialassistance andsecurity- building is very important,the large familiesandhouseholds, religious ideassupport thelargenumber of children, social immobility, folkmethods of contraception.
Modern society:lowmortality, industrialsociety, a high level ofurbanisation, education leads tolongandhighqualification, highliving standards, expandingconsumption opportunities, women's neweconomicrole, thecost of raising childrenis high, thework is organisedin factoriesandoffices, the role of the family is decline in the supportand security-building, core of the family living together, secularism, idealnumber of children issmall, high socialmobility, modernand more effectivemethods of contraception.
Where the socialinequalitiesare smallertherethedemographictransitiontakes placesooner, thefertility rateis reducedsooner because it is notpersistent ina largenumber of childrenin the poorestlayers.Thepoorest layers of the societydo not show awillingnessto limitthe number of children, ifthere is nobenefit for themfrom this.
Carrying out thedemographictransitioneffortsshouldbe madeprimarilyto improvethe situation ofpoorrural- agricultural society.”
there will be a period in which the population is growing quickly (because the mortality has been reduced but the fertility is not yet). That is why Europe's population increased by a multiple of the last two centuries, and it is the reason why the Third World population explosion taking place today.
According tothe theoryof demographictransition:in the first phaseof the transitionthe mortality and fertility rate is also high. Thebalanceis temporarilyupset in the secondphase, the mortality and fertilitydecline inparallelduring the period and there will be a strong population increase.Finally, in thethird and laststagethe fertility andmortality rates get balanced on anew low-level and thepopulationstabilizes.Thesubsequent events, observationshave enrichedthetheory withnew approaches, for example theypointed to the effectof urbanizationandchanges inthe value system, orthe role ofthe spread ofcontraceptiveknowledge. It is importantto notethat changes infertilityare related tomarriagehabits.(Andorka, R. 1987, Szentgáli, T. 1991, Mason, K. O.
1997).
One of the weaknessesof the theorywas that it was not explained by anythingwhy the fertility rate decline should be stopped at thethirdstage. It has been shown thatthedemographictransition theoryfrom itsconclusionsfor the future is non-realistic. It means that thedeveloped countriesfertility isnotstabilized, even at levelsthat-in the long- term runcould provide thepopulationsimplereproduction– besides even inlow-mortality rate. Fertilityfell downsofar, whilethemortalitycontinued to decline.
The second demographic transition [17]
“Before the Second World War decades the fertility generally declined after the war, for about two decades the fertility increased in the developed countries unexpectedly high level. The phenomenon of "baby – corrugation"
(or in English “baby boom") called by the demographers. The reasons was most likely due to the post-World War II decades has experienced extremely rapid economic growth, which effected a sustained real wage growth and low unemployment rate.”
“It is likely that the 1950s and 60s rapid economic growth slowdown were again to the fore the factors that previously, which declined the fertility until the mid- '30s. In addition, in the „60-ies it has become more frequent in female employment after the marriage and what was previously a rarity during the raising up of young children. The employment of women and having children by the difficulty of reconciling such has become a social problem, which was delayed responded by the developed European countries (often only several decades later) and made much harder a lot of young family life and make it difficult to reduce fertility.”
“It may be an additional factor of three prominent effect. One factor is the spread of birth control pills between 1960 and 1975 in the developed world, is somewhat simpler and more effective method of ensuring birth restrictive than the previously used. The spread of tablets, as well as the opportunities they provide, become a self-reinforcing factor. It became a trend becoming more effective birth restriction caused an increase in self- reinforcing factor, becoming fashionable restriction caused an increase in the effective birth of the idea. On the otherhand,whentheintellectualclimate ofpoliticalcurrentswere hostiletotraditionalsocialinstitutionssuch asmarriage andagainstthefamily,and by focusing on individual freedomwas acceleratedthelonghistoricalprocess ofindividualization(Lesthaeghe 1995). Finally,it is possible thatthe couplerelationships andtheresponsibilitiesthat come with themfor lesstaken seriously, and thusthe spread ofcohabitationalsoplayed a majorrole in thedecline offertility. Becauseofthese relationshipshas been shown significantly more labile likemarriages. So, thesecommitted, seriousrelationships compared marriage certainlygive muchlessasense of security, which is compared to thedesire to have children.”
“Transitions since the 1960s demographic changes in the developed countries the demographers generally explained as a new demographic era, so-called second demographic transition occurrence. Due to this transition which is bringing the life expectancy is high rise, the societies in which the increasing aging of the insufficient level of fertility of population stagnation and decrease, and this may be the treated on an intensive level.
Immigration to the developed countries is a typical trend. A large increase in additional features of this new era
could be measured in the number of divorces, a decrease in the number of marriages, extra-marital cohabitation and the proportion of born out of wedlock children rise, increasing number of living only in partnership and especially lone parents - usually lone mothers - proportion of children raised by and finally the increasing number of childlessness.”
Population explosion vs. Population decline
The starting point of global problems is the overpopulation. It means that since the second half of the 20th century has increased in a very fast pace the Earth's population. Supplying the current 7.2 billion people (in 2013) does not reach the Earth‟s carrying capacity. However, further growth of the population can doubt it.
(Figure 2.1 and 2.2).
The population explosion causing unsolved problems in poor countries currently. The rate of population growth is much higher than the economic growth. These countries have become poor because of low GDP is produced should be distributed to more and more people. They cannot produce enough food for themselves, and cannot pay for the world market prices of food.
The world population growth rate declined over the last 10 years. The main reason of this is characterized growth reduction in the developed countries and in a few developing countries. Another reason is the decline of the population in increasing number of European countries (Table 2.1).
Different values of decline and gain amplify differences between the developed and the developing world (Figure 2.3). Poors are getting poorer, the rich are getting richer.
The 80% of the world‟s population lived in developing countries at the millenium.
Figure 2.1. Forecast of the UN Department of Population, Until 2050 – Developed and developing world
Countries Trends Countries Trends
Developed countries Population is around 1.2 billion, could be decline too
Developing countries Population incrase from 4.9 billion to 8.3 billion
Italy‟s, Russia‟s and Hungary‟s population could be declined 25%, Germany‟s, Japan‟s, 14%
Ukraines‟s 40% in 50 years term
88% of the Earth‟s population will be live in the developing part of the world
The population of the EC (376 million in 2004) will be decrease with 10%
the most highest increase is expected in India (16 million per annum), in China, Bangladesh, Indonesia, Etiopia, Iran
the life expectancy will increase to 82 years till 2050 (in 1999 it was 75 years)
the life expectancy will reach 75 years (in 1999. it was 63 years)
the society‟s agening will rise: the rate of the popuation over 60 will rise from 20 % to 33 %
amongthe most
Source: http://www.mozaweb.hu/Lecke-Foldrajz-Foldrajz_10-A_tulnepesedes_es_a_nepessegfogyas-102632 – 26/09/2012
Figure 2.1 Estimated population change in the Earth’s between 2000–2050
Source: http://www.mozaweb.hu/Lecke-Foldrajz-Foldrajz_10-A_tulnepesedes_es_a_nepessegfogyas-102632 – 26/09/2012
Figure 2.2 UN forecast about the world’s population till 2050
Source: http://www.mozaweb.hu/Lecke-Foldrajz-Foldrajz_10-A_tulnepesedes_es_a_nepessegfogyas-102632 – 26/09/2012
Figure 2.3 Difference between the developed and developing countries population
Source: http://www.mozaweb.hu/Lecke-Foldrajz-Foldrajz_10-A_tulnepesedes_es_a_nepessegfogyas-102632 – 26/09/2012
Natural migration
Basic/fundamental determinants - natility;
- fertility;
- mortality;
- reproduction.
The (natural) population growth
The fundamental feature of the population evolution trendsis thenatural population growth, which isthe growthordecrease of the populationby the live birthsandnumberof deaths, respectively. It can be characterizedon the basis oftheirdifference, themigrationwill be ignored.Measured by thenaturalgrowthrate (T), which is the difference live birthrate (S) and mortalityrate (H) (Figure 2.4).
Figure 2.4 The (natural) population growth
source:
http://www.tankonyvtar.hu/hu/tartalom/tamop425/0019_1A_Megelozo_orvostan_es_nepegeszsegtan/ch03s02.h tml – 26/09/2012
If the differece is positive, then it is natural growth/increase, if it is negative then the population is characterized with natural decline.
Areial differences
Figure 2.5 The natural migration rate ont he NUTS 3 level (2011)
Source:
http://epp.eurostat.ec.europa.eu/statistics_explained/index.php/Population_statistics_at_regional_level/hu – 26/09/2012
Territorial distribution changes of the world population
Distribution of the world‟s population from the point of areial view certainly not consistent.
Nowdays,somethirdworldcountries are the most dynamically changingpopulationzones all over the world. Put it intuitively, from 1000 newborns,600in Asia,200in Africa,150in America(75%inLatinAmerica), 45 in Europe,5in Australiaand Oceania will be borned (Figure2.6).
Figure 2.6 Regionally changing of the world’s population
Source: http://www.ngkszki.hu/seged/topo/13.evf.1mod.doc– 26/09/2012
At present, the main problems of uneven population growth can be caught by the following:
· 80% percent of the world‟s population is living in the developing countries.
· 25% percent of the world‟s population is starving or underfeeded.
· More then 30% of the minors ar underfeeded.
· About 25 % of people does not have safe drinking water.
· 80% of the produced income is consumed by 20 % of population.
· The world spend on armaments still significantly much more than especially on family planning The population explosion got serious consequences on several other areas of the life:
· Depletion of the natural resources, unsolved and often intensifying conflicts of land use.
· The significant population growth is not followed by the growth of food producing, thereby the feeding of the people is deteriorating.
· Theovercrowdingand underfednesspromotesthespread ofepidemics.
· Deterioratingliving conditionstrigger strengthening of mass migrationprocesses.
· The occuring urbanisation in the developing countries is generating stress in the settlement network, in the natural and builten environment.
· Extreme forms of social conflicts appeared (civil war, ethnic conflicts and womendrasticsuppression).
Thedenselypopulated regions arealsoappointed as beehivesin the literature, these arethe following nowdays:
There are disadvantages beyond the success in the monoculture of the rice. The population is almost exclusively concentrated in the flat areas where the potential for rice cultivation is optimal. Relations/connections between the mountains and the plains are rare. However, the relations between villages and cities are much stronger, because the village supplies food to the urban settlements in exchange the village gets urban waste and human excrement which make the land productive. Nowadays, beyond the rice production, the industrial-technological development plays an important role in the maintenance of households.
2. SouthAsia (1,000 capita/km2) - includingIndiaandBangladesh, because of their irrigatedagriculturalculture.
Industrial development is on an isolated wayat thepresent, so on a significant part of the region the social- economic structure isvulnerable, natural disasters oftencausequite aserious situationfor the population.Bangladesh's independence (1971) also–indirectly– related to atropicalcyclone. In the disaster of 1970, about 300,000peoplewere died, thelocalpopulationfelt thatthegovernmentofPakistandoes not careenough about this part of the country, so they soonopted for independence.
3.Western Europe(250-300 capita/km2) -geographically dispersedareas. In London and its surroundings,in the Beneluxand in Western parts of Germany(the Ruhr-territory) has been developedthis concentration. These beehives originis clearly due to the18-19. centuryindustrial revolution. Because of theclimaticconditionsandthe cropsyield averagepropertiesdo not allowas muchas theAsianconcentrations, thus otherregionsalso includedan excess offoodthrough trade forsupplyingthepopulation and from 20thcentury the industrialagricultureincreasedextremehighlevelofaverage yields.
4.North America (250-300 capita/km2) - in particularthe Atlanticcoast and theGreat Lakeshasan outstandingpopulation density. Theconcentrationcreateda clearcause ofindustrial developmentand intensiveexploitation oflocalresourcesin the region. Over thedecadessince then,theareahas becomea majorcenterof the world economyand the services playing key role in the employment structure.
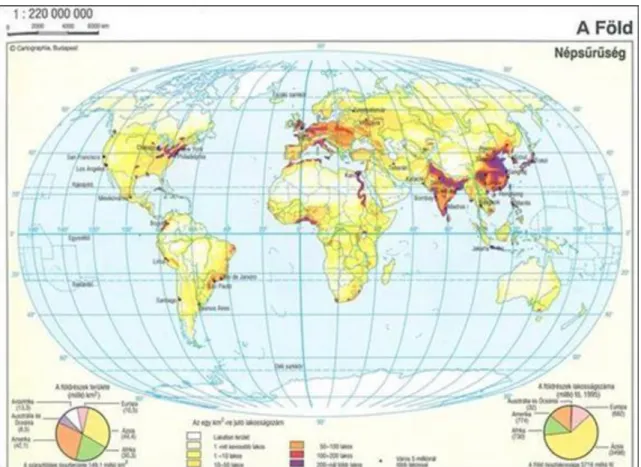
In addition to theselargerbeehivescan be foundon our planet which are evenlessknown, local cores, namelythe island ofJava, in the NileValley, the Mexicanplateau, theDonetsBasinandSilesia. They are developed eitherusingtheancienttechniquesof irrigatedagricultureor modernindustrialdevelopment(Figure 2.7).
Figure 2.7 Population density of the Earth
Source: http://www.tankonyvtar.hu/hu/tartalom/tamop425/0038_foldrajz_PatkosCsaba/ch01s06.html–
26/09/2012
Figure 2.9. World’s population by regions 2011-2100
Source: http://szamvarazs.blogspot.hu/2012_10_01_archive.html – 26/09/2012
3.3. 2.3. Questions, tasks
1. Describe the Earth‟s population changings based on the demographic transition theory, furthermore based on the natural growth indicators (births, deaths)!
2. Where and why could be observed the population explosion and population declination?
3. Characterize the areial distribution of the Earth‟s population by the help of the Figure 2.7., 2.8..!
4. 3. Global demographical processes, problems II.
4.1. 3.1. Content
Theage distribution ofthe world's populationand itsregionaldifferences; the growing, stagnating anddecreasing populationage pyramid(pyramid, bell and urn shaped age pyramid).
4.2. 3.2. Review of the curriculum
On 11thJuly 1987,theworld‟spopulationwas estimated around5billion and theUnited Nations – warningofthe danger ofoverpopulation – designatedthis day as theworldpopulationday. Thecontinuousgrowth ofthe world's population wasincreasingly rapid: demographers estimate reaching the limit of one billion at the beginning of the 19th century, this numberhas doubledduring nearly130years; for reaching thenext billion, only33years and for the following we only had to wait 14 years. According to the estimation of the world-organization, at the very
end of the 20th century the population of our planet has reached a number of 6 billion (Figure 3.1.). On the day 31. October 2011, the UN estimated that the population of Earth has reached the number of 7 billion (2013: 7,2 billion).
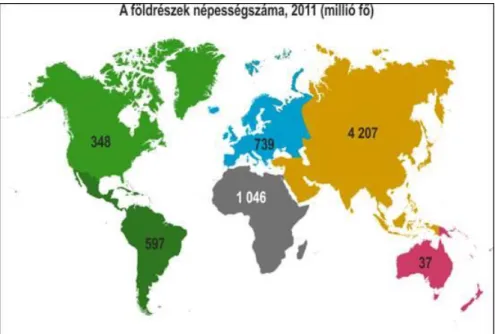
Figure 3.1 The world's population in 2011 per continents Source: http://www.ksh.hu/szamlap/eletunk_nep.html – 25/10/2012
When calculating the known trends with a relatively short history, the UN demographers made three versions (low, mediumandhigh) of their forecast related to the change and development of the world‟s population, till the year 2100. According to one of these we use, which is the most probable medium version, the the world's population till the middle of the 21st century will be just over 9,3 billion. In the second halfof the century,thepopulationgrowthratewill be slower, butby 2100the worldpopulation is still expected to exceedthelimit of10billion.
In most Europeancountries we can expect decrease in the number of populationby 2050. According to the forecasts, countries with bigger area and bigger population, such as Germany, Russia, Ukraine, Bulgaria, Poland, PortugalandRomania, willsufferthegreatestsetback. On the other hand, the number of inhabitants of the United Kingdom, France, Ireland, Norway, Spain, Sweden and Turkey will be significantly higher than in the year 2011. Hungary is among those countries, where the number of population is expected to be moderate, with a number of 700 thousand, over the next four decades.
The UN estimates thatby 2050Europewill behome to719million people, which is 20million less thanin 2011.
Later on,a further cut isexpectedby experts,by 2100 the number of population will fallback to a number of 675million. As a result of all this,theoldcontinent'sshare will be falling back to6.7% till 2100, while Africa's will rise from 15% to 35.3%. (It is remarkable that the number of people living in theblackcontinent,the cradle oflife,will double by 2050: it will be 2.2 billion, which - according to estimations - will be followed by a further increase of 1.4 billion till 2100)[19] (Figure 3.2, Table 3.1.).
Figure 3.2 Changes in the number of population in the developed and less developed regions of the world Source: http://www.ksh.hu/szamlap/eletunk_nep.html – 10/25/2012
Table 3.1 The distribution of the continent 's population (%)
Continent 1950 1980 2011 2050 2100
Africa 9,1 10,8 15,0 23,5 35,3
Asia 55,4 59,2 60,3 55,3 45,4
Europe 21,6 15,7 10,6 7,7 6,7
North-America 6,8 5,7 5,0 4,8 5,2
Middle- and South- America
6,6 8,1 8,6 8,1 6,8
Australia and Oceania
0,5 0,5 0,5 0,6 0,6
Source: http://www.ksh.hu/szamlap/eletunk_nep.html– 10/25/2012
For the estimation of the number of the population of the Earth, several factors shouldbe considered: above the expected trends in thenatural growthandloss -births and deaths–the levelof fertility or theaveragelifeexpectancy at birth should also be taken into account.
It is impossible to trace the the number of the multi-billion crowd exactly. The UnitedStates CensusBureau has published othercalculation results, than the UNexperts. Theagencyestimates thatthe7 billion limit on the planet has not been reached in October 2011, buthalf a year later, on 12. March 2012[20](Figure 3.3).
Figure 3.3 The population of the Eart’s countries in 2013
Source: http://hu.wikipedia.org/wiki/F%C3%A1jl:World_population.PNG – 10/12/2013 The population age structure[21]
When examining thepopulationstructure, we mainlyanalyze the age and the distribution bygender andmarital status.
The most appropriate means of examination for reviewing the age structure is the age pyramid, which shows the structure of population by gender andage, sometimes marital status. Populations with different growthpatterns have an age pyramid with a totally different structuresand shape (Figure 3.4). The ones with a fast growing population have pyramid form – many aretheyoung and the oldrateis relativelylow, whereas the ones with decreasing population have an expressive urn (nomen est omen?) shape, because the rate of middle-aged andelderly is more and more high,andthe rate of young people is getting less. A detailed tree can actually be considered as thedemographicfootprint of the pastcenturies – traces of events that occurred suddenly and significantly affected the future of population (eg. war casualties) are quite clearly visible on them. It is perfectly suitable for a quick review regarding a population‟s substantial demographic features.
Figure 3.4 Types of age pyramids
Source:
http://www.tankonyvtar.hu/en/tartalom/tamop425/0010_2A_09_Farago_Tamas_Bevezetes_a_torteneti_demogr afiaba/ch02.html – 10/25/2012
The horizontal axis showsthemen on the left, women on the right, in%, the vertical axis represents theage groups.
In practice– mainly because of it‟s easier overview – each population is divided into age groups of fiveorten, but sometimes we have to distinguish larger categories (under 15, over 60 years, etc.), in which actually we are trying to map theyoung, adult and old categories for everyday use, with chronological data.
Demographic typescan be distinguished according to the shape of theage pyramid (Figure 3.5.).
· Age pyramid of growing population: the age pyramid is broad-based, rapidlynarrowingupward, it is characterized by the high rate of youngage groups(children aged: 40-50%), and the low rate of elderly (2-4%).It istypical inthe poorestagriculturalcountrieswith highbirth anddeath rates, with lowlife expectancy(eg. India andmany African countries).
· Age pyramid of stagnating population:beehive-shaped, the rate of young people (children aged: 20- 25%)andmiddle-aged is highandalmost the same, the age pyramid onlynarrows at the olderage groups(10-15%).
The number of population and life expectancy is consistentlygrowing(eg. USA, Australia).
· Age pyramid of decreasing population: the age pyramid is narrow-based, upwardsslightly broadening, the rate of young people(children aged: 15-20%) is decreasing, longlife expectancy, the rate of elderlyis increasing (15-20%), it reaches andexceeds the rate ofyoung people. The population is rapidlygetting old,thenumber of population is getting stabilized, then decreases(eg.Switzerland, Denmark, Germany, Italy, Hungary).
Figure 3.5 The basic types of age pyramids
Source: http://www.sulinet.hu/tovabbtan/felveteli/2001/11het/foldrajz/foci11.html – 10/25/2012
Life expectancy at birthin terms of theentireglobal populationis increasing. Women's averagelifetime is generally higher thanmen‟s. Thesex ratio isusuallybalanced(masculinity index for 1000 men is 900-1150women indifferent countries of theworld). Usually the birth of boys is a bit higher (52%) than the birth of girls (48%), therefore at the young age groups there is a surplus of males, but because the mortality of women in older ages is lower than men‟s, therefore there is a surplus of women among the older groups.
Mostly undeveloped societies
The rate of youngage groups is high (45-50% of the population). Includes the poorest, almost only agriculture- dependent countries(eg.Uganda, Kenya, Zambia, Nicaragua). Highbirth ratesand highdeath rates(in all age groups) à only a few reach the older age (2-4% of the whole population). Life expectancy: 45-50 years. Child labor, lack of pension system à elderly people also work, although in many traditionalsocieties the together- livingfamilysupportsthem(eg. China, India).
Developing societies
Highbirth rates,butlower mortality. Children'sage-group:35-45%, elderly age groups: 3-5%. Countries withmodesteconomies belong here (eg.Mauritania, Sudan, Bangladesh, the Philippines, Bolivia, Paraguay), theArabiancountries (eg.Libya, Saudi Arabia,Kuwait).
Developed societies
Almost the samenumber ofyoungandmiddle-agedgroups, but older people are less. The population is growing harmoniously,risein life expectancy, in parallel withthegrayingsociety: rate of young aged people is 20-26%, rate of elderly people is 9-13% (eg. U.S.A, Australia).
Stagnating, and decreasing societies
The number ofyoung age group isdecreasing(16-20%), the rate of older age group is15-20% àapproaches the rate ofyoung people(eg.Denmark, Germany, Switzerland, Sweden). The society is rapidly getting old, its number is continuously getting stabilizedthen getting old.The age pyramid at the youngage group is growing thin.
The above written can be well analyzed through Figure3.6.
Figure 3.6 Types of age pyramids based on social development Source: eduline.hu/segedanyagtalalatok/letolt/3022 –10/25/2012 Life expectancy at birth, male-female ratio
Due to biological reasons, the lifetime of women is longer than men‟s, but there are exceptions: in India and Pakistan the two genders have the same chances at birth, in Bangladesh and Nepal men‟s life expectancy exceeds women‟s à traditionally there is a big social and economic weight on women.
The two genders are usually in balance within one country, but it is characterized by a certain degree offluctuation. On average, the masculinity index for 1000 men is 900-1150 women.
Always more boysare bornthan girlsà in younger age groups they are more, but then the supplement of women is gradually occurring. In countries with more males this change is missing.
The UN has given projectionsupto 2100, using differentassumptions about how the fertility, mortality rates will change during the years. The averages of these estimations suggest thattheglobalpopulationwill be over10billionuntil2085. Until 2100, 22,3% of the people will be 65 years old or older, this rate was only 7,6% in 2010. Most of thepopulationgrowth is expected tocome fromthedeveloping world. The population of Africa will rise from 1 billion (2010) to 3,6 billion till 2100 (Figure3.7).
Figure 3.7 The world 's population by age 1950-2100
Source: http://piackutatas.blog.hu/2011/05/19/a_vilag_2100_ban_valtozik_a_korfa_alakja –10/25/2012
4.3. 3.3. Questions, tasks
1. What are the characteristics of the growing, stagnating and decreasing population age pyramids?
2. What are the rarest and the most densely populated areas in the world? Justify why!
3. According to forecasts, what changesare to be expectedin theincrease of theworld population?
Describethetrends in the developed and developingareas!
4. Global demographic trends, problems III.
4.4. 4.1. Content
Worldwide catering in the 21st century; the abundance and scarsity of food which are both existing in the same period of time (starvation vs. over consumption, hidden or outward starvation); the facts that are standing in the background of the worldwide catering crisis.
4.5. 4.2. Review of the curriculum
Worldwide catering in the 21st century[22]
The existance of regional differences represents one of the most outstanding anomalies of the worldwide catering situation. For approximately 7,2 billion inhabitant of the world, about 10-12% doesn‟t have access to food in a sufficient quality and quantity. The opinions are divided about the existing sources for how many people would they solve their catering problems, according to many researches, the existing economic situation would still be able to feed the current number of people. According to some others, the humanity population has reached its peak, while some other extremist views think that even 90 billion people would be able to live on our planet.
The fact that currently there is a heavy catering crisis in many different regions, shows that we can easily notice that there is significant inequality, which means that part of the world is abunding and the other is suffering from the scarsity.
The ongoing decades of changes that has been happing since 1945 has effected even the basics of agriculture.
The industial economy has became a speciality of the industial states, were the increasingly over production is centered and the unsold rotten stock of products. Argiculture is still preferably the main economic section in most of the countries, from which they try to pump out the capital needed for different developments (industialization, urbanization..etc.). Next to it, they should have satified the lack of food incurred in the different regions. These two factors represent a catastrophic outcoming situation for some states. Double standards is a main character of the agriculture in developing countries, namely there is a modern sector which is producing for the worldwide market, and there is a traditional and conventional agriculture which is assigned to feed the domestic population. The second sector must co-exist within contantly hardening conditions, since the decreasing of birth rate has not yet started in many counties. The existing wolrdwide food stock which is offered for selling, is unreachable by the developing countries, because they simply do not have money to buy.
According to the passimist forcasts of the future, there is almost no hope of changing the conditions of agricultural production. There will be even bigger problems because of the disappearance of agricultural fields, which is spreading rapidly due to the urbanization and industrialization. This problem cycle is threatening mainly the expanding markets in South east and Sound Asia.
The decrease of infield sizes effected by the desertification is also another heavy problem. In some area like Sahel and North China, the size grazing areas have decreased due to overgrazing issues.
Next to the dehydration, the use of unsuitable irrigation tools, or the poor quality of water used in irrigation also causes huge loss. Apart from this, because of the over production of water, the water level has decreased in many areas.
(Patkós Csaba: A globális népesedés humánökológiája –
The quanitity of floral biomassa which is probably decreasing, is effecting the total quantity of fodder plants for livestock breeding by which it is also decreasing. So the charactistic of the bed animals, that the unit of fodder how much useful body size they can produce, will be a very important characteristic. According to the statistics, the index of this characteristic is constantly high in the case of laying hens and milking cows, due to this fact, from ecological and economic point view the foddering of these animals is considered as highly economic. The
Figure 4.1 Food production per capita index (1961-2005)
Forrás: http://hu.wikipedia.org/wiki/F%C3%A1jl:Food_production_per_capita_1961-2005.png – 20/12/2012
Even in the media we can see the relevant contrary: we can see advertisement of different types of drogs to lose weight, in the same time we can see the starving children in Africa. Millions of people are dying because of starvation in under developed countries, while other millions of people are suffering from deseases caused by over weight problems in the developed countries.
According to the last consideration of FAO (The UN Food and Agricultural Organization), there are 800 million people suffering from not enough access to food, which represents 13% of the earth‟ population.
The main element of the catering program represented by the FAO, is that by 2015 the number of starving population should be decreased to the half of it. There has been scientific proof, that our earth is capable of handling the food supply to the global population, so the cause must be searched in the productional and distributional inequality. In other words, the catering situation has changed mainly after the second world war.
Its reasons: the difference in demographic nature among the developed and developing countries; the difference in agricultural productivity; the difference in general level of economic development.
After the IIWW the agricultural productivity and the significant governmental sponsorship to support the efficiency of agricultural labor, the average productivity and the quantity of production have significantly increased until 1970s. After this, the increase became smaller. Nowadays, the product stock show constantly high level of agricultural over production in the developed countries, and huge quantities of unsold stock have accumulated.
However, the modern (tercier) sector is depriving the better quality land and a large part of the labor from the conventional agricultural sector, so it has to produce the food needs for the growing population beside worse conditions and less workforce.
The food crisis in developing countries arising from the growth of the population also, furthermore from division of the food production and food demands. The growing demand for food has two components: the population and their income growth. There is an abundant food supply in the world market, but just the most underdeveloped countries are unable to buy it.
There is food overproduction in the world, due to the modern agriculture technology of the developed countries.[24] Some region is struggling with food overproduction crisis. The population in these countries could be characterized with food over consumption. This could affect a worsening harm of the civilization. The excessive and unhealthy nutrition threats (too much carbohydrate and protein consumption), who lives this comfortable, sedentary lifestyle
For the larger group of peoples on the Earth, the lack of food causes headache worldwide, not like in the case of the inhabitants of developed countries. In fact, the agriculture of the developing countries cannot keep up with the fast growth of population. The deficit of food have come to stay in these regions. The starving is the most cruel consequence of the overpopulation.
The third large group consists of „hidden starving” people. They are underfed due to the quality of food obtained and not because of the quantity.
The new born- and the children mortality ratios are high, plus the expected lifetime is low. It is common to have the children diseased rate of weight loss which is the clear sign of starvation. Their weakened organism is easy to get sick. The lack off hygenie makes the epidemic spread fast (Figure 4.2.).
The overconsumption and hunger, the overproduction of developed regions and developing countries food shortages have all become constant and characterized planet. All these contradictions derive from the global economy, due to operational disruption.
It's not just the thing that population growth rate is different from the food production rate in the world. Rather, the excess of food and lack of supply and effective demand sharply separated on the Earth.
The condition of demand growth are: the growth of population and income increases. The first condition - as seen in the previous chapter - inhere. People living in underdeveloped countries, have an income that is so low that they have no money to buy food. Despite abundant supply, they can not appear as cunsomers in the food market. So most often the root cause of hunger is poverty (Figure 4.3.)
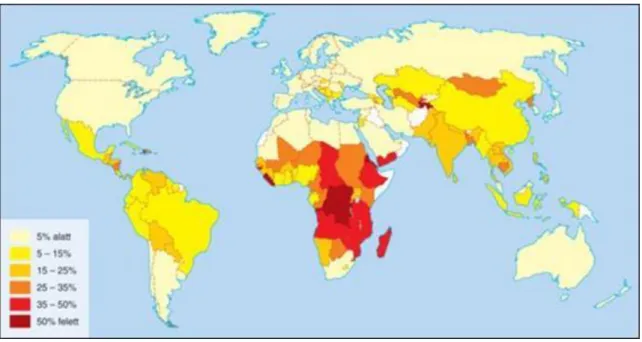
Figure 4.2 The rate of the starving and underfed people of the whole population of the country (2005) (Based on the FAO database)
Source: http://www.mozaweb.hu/Lecke-Foldrajz-Foldrajz_10-Ehezes_es_tulfogyasztas_a_Foldon-102633 – 20/12/2012
Figure 4.3: Worldwide poorness (million capita)
Source: http://www.mozaweb.hu/Lecke-Foldrajz-Foldrajz_10-Ehezes_es_tulfogyasztas_a_Foldon-102633 – 20/12/2012
Quality starving[25]
Daily energy needs of an average adult body moves around 2000-3000 kcal, depending on age, gender, depending on physical activity. If this is allowed to reduce the amount of energy input, the organism can suffer from the declining amount of muscle cells through skeletal muscles lessening until immune system weakening or even in death. In addition to the energy content of the composition of food intake is an important factor, as the human body of certain amino acids and fatty acids can not be produced. So they called the essential ingredients to be introduced onto the food intake, or even a significant proportion of vitamins and trace elements also belong to this group. Hunger can be absolute (if qualitative composition of the dietary intake of energy and not appropriate) and relative (with adequate energy intake unfavorable qualitative composition, deficiency diseases).
The quantity and quality of the food consumption per capita
The amount of food per capita is very low in Africa and South Asia. Between 1988-90 it is estimated that 786 million people were chronically undernourished in the world. (Figure 4.4.) Out of them lived 528 million in Asia and 168 million in Africa. Today, malnutrition decreases in Asia, while in Africa it has increased. The required daily calories varies from country to country, culture to culture, age and gender. For healthy societies average minimum daily calorie serving under the UN 2300 calories / day.[26]
Figure 4.4 Daily calorie ammount per capita
Source: http://www.nyf.hu/others/html/kornyezettud/global/fogyasztas1.htm) – 21/12/2012
To characterize the nutritional quality of the population‟s, the daily food/energy consumption per capita index is used, the kjoule / person / day values were used.
„Based on the FAO kjoule/person/day the countries can be split into three groups: low, adequate and appropriate standards of good food categories. The „nutritional level” concept cannot be narrowed down exclusively to the quantity consumed. It is also very important that the human body energy needs have to be covered from carbohydrates and proteins, respectively, and whether it gets functioning of the human body by essential vitamins. Optimal is considered if the food amount consumed by human stays of 12-15 % protein, and yet nearly half of proteins of animal origin.”[27]
In the case of insufficient food and in countries with lack of good standard of capita/daily values kjoule / person / day and protein consumption are closely linked to the general economic development.
Europe and Hungary nutrition calories are larger than necessary (Figure 4.5).
Figure 4.5 Daily calorie consumption 1961-1990
Figure 4.6 Expanditure of households consumption per capita in Hungary
Source:
http://www.portfolio.hu/gazdasag/igy_elnek_a_szegenyek_es_a_gazdagok_magyarorszagon.192096.html – 21/11/2013
As of on Figure 4.6 can be seen that the wealthy spend more for everything. Proportionately less on alcohol and tobacco (twice), and spend more on culture, entertainment (almost eight times more). Significantly different from the food consumption. Of course, on the one hand it is here that most of the products of the rich eat more, drink, especially when it comes to dairy products, vegetables, fruit. At the same time some awareness of income growth can be seen as fat, sugar, cereal is not what rich man would buy more.
The higher educational level (and higher income) implies that households are spending more on consumption.
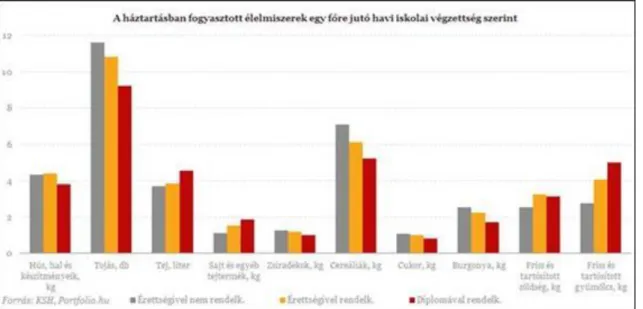
There may be several reasons (eg less "price search " effort, the residence area of higher price levels), but possibly it is also due to the fact that they are likely to buy the same products on a higher price level, with better quality. For example, the average price paid for Bakery products in parallel with the rise of education goes up to 42 percent difference (Figure 4.7 and Table 4.1).
Figure 4.7 Consumed foods in households according to the educational level (Hungary)
Source:
http://www.portfolio.hu/gazdasag/igy_elnek_a_szegenyek_es_a_gazdagok_magyarorszagon.192096.html – 21/11/2013
Table 4.1 Average price (HUF) of the consumed foods by the Hungarian households according to the educational level, 2013
Source:
http://www.portfolio.hu/gazdasag/igy_elnek_a_szegenyek_es_a_gazdagok_magyarorszagon.192096.html – 21/11/2013
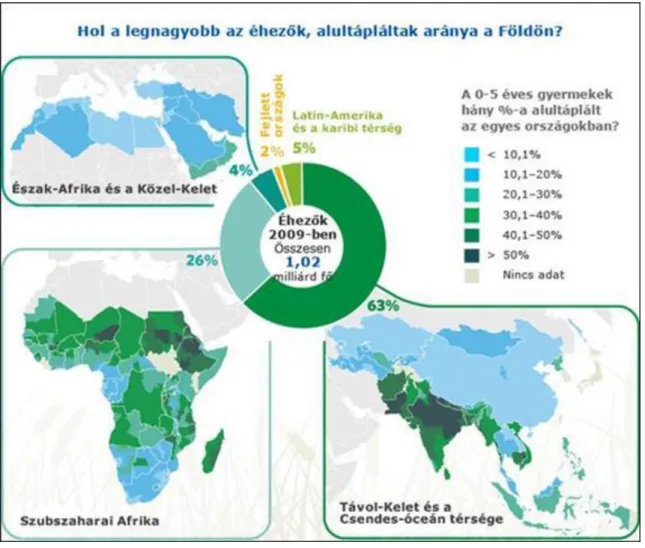
Figure 4.8 Rate of the starving, underfed people int he world
Source: http://www.origo.hu/tudomany/20101013-ehezes-a-vilagban-tenyek-adatok-elelmezesi-vilagnap- 2010.html – 21/12/2012
Figure 4.9. Underfed rate changes of the developing countries between 1969-2009
Source: http://www.origo.hu/tudomany/20101013-ehezes-a-vilagban-tenyek-adatok-elelmezesi-vilagnap- 2010.html – 21/12/2012
4.6. 4.3. Questions, tasks
1. Analyse the world food situation in the 21 century!
2. Based on which viewpoints could you separate the areas of world regarding the food-consumption? Explain the reasons!
3. What factors are behind the world food crisis?
5. Global economic inequalities
4.7. 5.1. Content
Global differences; centrum and periphery; the centrum-periphery relationship in the end of 20th century;
differences between rich and poor countries.
4.8. 5.2. Review of the curriculum
Today world economy is determined not only by the summary and relations of national economies, but the transnational companies as well. Transnational companies‟ developed to be self-contained actors of economy;
many times they have larger property, than the GDP of less or medium size country.
Distribution of 100 largest multinational companies shows that three centrum areas have important role in today world economic competition (Figure 5.1).
Figure 5.1 Distribution of multinational companies in the world
Source: http://www.mozaweb.hu/Lecke-Foldrajz-A_Fold_amelyen_elunk_10- Meg_nem_jott_el_a_fuggetlenseg_napja-106612 – 12/01/2013
The first decade of 21th century brought new challenges for the actors of world economy, although the previous experienced tendencies have seemingly continued, in parallel a transformation process started, which today becomes even faster transforming the regional structure of world economy. In the last decades China has come into even view, consequently it draws the contour of new, dynamic growing spot; so the former three-centred world economy could be considered four-centred, in addition in the future it could become polycentric by coming newer economic actors (BRICS) into view[30] (Figure 5.2 and 5.3).
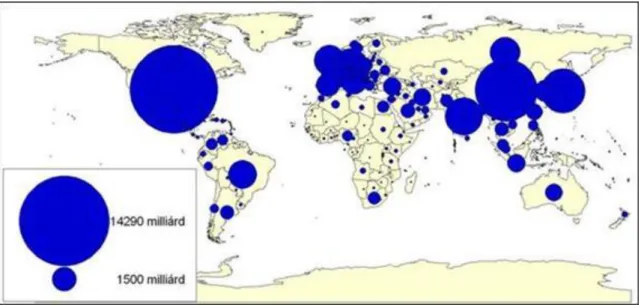
Figure 5.2 GDP (PPP) of countires, USD, 2009 (according to CIA World Factbook) Source: http://tamop412a.ttk.pte.hu/files/foldrajz2/ch04s02.html – 12/01/2013
Figure 5.3 GPD (PPP) per capita of countries, USD, 2009 (According to IMF data) Source: http://tamop412a.ttk.pte.hu/files/foldrajz2/ch04s02.html– 12/01/2013
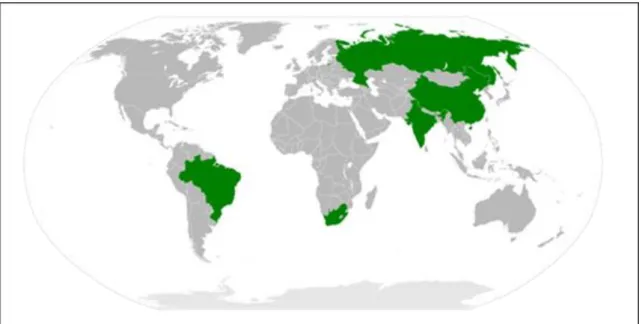
Today globalizing world economy has changed significantly in the last 10 years, new action centrums started to reach the members of Triad forming the world economy polycentric. BRIC countries (Brasilia, Russia, India, China, Republic of South-Africa) emerge from these growing spots, but the intensive growth of other regions (South-East Asia, Western-Turkey) must not be ignored (Figure 5.4).
Figure 5.4: BRICS countries
Source: http://upload.wikimedia.org/wikipedia/commons/b/bb/BRICS.svg– 12/01/2013
Dominant growth could begin in these regions in the future, which could improve the convergence of these areas to the leading economic powers. As long as it is possible to create appropriate economic environment, there will be chance to attract even more multinational and transnational companies into their countries, which could support the intensive join into the world trade. Consequently they could increase their income, which is necessary for modernisation and competitiveness of economy. Countries, regions, which are not able to realise that will be further stacked in the periphery of world economy, their lag and vulnerability will be even larger.
Thereby the picture of world economy could form, where the growing spots, action centrums are surrounded by even undeveloped, strongly dependent areas.[31]
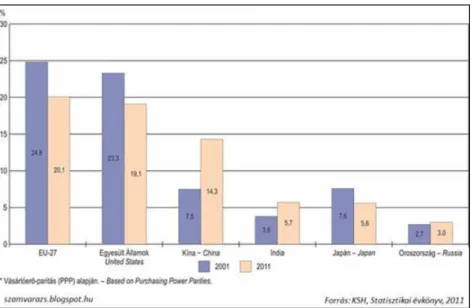
The EU gave the 20 % of world GDP in 2011; it is less with 5 percentage points, than in 10 years earlier – the USA declined in similar volume. China‟s share increased to 14,3 % from 7,5%, while India‟ share increased to 5,7 % from 3,8%. Russia held its 3 % proportion, Japan fell into the level of India (Figure 5.5).
Figure 5.5 Share of main countires and EU from world GDP
Source: http://szamvarazs.blogspot.hu/2012/12/gdp-erdekessegek.html – 12/01/2013 Centrum and periphery
Centrum-periphery relation has spread through the work of Wallerstein. Centrum means a social-economic formation, which is situated in the leading situation in the aspect of development; its development is autonomous, organic development, which derives from the internal structure of the system and the internal motivation of population. Societies of peripheries are lagged from the development level of centrum, they form a lagging formation, their development is based on following the models and samples of centrum countries.[32]
The centrum-periphery relationship in the end of 20th century
The centrum of today world consists of the Triad. It involves North America (USA and Canada), developed economic countries of Europe (EU, EFTA) and Japan. The other countries of the world can be considered as half-periphery and periphery – in a lower or larger scale comparing to the Triad (Figure 5.6).
Figure 5.6 Centrums and half-peripheries of wolrd economy
Source: http://www.mozaweb.hu/Lecke-Foldrajz-Foldrajz_10-
Iranytu_a_vilaggazdasagban_valo_tajekozodashoz-102602 – 12/01/2013