J´anos Hebling
PII: S1386-1425(17)30742-4
DOI: doi:10.1016/j.saa.2017.09.035 Reference: SAA 15469
To appear in:
Received date: 7 June 2017 Revised date: 24 August 2017 Accepted date: 12 September 2017
Please cite this article as: Yin Li, Andras Luk´acs, S´andor Bord´acs, J´anos M´ocz´ar, Mikl´os Nyitrai, J´anos Hebling, The effect of the flexibility of hydrogen bonding network on low- frequency motions of amino acids. Evidence from Terahertz spectroscopy and DFT calculations, (2017), doi: 10.1016/j.saa.2017.09.035
This is a PDF file of an unedited manuscript that has been accepted for publication.
As a service to our customers we are providing this early version of the manuscript.
The manuscript will undergo copyediting, typesetting, and review of the resulting proof before it is published in its final form. Please note that during the production process errors may be discovered which could affect the content, and all legal disclaimers that apply to the journal pertain.
ACCEPTED MANUSCRIPT
The effect of the flexibility of hydrogen bonding network on low-frequency motions of amino acids. Evidence from Terahertz spectroscopy and DFT
calculations
Yin Lia,b, Andras Luk´acsb, S´andor Bord´acsc, J´anos M´ocz´arb, Mikl´os Nyitraib, J´anos Heblinga,d,∗
aMTA-PTE High-Field Terahertz Research Group, Ifj´us´ag Street 6, H-7624 P´ecs, Hungary
bDepartment of Biophysics, University of P´ecs, Szigeti Street 12, H-7624 P´ecs, Hungary
cDepartment of Physics, Budapest University of Technology and Economics, Budafoki Street 8, H-1111 Budapest, Hungary
dDepartment of Experimental Physics, University of P´ecs, Ifj´us´ag Street 6, H-7624 P´ecs, Hungary
Abstract
Low-frequency modes ofl-Asp andl-Asn were studied in the range from 0.1 to 3.0 THz using time-domain Terahertz spectroscopy and density functional theory calculation. The results show that PBE-D2 shows more success than BLYP-D2 in prediction of THz absorption spectra. To compare their low-frequency modes, we adopted ”vibrational character ID strips” proposed by Schmuttenmaer and coworkers [Journal of Physical Chemistry B,117, 10444(2013)]. We found that the most intense THz absorption peaks of two compounds both involve severe distortion of their hydrogen bonding networks. Due to less rigid hydrogen bonding network inl-Asp, the side chain (carboxyl group) ofl-Asp exhibits larger motions than that (carboxamide group) ofl-Asn in low-frequency modes.
Keywords: Terahertz Spectroscopy; Amino Acids; l-Asp;l-Asn; DFT calculation; Hydrogen bonds
1. Introduction
The terahertz (THz) region, which is usually defined as a range from 0.1 THz to 10 THz, has become one of the most attractive spectral range in chemistry and biology recently. The photon energy of THz radiation can give rise to collective atomic motions of compound. These low-frequency vibrational modes are usually associated with motions of hydrogen-bonding networks which play essential roles on stabiliza- tion of biomolecules in solid state [1, 2], folding of proteins[3] and solvation of proteins[4] and some other biomolecules[5, 6, 7, 8] in aqueous phase.
To understand the vibrational features of molecules in THz region, the assistance from theoretical ap- proaches is needed. Density functional theory (DFT) calculation is a commonly used technique. Modeling large molecules like proteins and DNA molecules using DFT is far demanding due to the limitation of com- putational resources. However, modeling small molecules like amino acids is a good start towards revealing complex motions of large molecules. Many studies[9, 10, 11, 12, 13, 12, 14, 15, 16, 17, 18, 19] based on DFT method have been devoted to understand the low-frequency vibrations of small molecules in solid state.
DFT calculations reveal that those collective atomic motions are the mixtures of inter- and intramolecular motions. In other words, there exists coupling between intermolecular and intramolecular motions in THz region.[9, 12] Pioneering work on the decomposition of the low-frequency motions was done by Jepsen and Clark [12]. They defined two types of motions, namely phonon-like motion and intramolecular motion.
According to the definition of phonon-like motion, it is only relevant to the translation of the center of mass of molecule. Other researchers[14, 20, 18] developed this method by considering the contribution from
∗Corresponding author
Email address: E-mail:hebling@fizika.ttk.pte.hu (J´anos Hebling)
ACCEPTED MANUSCRIPT
molecular rotation. Recently, in order to gain deeper insights into collective atomic motions of compound, a more sophisticated but very intuitive analysis method called ”vibrational character ID strips” was proposed by Schmuttenmaer and coworkers [21]. In this method, one strip represents one vibrational mode. It consists of three translational axes, three librational axes and a number of bond angles and dihedral angles, to which one vibrational mode is projected. The amplitude of each vibrational component is indicated by the intensity of its color. It is a very useful tool to study the property of vibrational modes of molecule.
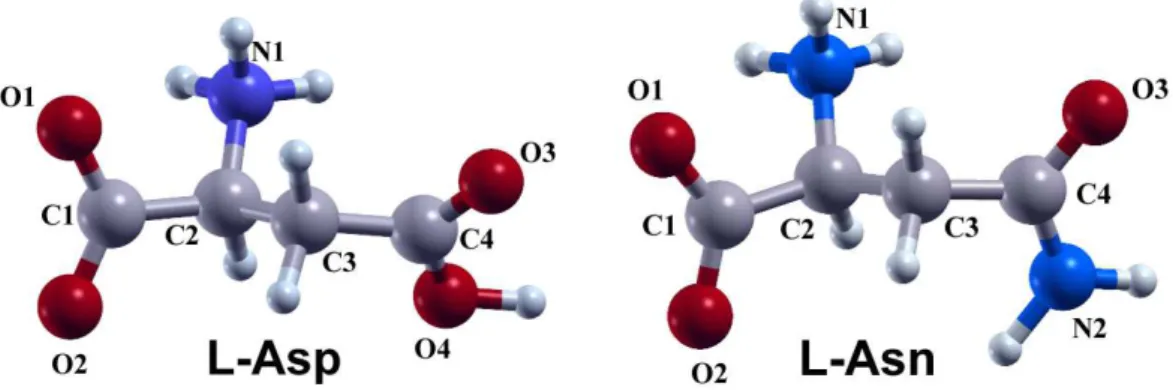
In this work, we employ ”vibrational character ID strips” to study low-frequency modes of l-aspartic acid (l-Asp) andl-asparagine (l-Asn) in their solid states. The reason for choosing these two amino acids is that both the structures and sizes ofl-Asp andl-Asn molecules are very similar to each other (see Figure 1). l-Asp has a carboxyl group (-COOH) in its side chain. Instead, the side chain of a l-Asn molecule is an amide group (-CONH2). Although THz spectra and theoretical calculations of these two compounds have been separately reported [22, 23, 24], they have not yet been compared with each other using a convenient and intuitive approach to study how the different side chain affects the low-frequency vibrational modes.
Here we use time-domain THz spectroscopy to probe the low-frequency motions of l-Asp and l-Asn in the range from 0.1 THz to 3.5 THz. We perform theoretical calculation of structures and vibrational modes based on solid state DFT approach.
Figure 1: Structures ofl-Asp (a) and l-Asn (b) molecules in their zwitterionic forms. Atoms are labeled in symbols with numbers.
2. Experimental
2.1. Chemicals
l-Asp and l-Asn (purity: certified reference material) were both purchased from Sigma–Aldrich Co.
LLC. They were kept in sealed bottles and stored in refrigerator at 4 ◦C. They were measured without any further purification. Before THz absorption measurements, each compound was first ground together with polyethylene (PE) powder (particle size: 40–48 m, Sigma–Aldrich Co. LLC). And then they were pressed into a pellet under a pressure force of 10 tons. The thickness of pellet is about 1 mm.
2.2. Time-Domain THz Spectroscopy
THz absorption spectra of aforementioned amino acids at room temperature were recorded on a TERA K8 Time-Domain THz Spectrometer (TDTS) from Menlo System (Germany). C-Fiber-780 laser source (Menlo, Germany) generates 100-fs pulses at 780 nm with a repetition rate of 100 MHz. The laser beam which just comes out from the laser source is split into two beams. One beam is used to illuminate photo-conductive switch to produce pulsed THz radiation. The generated THz beam propagates through the sample and arrives on a detector which is illuminated by the second laser beam. The created electric signal strength is proportional to the electric field of incoming THz beam. By varying the time delay between these two laser beams, we are allowed to obtain the sample’s THz response profile based on the electric field strength
ACCEPTED MANUSCRIPT
as a function of time. To obtain the THz absorption spectrum in frequency-domain, the measured THz profile is processed using fast Fourier transformation which is a built-in function of the LabVIEW-based THz instrument software. The time for collecting THz signal is about 30 ps , which corresponds to the resolution of 0.035 THz in frequency-domain. Prior to measurements, the sample compartment of our THz system was purged with dry nitrogen gas to reduce humidity inside. The acceptable relative humidity for us is below 5%. THz absorption spectra at 20 K were recorded on TERAFLASH TDTS (Toptica, Germany) equipped with liquid helium cooling system (Oxford, UK). It adopts the same setup as the Menlo K8 TDTS system.
2.3. Geometry Calculation
Geometry optimizations were performed by employing PWscf code which is included in Quantum Espresso Package [25]. PWscf code is based on plane-wave-based density functional theory, which allows us to adopt periodic boundary condition. Ultrasoft pseudopotentials [26] were employed to describe the electron–ionic core interactions. Variable-cell geometry optimization was processed using Broyden-Fletcher- Goldfarb-Shanno method. PBE and BLYP functionals were chosen to describe the exchange and correlation energy of the electrons. Integration of the Brillouin zone was performed by using a 4×3×3 MonkhorstPack k-point sampling. The maximum planewave cutoff energy was set at 60 Ry. And the kinetic energy cutoff for charge density and potential was set to 600 Ry. The cutoff energies andk-point sampling had been first checked for convergence prior to further optimization. The convergence criterion of geometry optimization for total energy and force were set at 1.0d-5 Ry and 5.0d-6 Ry/atom, respectively. A convergence threshold of 1.0d-10 Ry was used in self-consistent calculation. To clarify the role of van der Waals interaction between molecules, geometry optimizations were carried out in the presence and absence of the Grimme’s DFT-D2 correction term [27]. All these calculations were performed on High Performance Computer (SGI UV 1000) located at University of P´ecs, Hungary. It took about 2.5 hours of wall time for a geometry optimization job running on 24 CPU cores. XCrySDen code [28] was employed for visualization of molecular structures.
2.4. Calculation of THz Absorption Spectra and Analysis Method of Vibrational Motion
As van der Waals (vdW) corrections cannot be implemented for density functional perturbation theory (DFPT) phonon calculations in Quantum Espresso package, we decided to use finite displacement method to calculate phonon frequencies. With the assistance of Phonopy code[29], we first built a 2×2×2 supercell for each compound based on their optimized structures at DFT-D2 level. Then each atom in the supercell was individually displaced from its equilibrium position by 0.02 Bohr while positions of other atoms were kept fixed. We run self-consistent field (scf) calculation for every generated supercell structure after above- mentioned displacements on HPC. One scf calculation usually requires 2 hours of wall time on 48 CPU cores. We need to run about 100 scf input files for each compound. Totally, completion of all scf input files for one compound requires 200 hours of wall time on 48 CPU cores. The scf output files, which include the information of force on each atom, were further processed by Phonopy to determine force constants and dynamical matrix. Frequencies and eigenvectors of normal modes were obtained by diagonalizing the dynamical matrix. The information about atomic displacement in each vibrational mode are included in these eigenvectors. By taking use of these information, we decompose those vibrational mode vectors in which we are interested into three components including intermolecular translational, librational and intramolecular vibration. The details can be found in Equation 1-7 in Supplementary Materials. IR intensity calculation was carried out according to the theory proposed by Fern´andez-Torre and coworkers [30]. The details about this calculation are also provided in Equation 8-11 in Supplementary Materials.
3. Results and Discussion
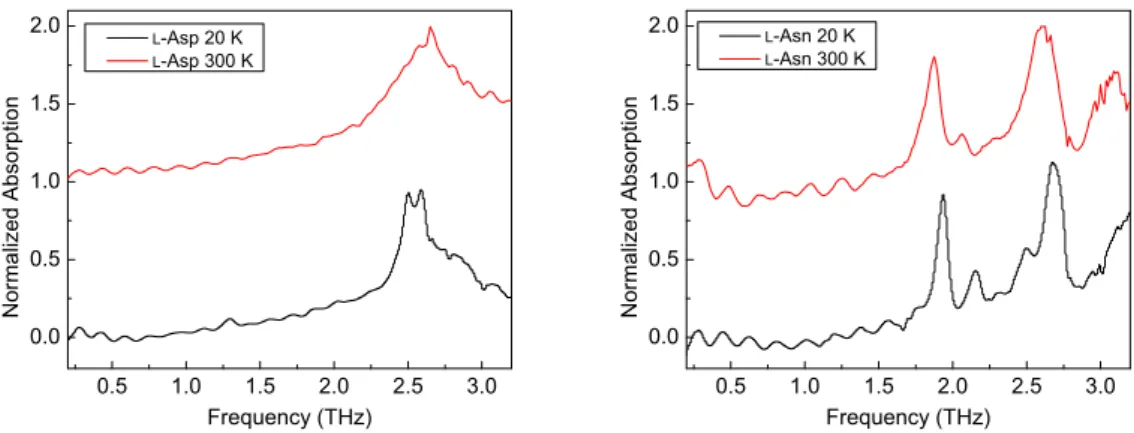
3.1. Experimental THz Absorption Spectra
Experimental THz absorption spectra of l-Asp andl-Asn recorded at 20 K and 300 K are shown in Figure 2. We can obviously observe some spectral oscillations in the frequency region from 0.2 to 1.5 THz
ACCEPTED MANUSCRIPT
in THz spectra ofl-Asn. Those oscillations are due to internal reflection of THz pulse inside sample. They also appear in case ofl-Asp.
An absorption band of l-Asp can be found in the spectral range between 2.3 and 3.0 THz at 20 K.
And two apex appearing at 2.51 and 2.59 THz can be clearly resolvable, which may correspond to two peaks appear at around 2.5 and 2.7 THz recorded at 78 K in Korter’s work [24]. At 300 K, this absorption band unsurprisingly becomes broader, but shows a blue shift instead of a red shift compared with the spectrum recorded at 20 K. It is generally believed that anharmonicity becomes more significant with increasing temperature, leading to a smaller energy spacing between vibrational levels for an oscillator.
Our observation in THz absorption spectra of l-Asp is completely opposite to what we usually expect.
Furthermore, compared with the spectrum of l-Asp recorded at 300 K, we can see a tiny peak appearing 1.3 THz when the experimental temperature is lowered to 20 K. We are under a great risk in making an argument that this peak represents an absorption of l-Asp at 1.29 THz because it can be easily recognized as a spectral oscillation. Moreover, it becomes totally invisible at 300 K, which is in coincidence with the far-infraredl-Asp spectrum recorded by Drichko and coworkers at room temperature [22]. However, at 78 K, a small absorption band appearing around 1.3 THz can also be recognized inl-Asp THz spectrum reported by Korter and coworkers [24]. We speculate that the peak appearing at 1.29 THz in our observation truly reflects the absorption ofl-Asp at this position and it becomes broader and invisible when the temperature is high enough.
In experimental THz spectrum of l-Asn at 20 K, four well-resolved absorption peaks appear at 1.94, 2.16, 2.50 and 2.67 THz, respectively. Our findings are in a very good agreement with Korter’s l-Asn THz spectrum [23]. At 300 K, all the peaks are red-shifted and broadened. We can notice that the two peaks, which appear at 2.50 and 2.67 THz at 20 K, merge into one broader peak. It is also worth noting that the intensity of the peak appearing at 2.16 THz significantly decreases, which makes it like a spectral oscillation.
We suppose that this fact can be a supporting evidence for our argument on the peak appearing 1.29 THz in the spectrum ofl-Asp.
Figure 2: Experimental THz absorption spectra ofl-Asp andl-Asn mixed with PE recorded at 20 K (black) and 300 K (red).
For the purpose of a clear visualization, spectra are offset vertically and intensities are scaled.
3.2. Geometry Optimization
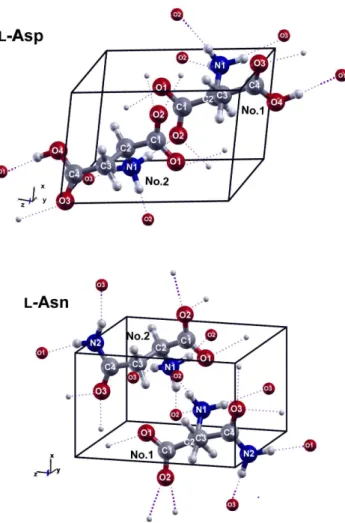
The initial structures of l-Asp and l-Asn used for the geometry optimizations were obtained from X- ray diffraction (XRD) measurements done by Bendeif’s group[31] and Yamada’s group [32], respectively.
Drawings of unit cells of l-Asp and l-Asn crystals are shown in Figure 3. We allowed both the atomic coordinates and cell parameters to be relaxed during the optimization. Recent works revealed that the correction for van der Waals (vdW) forces is essential to achieve a reasonable geometry [33, 34, 23]. For the purpose of comparison, we optimized geometry in the presence and absence of Grimme’s D2 correction.
ACCEPTED MANUSCRIPT
Figure 3: Drawings of unit cells ofl-Asp andl-Asn crystals. Hydrogen bonds are indicated in purple. The atoms which do not belong to the displaying unit cell are drawn as smaller spheres.
.
ACCEPTED MANUSCRIPT
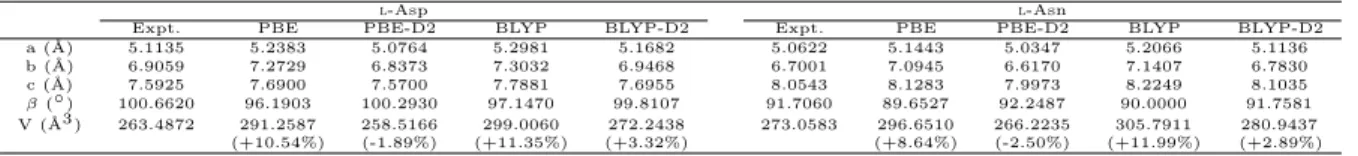
The experimental and theoretically optimized structures of l-Asp andl-Asn are compared in Table 1.
The information regarding bond lengths and bond angles can be found in Table S1 in Supplementary Ma- terials. We found that whenever Grimme’s D2 correction is absent, the lengths of a,b and c increase and the angle ofβ decreases leading to the expansion of the volume of unit cell by approximately 10%. When- ever the Grimme’s D2 correction is implemented, the calculated volumes of unit cells obtained decreased significantly. The optimized geometry with Grimme’s D2 correction are in much better agreements with experimental results. This trend can also be observed in terms of the root-mean-square deviations (RMSDs) in aspects of bond lengths and bond angles. Therefore, we chose the geometries obtained at the DFT-D2 level for the further phonon calculation.
Table 1: Comparison of the experimental and optimized structures ofl-Asp andl-Asn. In every case,α= 90◦andγ= 90◦. The differences between experimentally determined (XRD) and theoretically calculated volume of unit cell are indicated within the parentheses.
l-Asp l-Asn
Expt. PBE PBE-D2 BLYP BLYP-D2 Expt. PBE PBE-D2 BLYP BLYP-D2
a (˚A) 5.1135 5.2383 5.0764 5.2981 5.1682 5.0622 5.1443 5.0347 5.2066 5.1136
b (˚A) 6.9059 7.2729 6.8373 7.3032 6.9468 6.7001 7.0945 6.6170 7.1407 6.7830
c (˚A) 7.5925 7.6900 7.5700 7.7881 7.6955 8.0543 8.1283 7.9973 8.2249 8.1035
β(◦) 100.6620 96.1903 100.2930 97.1470 99.8107 91.7060 89.6527 92.2487 90.0000 91.7581 V (˚A3 ) 263.4872 291.2587 258.5166 299.0060 272.2438 273.0583 296.6510 266.2235 305.7911 280.9437
(+10.54%) (-1.89%) (+11.35%) (+3.32%) (+8.64%) (-2.50%) (+11.99%) (+2.89%)
3.3. Calculated THz Absorption Spectra
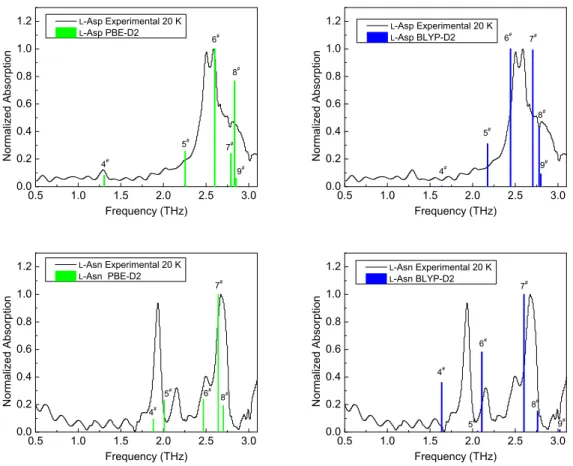
Calculated THz spectra ofl-Asp andl-Asn crystals at PBE-D2 and BLYP-D2 level are shown by columns in Figure 4. Due to the fact that DFT calculations systematically overestimate the frequencies of normal modes [35], all the calculated frequencies were scaled by a factor of 0.90 to achieve a better agreement with experimental THz spectra.
The space groups of both l-Asp and l-Asn crystals are P21 (space group number 4). This kind of crystal has no center of inversion. There exist two irreducible representations, namely A and B, for system possessing this kind of space group. Both A and B representations are both IR and Raman-active. The information concerning the positions and normalized amplitudes of absorption bands in experimental THz spectra and the vibrational modes in calculated THz spectra of l-Asp and l-Asn are collected in Table 2. We can find that all the DFT calculations predict that there exist 5–6 frequency modes (excluding 3 translational modes) in the 0.5–3.1 THz range in both cases ofl-Asp and l-Asn.
As can be seen from Figure 4, the broad absorption band ranging from 2.3 to 3.0 THz in experimental THz spectrum of l-Asp is roughly reproduced by its phonon calculations at both PBE-D2 and BLYP-D2 levels. As theoretical calculations reveals, this absorption band consists of the vibrational mode 5, 6, 7, 8 and 9. The mode 6 is the strongest absorption peak in both PBE-D2 and BLYP-D2 calculations. In BLYP-D2 calculation, the mode 6 and 7 successfully reproduced the shape of two absorption peaks. But the frequency of mode 6 is underestimated and the frequency of mode 8 is overestimated. This leads to a larger gap between these two modes. PBE-D2 calculation shows that the two observed absorption peaks probably arise from its mode 6 and 8. If this is the case, both frequencies are overestimated. The frequencies of mode 5 predicted by PBE-D2 and BLYP-D2 calculations are very close to each other. This vibrational mode is probably related to the small shoulder at 2.25 THz in the experimental spectrum of l-Asp. It should be noted that the PBE-D2 calculation predicts the mode 4 appears at the same position of the suspicious absorption peak as discussed before. And a tiny mode at 1.63 THz can also be recognized in the BLYP-D2 calculation. Although this peak position obtained by BLYP-D2 calculation is higher than the observed peak position, we still believe that both PBE-D2 and BLYP-D2 calculations evidence the presence of a real absorption peak at 1.29 THz.
Comparison between the experimental and calculated THz absorption spectra of l-Asn is even easier.
The mode 4 and 5 obtained by the PBE-D2 calculation can be obviously assigned to the absorption peaks at 1.94 and 2.16 THz, respectively. The frequencies of mode 6, 7 and 8 are also in very good agreements with the positions of observed absorption peaks at 2.50 and 2.67 THz. Compared with the PBE-D2 calculation, the calculated spectrum obtained by BLYP-D2 calculation is relatively poor. The frequencies of both mode
ACCEPTED MANUSCRIPT
4 and 6 are significantly underestimated. But both PBE-D2 and BLYP-D2 calculations show that the mode 7 has the strongest absorption of THz radiation.
In summary, we found that in either case, the PBE-D2 calculation have a distinct advantage over the BLYP-D2 calculation in reproducing the THz absorption peaks. In the following section, we only utilize the information of atomic displacements extracted from the PBE-D2 calculation for analysis.
Figure 4: Experimental THz absorption spectra (black curves) recorded at 20 K and calculated THz absorption spectra (green or blue columns) ofl-Asp andl-Asn. All the calculated spectra are based on the optimized geometry obtained by PBE-D2 (green) or BLYP-D2 (blue) . The phonon frequencies were calculated by finite-displacement method using Phonopy code.
All the calculated frequencies were scaled by a factor of 0.90. The phonon peak intensities were obtained based on the Born effective charge tensor. In order to make a clear comparison, we performed baseline corrections for experimental spectra and normalized the peak intensities in both experimental and calculated spectra to the same scale. The calculated vibrational modes are numbered consecutively. Since the first 3 vibrational modes are pure translational modes, which cannot cause any absorption, the number of vibrational mode shown in the spectra starts with ”No. 4”.
3.4. Representation of Characters of Vibrational Modes
There are two kinds of motions for a molecule which is trapped in the crystalline environment. One kind of motion is called lattice modes or intermolecular vibrations. This is associated with translational and librational motion of the molecule if the molecule is treated as a rigid body. However, this rigid body approximation is never strictly correct since the motions of atoms inside molecule inevitably occur. The term ”intramolecular vibrations” is used to refer to such kind of motions. Although in theory intermolecular vibrations require much less energy than intramolecular vibrations, it has been revealed by many work that the inter- and intramolecular vibrations are never separable [12, 18, 19, 21]. Especially in low-frequency mode region, to a great extent, they couple with each other. Percentage contribution of translational,
ACCEPTED MANUSCRIPT
Table 2: The frequencies (THz) and normalized amplitudes of absorption bands in experimental (20 K) and calculated THz spectra ofl-Asp andl-Asn.
Exp. PBE-D2 BLYP-D2
Compound freq amp freq amp irrep freq amp irrep
l-Asp 1.29 0.12 1.30 0.08 A 1.63 0.01 A
2.25 0.26 A 2.17 0.31 A
2.51 0.98 2.60 1.00 B 2.44 1.00 B
2.79 0.24 B 2.71 0.99 B
2.59 1.00 2.83 0.77 B 2.78 0.43 A
2.85 0.06 A 2.80 0.09 B
l-Asn 1.94 0.94 1.88 0.09 A 1.63 0.36 A
2.16 0.32 2.01 0.23 A 2.06 0.01 A
2.50 0.40 2.46 0.24 B 2.11 0.58 B
2.67 1.00 2.64 1.00 B 2.60 1.00 B
2.70 0.19 A 2.76 0.15 A
3.02 0.02 A
librational and intramolecular motions to the first 50 frequency modes of l-Asp and l-Asn are provided in Figure S1 in Supplementary Materials.
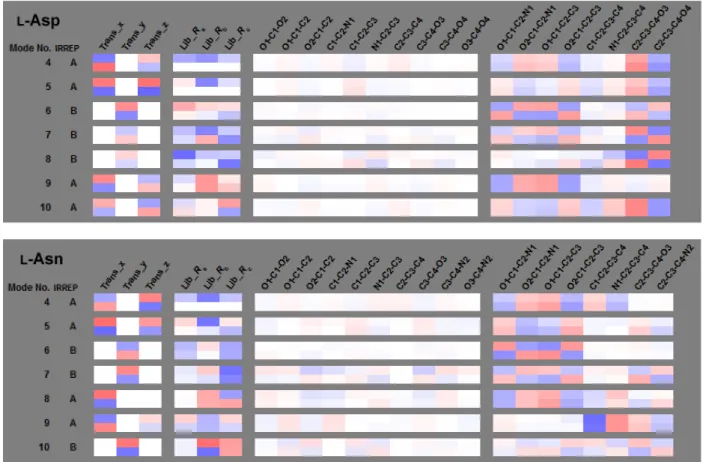
In order to gain an insight to the direction toward which the molecule predominately translates and rotates and which kind of stretching and torsion that are involved in a vibrational mode, Schmuttenmaer and his coworkers [21] proposed an effective and intuitive method to quantify those vibrational characters of molecules. They distributed one vibrational mode into a large number of vibrations including three translational axes, three librational axes and a given number of bond angles and dihedral angles. The distribution information of a vibrational mode are summarized into so-called ”vibrational character ID strips”. As this method is very advantageous and convenient for the comparison between our two amino acid compounds, we decided to adopt it in our work. According to their definition, a character of each mode consists of the following items.
The x, y and z axes of Cartesian coordinates system are assigned as three directions of the movement of mass center. The principal rotation axes and moments of inertia are obtained by diagonalizing the inertia tensors of each molecule. The rotation of molecule is projected into those three principal rotation axes.
Those results are summarized in Table 3. The intramolecular displacement is distributed into all the bond angles and dihedral angles. Here the bond angles and the dihedral angles which involve hydrogen atoms are not considered.
Table 3: Principal moments and rotation axes of inertia for the l-Asp andl-Asn molecules optimized at PBE-D2 level in Cartesian coordinates.
Principal axes Moment of inertia
Molecule axis x y z (amu·˚A)
l-Asp No.1 Ra -0.46 0.21 0.86 161.91
Rb 0.88 0.29 0.39 567.84
Rc 0.16 -0.93 0.32 601.29
l-Asp No.2 Ra -0.46 -0.21 0.86 161.91
Rb -0.88 0.29 -0.39 567.84
Rc 0.16 0.93 0.32 601.29
l-Asn No.1 Ra -0.35 0.18 0.92 166.17
Rb 0.90 0.34 0.27 546.63
Rc 0.26 -0.92 0.28 616.38
l-Asn No.2 Ra -0.35 -0.18 0.92 166.17
Rb -0.90 0.34 -0.27 546.63
Rc 0.26 0.92 0.28 616.38
Since the change of each motion can be either positive or negative, following Schmuttenmaer’s method we use red color and blue color to represent the positive and negative change, respectively. In our work, we adopt a different strategy to calculate the amplitude of each particular motion. When we calculate the amplitude of three translational motions, we first normalize x, y and z components of the translational displacement vector of mass center by using the modulus of this vector instead of the largest one among them. Then, we obtain the final amplitude of three translational motions through multiplying those normalized x, y and z components by the contribution percentage of the translational motion. The calculation of the amplitude of librational parts is simpler than Schmuttenmaer’s method in which Euler angles is employed. In the condition that the contribution from translation is excluded by subtracting the translational displacement from the displacement of each atom, we first calculate the vector of rotational axis of molecule. Then we directly calculate the inner products between the vector of rotational axis and the vectors of three principal axes obtained from the inertia tensor of molecule. Then those inner products are normalized by the square of the
ACCEPTED MANUSCRIPT
total sum of squares of these three inner products. Finally, the amplitude of librational motions are obtained through multiplying these normalized three inner products by the contribution percentage of the librational motion. Similar strategy is applied for the calculation of the amplitude of intramolecular motions. Excluding the contribution from both translational and librational motion, we calculate the displacement angles by comparing the angles of molecule when it is in equilibrium and after it is distorted under the influence of intramolecular displacement vectors of its all atoms. Then these displacement angles are normalized by the square of the total sum of squares of all these displacement angles. The amplitude of those intramolecular motions are obtained as the product of these normalized displacement angles by the contribution percentage of the intramolecular motion. After this strategy is applied, the sum of squares of each component of one row is equal to 1. In this way, we are allowed to intuitively observe the weight of a particular motion in a mode by the color intensity of its corresponding strip.
3.5. Comparison Betweenl-Asp and l-Asn Low-Frequency Vibrations
Figure 5: ”Vibrational character ID strips” of the 10 lowest-frequency vibrations inl-Asp (top) andl-Asn (bottom) crystal.
In one vibrational mode, there are two rows representing two molecules in one unit cell. The color red and blue in a strip indicate positive and negative changes, respectively. And the intensity of color represents the amount of translation, libration or distortion. The 3 vibrational modes are pure translational modes. They are neglected in this figure. According to the space groups ofl-Asp andl-Asn crystals, both A and B representations are IR and Raman-active. These analysis are based on the phonon calculation of the optimized geometry obtained at PBE-D2 level.
Vibrational character ID strips of the 10 lowest-frequency vibrations inl-Asp andl-Asn crystal are shown in Figure 5. Drawings of intramolecular motion in each mode are provided in Figure S2-S13 Supplementary Materials.
According to theoretical calculations, the strongest vibrational intensity of l-Asp originates from the mode 6. This mode is associated with the main absorption peak of l-Asp crystal. Therefore, it deserves a
ACCEPTED MANUSCRIPT
special attention. Its translational strips show that the two l-Asp molecules in a unit cell both translate along the y-axis, but in opposite directions. Librational strips reveal that No.1 and No.2 l-Asp molecules mainly rotate around the lightest principal axes Ra and the heaviest principal axes Rc, respectively. The largest motions in mode 6 is the distortions of dihedral angles. In this mode, both –COOH end and –COO end inl-Asp molecules are involved, resulting in a large distortion on their hydrogen bonding network (See Figure S4 in Supplementary Materials). Like mode 6, mode 8, which generates the second largest absorption peak, also shows that No.1 and No.2l-Asp molecules mainly rotate around the lightest principal axesRaand the heaviest principal axesRc, respectively. However, the intramolecular strips of mode 8 display negligible distortions of the –COO end. The main distortion focuses on the –COOH end.
In case of l-Asn, it can be seen in the experimental THz spectrum of l-Asn that the largest adsorption band around 2.7 THz consists of the modes 6, 7 and 8. Among these modes, the mode 7 is the major participant. Like the modes 6 and 7 ofl-Asp crystal, both twol-Asn molecules in a unit cell translate along the y-axis in mode 6 and 7. The rotations in mode 6 are roughly around a direction which is between the lightest principal axisRaand heaviest principal axisRc. In mode 7, both twol-Asn molecules mainly rotate around the heaviest principal axisRc. The intramolecular strips of mode 6 suggests distortions mainly focus on the –COO end. The intramolecular vibration in mode 7 involves both –COO end and –CONH2end. And the hydrogen bond N2–H· · ·O1, which is the linking between two neighboring No.2 l-Asn molecules and two neighboring No.1 l-Asn molecules, is substantially distorted and stretched in mode 7 of l-Asp crystal (See Figure S11 Supplementary Materials). The intramolecular motion in mode 8 is very similar to that in mode 5 except for the opposite change in dihedral angles. Although the intramolecular motion in mode 8 can also give rise to the distortion of the hydrogen bond N2–H· · ·O1 to some extent, the degree of stretching and distortion is lower compared with that in mode 7 (See Figure S12 Supplementary Materials).
Summarily speaking, we can easily find many similarities in their vibrational characters, especially in their own strongest vibrational modes. The intramolecular motions in mode 6 of l-Asp and the mode 7 of l-Asn both involve the distortion of their two ends. The oxygen or nitrogen atoms which are involved in formation of hydrogen bonds move towards the opposite directions, giving rise to a severe distortion of their hydrogen bonds.
The difference in their low-frequency vibrations can also be discovered from their ”vibrational character ID strips”. By comparing the patterns of intramolecular strips ofl-Asp andl-Asn crystals, we can see that the distortions of the side chain (–COOH group) of l-Asp molecule is more prominent than those of the side chain (–CONH2group) in l-Asn molecule in the studied spectral range. In other words, the side chain inl-Asn molecule can be understood to be more rigid than that of l-Asp. The rationale for this argument could probably be attributed to the different hydrogen bonding networks in l-Asp andl-Asn crystals. As we can observe from Figure 3, the –CONH2group of onel-Asn molecule are linked to otherl-Asn molecules by four hydrogen bonds. However, only two hydrogen bonds are formed between a –COOH group in al-Asp molecule with otherl-Asp molecules. Consequently, compared to the –COOH group of l-Asp molecule, the motion of –CONH2group of l-Asn molecule suffers from larger hindrance from its environment.
4. Conclusion
Terahertz absorption spectra of two amino acids, namely l-Asp andl-Asn, were measured using time- domain Terahertz spectrometer. DFT calculations were carried out to understand observed absorption bands. Calculation results suggest that Grimme’s D2 correction, which describes long-range van der Waals interaction, can significantly improve the calculated lattice parameters of both l-Asp and l-Asn crystals.
The experimental spectra were compared to the calculated spectra obtained by PBE-D2 and BLYP-D2 calculations. The result shows that in principle PBE-D2 functional is superior to BLYP-D2 functional in reproducing THz absorption band. The method, called as ”vibrational character ID strips”, was employed to describe vibrational characters of the low-frequency modes. We found that the frequency modes cor- responding to the most intense THz absorption bands of l-Asp and l-Asn share many common features with each other. Both l-Asp and l-Asn molecules translate along y-axis and rotate about y-axis. And, both modes involve severe distortions of their hydrogen bonds. More importantly, we found that the side chain (carboxyl group) ofl-Asp molecule exhibits larger motions than the side chain (carboxamide group)
ACCEPTED MANUSCRIPT
ofl-Asn molecule. This can be attributed to the less rigid hydrogen bonding networks in l-Asp compared to those inl-Asn.
5. Acknowledgments
Financial support from Hungarian Scientific Research Fund (OTKA) grant No. 113083 is acknowledged.
Authors also acknowledge NIIF for awarding them access to resource based in Hungary at P´ecs. YL ac- knowledge valuable suggestions to improve the quality of manuscript with Dr. Qiang Zhu (Department of Geosciences, State University of New York at Stony Brook, USA).
6. Author Information Yin LI’s present address:
Department of Physics, Faculty of Science, Nanchang University No.999 Xuefu Avenue, Nanchang City, CHINA Zip-code: 330031 References
[1] K. Siegrist, C. R. Bucher, I. Mandelbaum, A. R. Hight Walker, R. Balu, S. K. Gregurick, D. F. Plusquellic,
High-resolution terahertz spectroscopy of crystalline trialanine: extreme sensitivity to beta-sheet structure and cocrystallized water., Journal of the American Chemical Society 128 (17) (2006) 5764–75. doi:10.1021/ja058176u.
URLhttp://www.ncbi.nlm.nih.gov/pubmed/16637645
[2] R. Rungsawang, Y. Ueno, I. Tomita, K. Ajito, Angle-dependent terahertz time-domain spectroscopy of amino acid single crystals., The journal of physical chemistry. B 110 (42) (2006) 21259–63. doi:10.1021/jp060492n.
URLhttp://www.ncbi.nlm.nih.gov/pubmed/17048954
[3] S. Ebbinghaus, S. J. Kim, M. Heyden, X. Yu, M. Gruebele, D. M. Leitner, M. Havenith, Protein sequence- and ph-dependent hydration probed by terahertz spectroscopy, Journal of the American Chemical Soci- ety 130 (8) (2008) 2374–2375, pMID: 18247605.arXiv:http://dx.doi.org/10.1021/ja0746520,doi:10.1021/ja0746520.
URLhttp://dx.doi.org/10.1021/ja0746520
[4] S. Ebbinghaus, S. J. Kim, M. Heyden, X. Yu, U. Heugen, M. Gruebele, D. M. Leitner, M. Havenith, An extended dynamical hydration shell around proteins, Proceedings of the National Academy of Sciences 104 (52) (2007) 20749–20752. arXiv:http://www.pnas.org/content/104/52/20749.full.pdf,doi:10.1073/pnas.0709207104.
URLhttp://www.pnas.org/content/104/52/20749.abstract
[5] U. Heugen, G. Schwaab, E. Brndermann, M. Heyden, X. Yu, D. M. Leitner, M. Havenith, Solute-induced retardation of water dynamics probed directly by terahertz spectroscopy, Proceedings of the National Academy of Sciences 103 (33) (2006) 12301–12306. arXiv:http://www.pnas.org/content/103/33/12301.full.pdf, doi:10.1073/pnas.0604897103.
URLhttp://www.pnas.org/content/103/33/12301.abstract
[6] D. A. Schmidt, O. Birer, S. Funkner, B. P. Born, R. Gnanasekaran, G. W. Schwaab, D. M. Leitner, M. Havenith, Rattling in the cage: Ions as probes of sub-picosecond water network dynamics, Journal of the American Chemical Society 131 (51) (2009) 18512–18517, pMID: 19928959. arXiv:http://dx.doi.org/10.1021/ja9083545, doi:10.1021/ja9083545.
URLhttp://dx.doi.org/10.1021/ja9083545
[7] B. Born, S. J. Kim, S. Ebbinghaus, M. Gruebele, M. Havenith, The terahertz dance of water with the proteins:
the effect of protein flexibility on the dynamical hydration shell of ubiquitin, Faraday Discuss. 141 (2009) 161–173.
doi:10.1039/B804734K.
[8] S. Funkner, G. Niehues, D. A. Schmidt, M. Heyden, G. Schwaab, K. M. Callahan, D. J. Tobias, M. Havenith, Watching the Low-Frequency Motions in Aqueous Salt Solutions: The Terahertz Vibrational Signatures of Hydrated Ions., JACs 134 (2) (2012) 1030–1035. doi:10.1021/ja207929u.
URLhttp://www.ncbi.nlm.nih.gov/pubmed/22124334
[9] P. R. Tulip, S. J. Clark, Lattice dynamical and dielectric properties of l-amino acids, Physical Review B 74 (6) (2006) 064301.doi:10.1103/PhysRevB.74.064301.
[10] T. Korter, R. Balu, M. Campbell, M. Beard, S. Gregurick, E. Heilweil, Terahertz spectroscopy of solid serine and cysteine, Chemical Physics Letters 418 (1-3) (2006) 65–70. doi:10.1016/j.cplett.2005.10.097.
URLhttp://www.sciencedirect.com/science/article/pii/S0009261405015988
[11] D. G. Allis, D. A. Prokhorova, , T. M. Korter*, Solid-state modeling of the terahertz spectrum of the high explosive hmx, The Journal of Physical Chemistry A 110 (5) (2006) 1951–1959, pMID: 16451029.
arXiv:http://dx.doi.org/10.1021/jp0554285,doi:10.1021/jp0554285.
URLhttp://dx.doi.org/10.1021/jp0554285
ACCEPTED MANUSCRIPT
[12] P. U. Jepsen, S. J. Clark, Precise ab-initio prediction of terahertz vibrational modes in crystalline systems, Chemical Physics Letters 442 (4-6) (2007) 275–280. doi:10.1016/j.cplett.2007.05.112.
[13] D. Allis, A. Fedor, T. Korter, J. Bjarnason, E. Brown, Assignment of the lowest-lying thz absorption signatures in biotin and lactose monohydrate by solid-state density functional theory, Chemical Physics Letters 440 (4–6) (2007) 203 – 209.
doi:10.1016/j.cplett.2007.04.032.
[14] A. D. Burnett, J. Kendrick, J. E. Cunningham, M. D. Hargreaves, T. Munshi, H. G. M. Edwards, E. H. Linfield, a. G.
Davies, Calculation and measurement of terahertz active normal modes in crystalline PETN, ChemPhysChem 11 (2010) 368–378. doi:10.1002/cphc.200900548.
[15] M. D. King, P. M. Hakey, T. M. Korter, Discrimination of chiral solids: A terahertz spectroscopic investigation of l- and dl-serine, The Journal of Physical Chemistry A 114 (8) (2010) 2945–2953. doi:10.1021/jp911863v.
[16] M. D. King, W. D. Buchanan, T. M. Korter, Identification and quantification of polymorphism in the pharmaceutical compound diclofenac acid by terahertz spectroscopy and solid-state density functional theory, Analytical Chemistry 83 (10) (2011) 3786–3792. doi:10.1021/ac2001934.
[17] A. M. Silva, S. N. Costa, F. A. M. Sales, V. N. Freire, E. M. Bezerra, R. P. Santos, U. L. Fulco, E. L. Albuquerque, E. W. S.
Caetano, Vibrational spectroscopy and phonon-related properties of the l-aspartic acid anhydrous monoclinic crystal, The Journal of Physical Chemistry A 119 (49) (2015) 11791–11803, pMID: 26623495.
arXiv:http://dx.doi.org/10.1021/acs.jpca.5b08784,doi:10.1021/acs.jpca.5b08784.
URLhttp://dx.doi.org/10.1021/acs.jpca.5b08784
[18] F. Zhang, O. Kambara, K. Tominaga, J.-i. Nishizawa, T. Sasaki, H.-W. Wang, M. Hayashi, Analysis of vibrational spectra of solid-state adenine and adenosine in the terahertz region, RSC Advances 4 (1) (2014) 269.doi:10.1039/c3ra44285c.
URLhttp://xlink.rsc.org/?DOI=c3ra44285c
[19] F. Zhang, H.-W. Wang, K. Tominaga, M. Hayashi, Intramolecular vibrations in low-frequency normal modes of amino acids:l-alanine in the neat solid state, The Journal of Physical Chemistry A 119 (12) (2015) 3008–3022.
doi:10.1021/jp512164y.
[20] M. R. C. Williams, A. B. True, A. F. Izmaylov, T. a. French, K. Schroeck, C. a. Schmuttenmaer, Terahertz spectroscopy of enantiopure and racemic polycrystalline valine., Physical chemistry chemical physics : PCCP 13 (24) (2011) 11719–11730. doi:10.1039/c1cp20594c.
URLhttp://pubs.rsc.org/en/content/articlepdf/2011/cp/c1cp20594c
[21] M. R. C. Williams, D. J. Aschaffenburg, B. K. Ofori-Okai, C. a. Schmuttenmaer, Intermolecular vibrations in hydropho- bic amino acid crystals: Experiments and calculations, Journal of Physical Chemistry B 117 (36) (2013) 10444–10461.
doi:10.1021/jp406730a.
[22] A. Matei, N. Drichko, B. Gompf, M. Dressel, Far-infrared spectra of amino acids, Chemical Physics 316 (1-3) (2005) 61–71.
doi:10.1016/j.chemphys.2005.04.033.
[23] J. Thomas R. Juliano, T. M. Korter, London Force Correction Disparity in the Modeling of Crystalline Asparagine and Glutamine, Journal of Physical Chemistry A 118 (51) (2014) 12221–12228. doi:10.1021/jp507924p.
[24] T. R. Juliano, T. M. Korter, Origins of Hydration Differences in Homochiral and Racemic Crystals of Aspartic Acid, The Journal of Physical Chemistry A 119 (8) (2015) 1396–1403. doi:10.1021/jp512359p.
URLhttp://pubs.acs.org/doi/abs/10.1021/jp512359p
[25] P. Giannozzi, S. Baroni, N. Bonini, M. Calandra, R. Car, C. Cavazzoni, D. Ceresoli, G. L. Chiarotti, M. Co- coccioni, I. Dabo, A. Dal Corso, S. de Gironcoli, S. Fabris, G. Fratesi, R. Gebauer, U. Gerstmann, C. Gougous- sis, A. Kokalj, M. Lazzeri, L. Martin-Samos, N. Marzari, F. Mauri, R. Mazzarello, S. Paolini, A. Pasquarello, L. Paulatto, C. Sbraccia, S. Scandolo, G. Sclauzero, A. P. Seitsonen, A. Smogunov, P. Umari, R. M. Wentz- covitch, Quantum espresso: a modular and open-source software project for quantum simulations of materials, Journal of Physics: Condensed Matter 21 (39) (2009) 395502 (19pp).
URLhttp://www.quantum-espresso.org
[26] The pseduopotential files were downloaded from the pseudopotential library online., http://www.quantum-espresso.org/pseudopotentials/.
[27] S. Grimme, Semiempirical gga-type density functional constructed with a long-range dispersion correction, Journal of Computational Chemistry 27 (15) (2006) 1787–1799. doi:10.1002/jcc.20495.
URLhttp://dx.doi.org/10.1002/jcc.20495
[28] A. Kokalj, Computer graphics and graphical user interfaces as tools in simulations of matter at the atomic scale, Com- putational Materials Science 28 (2) (2003) 155 – 168, proceedings of the Symposium on Software Development for Process and Materials Design. doi:http://dx.doi.org/10.1016/S0927-0256(03)00104-6.
URLhttp://www.sciencedirect.com/science/article/pii/S0927025603001046
[29] A. Togo, I. Tanaka, First principles phonon calculations in materials science, Scr. Mater. 108 (2015) 1–5.
[30] D. Fern´andez-Torre, R. Escribano, T. Archer, J. M. Pruneda, E. Artacho, First-principles infrared spectrum of nitric acid and nitric acid monohydrate crystals, The Journal of Physical Chemistry A 108 (10535-10541) (2004) 10535–10541. doi:10.1021/jp047249d.
URLhttp://pubs.acs.org/doi/abs/10.1021/jp047249d
[31] C. Jelsch, E.-e. Bendeif, The experimental library multipolar atom model refinement ofl-aspartic acid, Acta Crystallo- graphica Section C 63 (6) (2007) o361–o364. doi:10.1107/S0108270107021671.
URLhttp://dx.doi.org/10.1107/S0108270107021671
[32] K. Yamada, D. Hashizume, T. Shimizu, S. Yokoyama, l-Asparagine, Acta Crystallographica Section E 63 (9) (2007) o3802–o3803. doi:10.1107/S1600536807039505.
ACCEPTED MANUSCRIPT
URLhttp://dx.doi.org/10.1107/S1600536807039505
[33] F. Shimojo, Z. Wu, A. Nakano, R. K. Kalia, P. Vashishta, Density functional study of 1,3,5-trinitro-1,3,5-triazine molecular crystal with van der waals interactions, The Journal of Chemical Physics 132 (9) (2010) 094106–1–8.
doi:10.1063/1.3336452.
[34] C. Frayret, E. I. Izgorodina, D. R. MacFarlane, A. Villesuzanne, A.-L. Barres, O. Politano, D. Rebeix, P. Poizot, Electro- chemical properties of crystallized dilithium squarate: insight from dispersion-corrected density functional theory, Phys.
Chem. Chem. Phys. 14 (2012) 11398–11412. doi:10.1039/C2CP41195D.
[35] M. D. King, W. D. Buchanan, T. M. Korter, Investigating the anharmonicity of lattice vibrations in water-containing molecular crystals through the terahertz spectroscopy of l-serine monohydrate, The Journal of Physical Chemistry A 114 (35) (2010) 9570–9578. doi:10.1021/jp105384x.
ACCEPTED MANUSCRIPT
Graphical Abstract
ACCEPTED MANUSCRIPT
Highlights
• PBE-D2 is better than BLYP-D2 in prediction of THz spectra of L-Asp and L-Asn.
• The motions producing largest THz absorption peaks of L-Asp and L-Asn are similar.
• The side chain of L-Asp shows more freedom in motion than that of L-Asn.