*Corresponding author: Gellert Karvaly, DPharm, PhD, Department of Laboratory Medicine, Semmelweis University, 4 Nagyvárad tér, H-1089 Budapest, Hungary, Phone: +361.2351600/extension 55545, Fax: +361.4591500/extension 55545,
E-mail: karvaly.gellert@pharma.semmelweis-univ.hu; and Bionics Innovation Center, Budapest, Hungary
Katalin Mészáros: Department of Laboratory Medicine, Semmelweis University, Budapest, Hungary; and HAS-SE “Momentum” Hereditary Endocrine Tumours Research Group, Budapest, Hungary
Krisztián Kovács and Barna Vásárhelyi: Department of Laboratory Medicine, Semmelweis University, Budapest, Hungary; and Bionics Innovation Center, Budapest, Hungary
Attila Patócs: Department of Laboratory Medicine, Semmelweis University, Budapest, Hungary; HAS-SE “Momentum” Hereditary Endocrine Tumours Research Group, Budapest, Hungary; and Bionics Innovation Center, Budapest, Hungary
Zoltán Sipák: Petz Aladár Teaching Hospital, Győr, Hungary
Gellert Karvaly*, Katalin Mészáros, Krisztián Kovács, Attila Patócs, Zoltán Sipák and Barna Vásárhelyi
Looking beyond linear regression and Bland- Altman plots: a comparison of the clinical performance of 25-hydroxyvitamin D tests
DOI 10.1515/cclm-2016-0536
Received June 19, 2016; accepted July 5, 2016; previously published online August 15, 2016
Abstract
Background: The systematic evaluation of the clinical con- cordance of various 25-hydroxyvitamin D (25OHD) testing methods is presented. The need for this approach is raised by the discrepancies in the analytical performance of the available assays.
Methods: The analytical and clinical performance of six automated 25OHD assays and an in-house liquid chroma- tography-tandem mass spectrometry (LC-MS/MS) method was investigated. Leftover serum samples (n = 162, SA:
n = 114) were analyzed and all 21 assay combinations were evaluated. The utility of Cohen’s κ values was assessed by transforming them into minimum percentage agree- ment (MPA). McNemar’s hypothesis test was employed for testing the symmetry of the disagreeing classification out- comes within each method pair.
Results: Depending on the assay method, the ratio of results classified as positive ( < 20 ng/mL) was 13.5%–40.0%. The percentage agreement (PA) was 74.1%–92.6%. Compared to other methods, significantly more hypovitaminosis cases were delivered by DiaSorin Liaison® 25 OH vitamin D
Total (DL) and significantly fewer by IDS-iSYS 25-Hydroxy Vitamin DS (II). The strongest clinical concordance was exerted by II vs. LC-MS/MS. The κ-derived MPA showed close similarity to the PA scores. McNemar’s tests con- firmed the asymmetry of the disagreement in the classifi- cation in 14 method combinations.
Conclusions: The presented approach allows the predic- tion of the clinical consequences of a 25OHD method transfer. Differences in the clinical classification of assay results are likely encountered when transferring to a new method, even between assays standardized according to the Vitamin D Standardization Program (VDSP) Reference Method Procedure (RMP).
Keywords: 25-hydroxyvitamin D; hypovitaminosis D;
immunoassay; liquid chromatography-tandem mass spec- trometry; method comparison; multicriteria evaluation.
Introduction
There continues to be a considerable interest in the clinical assessment of vitamin D status, maintaining the increase in the number of the available automated and liquid chromatographic 25-hydroxyvitamin D (25OHD) testing methods [1–4]. Despite their preferred use, serious doubt has been cast on the comparability of the performance of the automated assays, which is a major issue because the threshold of hypovitaminosis D requiring intervention, most commonly 20 ng/mL (50 nmol/L), is not linked to any of the methods [5–7]. In addition, no consensus on the critical 25OHD levels in special patient groups such as children, the pregnant, the obese, the critically ill, or those undergoing hemodialysis is available, but once it is established, further thresholds are likely to be defined, increasing the complexity of method comparisons and potentially exacerbating the confusion over the interpre- tation of test results [8–11].
Numerous studies have been published recently with the aim to compare the outputs of 25OHD assays. All of these works have compared the analytical performance to
that of a reference method [primarily liquid chromatog- raphy coupled with tandem mass spectrometry (LC-MS/
MS) or ultraviolet detection, or radioimmunoassay], with the evaluation relying on linear regression (ordinary least squares, Passing-Bablok or Deming) combined with Bland-Altman analysis. Because of the complexity of the inconsistencies in the performance of the available assays and, possibly, the narrow range of the evaluation tools employed, this approach has not proven adequate for pre- dicting the clinical consequences of transferring between 25OHD testing methods [8, 12].
As a major step forward, the Vitamin D Standardiza- tion Program (VDSP), an international effort to provide a framework for the standardization and harmonization of 25OHD assays, is underway. With a reference method procedure (RMP) allowing the 25OHD contents of blood samples to be traced back to standard reference materi- als acknowledged by the National Institute of Standardi- zation and Technology, USA, the VDSP is a very efficient platform for the credible evaluation the analytical perfor- mance [13, 14]. Automated tests with their performance standardized in VDSP RMP have already been launched, including three assays discussed herein. The Vitamin D External Quality Assessment Scheme (DEQAS) has also contributed valuably to the identification of phenomena which have an impact on method performance [15–18].
The direct assessment of the clinical concordance of the results obtained with various 25OHD assays is equally important for comparing method performance, yet it has received much less attention. Such evaluation has occa- sionally been included in a few studies by displaying patterns of the clinical classifications [19, 20], determin- ing sensitivity and specificity [4, 20], assessing relative false positives and false negatives [21], or by calculating the percentage agreement (PA) of clinical classifications [16, 22] and/or Cohen’s κ values [4, 12, 23–25]. In each case, the evaluation was accomplished against the results obtained using the reference method, except for the work of Cavalier et al. who calculated the clinical concordance for all combinations of the compared assays [22].
In the present work, the pairwise combinations of seven 25OHD testing methods, six automated assays [Abbott Architect 25-OH Total Vitamin D (AA), Beckmann Access 25(OH) Vitamin D Total (BA), DiaSorin Liaison® 25 OH vitamin D TOTAL (DL), IDS-iSYS 25-Hydroxy Vitamin DS (II), Roche Elecsys® Vitamin D Total (RE) and Siemens Advia Centaur Vitamin D Total (VitD) Assay (SA)]
and one based on the LC-MS/MS technique are compared both in terms of their analytical and their clinical perfor- mance. Our aim is to demonstrate the importance and the feasibility of the assessment of the clinical concordance
of assay results for comparing the performance of various 25OHD assays.
Materials and methods
Patient samples
Leftover blood samples taken from non-selected (e.g. by age, sex or vitamin D supplementation) adult in- and outpatients and previously analyzed in routine 25OHD assays were de-identified, divided into 0.3- to 0.4-mL aliquots, and kept at –20 °C. Sample collection and processing and the handling of patient data were undertaken with adherence to effective legal and ethical regulations. In accordance, no samples or patient data were collected specifically for the pur- poses of our investigations.
One hundred and sixty-two samples were involved in the study.
Due to technical issues, only 114 results from the SA assay were even- tually included. In a number of cases the automated tests delivered results lower than their low limit of quantification. These samples were excluded from the evaluation of the analytical performance.
The samples involved to assess the clinical concordance of results obtained using AA, BA, DL, II, RE and LC-MS/MS were from patients with a median age of 55 years, range, 4–91 years, male/
female ratio, 22.8:77.2. The median age of patients whose samples were included in the evaluation of the clinical performance of SA was 54 years, range, 4–91 years, male/female ratio, 23.0:77.0.
Analysis using liquid chromatography-tandem mass spectrometry
LC-MS/MS assays were performed by Bionics Innovation Center Ltd.
(Budapest, Hungary).
25-Hydroxyvitamin D2 (25OHD2) and 25OHD3 and the inter- nal standard (IS) 26,26,26,27,27,27-D6-25-hydroxyvitamin D3 were purchased from Sigma-Aldrich Hungary Ltd. (Budapest, Hungary).
LC-MS grade solvents were procured from VWR International Ltd.
(Debrecen, Hungary). Ethyl acetate (LiChrosolv®) was obtained from Merck Hungary Ltd. (Budapest, Hungary). Nitrogen gas 5.0 was sup- plied by Messer Hungarogáz Kft. (Budapest, Hungary).
The assays were conducted on a Perkin-Elmer Flexar FX ultra-performance liquid chromatograph coupled to an AB Sciex 5500QTRAP mass spectrometer operated in the positive electrospray ionization mode. Nitrogen gas was supplied by a Peak Genius AB3G nitrogen generator (Per-Form Hungária Ltd, Budapest, Hungary).
Chromatographic separation was performed on a Phenomenex Kinetex XB-C18 column (50 × 2.1 mm, 1.7 µm) thermostatted at 35 °C.
Water containing 0.1% formic acid (A) and methanol containing 0.3%
formic acid (B) were used as mobile phase components. The gradient program started at 60% B, hold 1.0 min, then 100% B at 6.0 min, hold 1.5 min, then 60% B at 8.0 min. The run time was 10 min, the eluent flow rate was 200 µL/min and 10 µL sample was injected.
The following parameter settings were applied for the opera- tion of the mass spectrometer: source temperature, 500 °C; ioniza- tion voltage, 5000 V; curtain gas, 40 psi; gas 1, 40 psi; gas 2, 40 psi;
entrance potential, 10 V. Target analytes were detected by scheduled
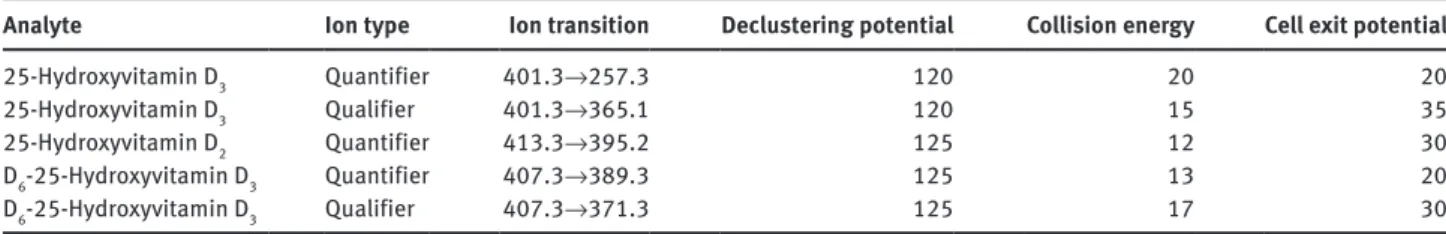
multiple reaction monitoring at 7.45 min, with detection window of 60 s and target scan time of 1.0000 s, applying the compound specific settings displayed in Table 1.
Sample preparation for LC-MS/MS
Calibrator solutions were prepared in a 1:1 mixture of water and methanol containing 25OHD2 (1.0, 2.0, 5.0, 10.0 or 20 ng/mL) and 25OHD3 (1.0, 5.0, 20.0, 50.0 or 100 ng/mL). A 0.5-mL serum sample was diluted with 0.5 mL water after being spiked with 18 µL 1.4 µg/mL IS solution. The mixture was extracted twice with 1.0 mL ethyl ace- tate. The organic phases were combined and evaporated to dryness under nitrogen. The residue was reconstituted with 300 µL water/
methanol 1:1 mixture and submitted for analysis.
Validation of LC-MS/MS
The LC-MS/MS method was validated prior to use. The limits of detection of 25OHD2 and 25OHD3 were 5 pg each. The low limits of quantitation in the serum matrix were 1.0 ng/mL each. Linearity was verified over the range of interest for both analytes. 25OHD2 and 25OHD3 displayed a linear relationship of the concentration and the analyte/IS peak areas between 1–20 and 1–100 ng/mL, respectively (n = 3 for each level, weighting: 1/x2, r2 > 0.9900). The recoveries were 64.7±9.2% and 62.4±7.7%, respectively. The intra-assay precision, determined at four levels, n = 5 for each level, was ≤ 9.2% and ≤ 7.4%
for 25OHD2 and 25OHD3, respectively. The inter-assay precision, con- ducted over five consecutive days, determined at four levels, n = 2 for each level, was ≤ 14.4% and ≤ 11.2%, respectively.
Automated assays
Samples were analyzed using the following reagent kits and plat- forms: Abbott Architect 25-OH Total Vitamin D assay (ref. 3L52, lot:
00614C000) on an Abbott Architect i2000 (Abbott Laboratories (Magyarország) Kft, Budapest, Hungary), Access 25(OH) Vitamin D Total assay (ref. B24838, lot: 335362) on a Beckmann Access analyzer (Beckman Coulter Magyarország Kft, Budapest, Hungary), DiaSorin Liaison® 25 OH vitamin D TOTAL assay (ref. 310600, lot: 130938) on a DiaSorin Liaison XL analyzer (Buda Labor Kft, Budapest, Hungary), IDS-iSYS 25-Hydroxy Vitamin DS assay (ref. IS-2700S, lot: 1861) on a IDS-iSYS Multi-Discipline Automated System (Diagon Kft, Budapest, Hungary), Roche Elecsys® Vitamin D Total assay (ref. 05894913190, lot: 175262) on a Roche Cobas 601 instrument (Roche Kft, Budapest, Hungary), and Siemens ADVIA Centaur Vitamin D (VitD) Total assay
(ref. 10699201, lot: 10998063) on a Siemens Centaur XP platform (Diagon Kft, Budapest, Hungary). Analysis using SA was performed at the Central Laboratory, Petz Aladár Teaching Hospital, Győr, Hungary. All other automated assays were conducted in the Depart- ment of Laboratory Medicine, Semmelweis University (Budapest, Hungary).
Instruments, reagent kits, calibrators and controls were used in full compliance with the instructions of the manufacturers. Table 2 presents the major features of the automated assays involved in the study.
Evaluation and statistical analysis
Quantitative analysis of the LC-MS/MS data was performed by apply- ing a 1/x2 weight to the linear regression on the calibration points.
25OHD2/IS and 25OHD3/IS peak area ratios were used for quantita- tion. The results obtained on the automated platforms were quanti- tated as proposed by the manufacturers of the assay kits.
Plots were generated in R [26] using the ‘beeswarm’ package and Microsoft Excel 2013. Passing-Bablok analysis was performed in R using the mcreg(method.reg = “PaBa”) function of the ‘mcr’ package.
Concordance correlation coefficients (CCC) were determined using the epi.ccc() function of the ‘epiR’ package. The same function was used for generating data for the Bland-Altman analysis, with means and 95% confidence intervals calculated by basic functions of the R environment. The PA was determined by conducting the pairwise comparison of the clinical classifications of results (hypovitamino- sis, lower than 20.0 ng/mL or euvitaminosis, not lower than 20.0 ng/
mL) and calculating the percentages of the agreeing classifications.
The data sets were assumed to follow binomial distribution and 95%
confidence intervals were calculated in R using the binom.test() func- tion (Clopper-Pearson method).
Cohen’s κ values were calculated using GraphPad QuickCalcs (GraphPad Software Inc, La Jolla, CA, USA. Website: http://graphpad.
com/quickcalcs/kappa1/, accessed: 10 June 2016) and transformed into minimum percentage agreement (MPA) scores using a Monte- Carlo simulation. Briefly, the value of cell ‘a’ was first generated as a random integer from 0 to n (162 or 114). The values of cells ‘b’ and
‘c’ were random integers generated between 0 and n–a and n–(a+b), respectively. The value of cell ‘d’ was calculated as d = n–(a+b+c). In each simulation, 1,000,000 κ values were determined, and the PA was calculated as PA = a+d/n for each iteration with κi = κ. The mini- mum PA was extracted from the resulting data set. The script of the Monte-Carlo simulation is available as Supplementary Material to this publication.
The statistical significance of the difference in clinical perfor- mance was interrogated using McNemar’s hypothesis tests with a 95%
confidence interval. For method pairs where the sum of the results in
Table 1: Mass spectrometry settings for the analysis of 25-hydroxyvitamin D3 and 25-hydroxyvitamin D2.
Analyte Ion type Ion transition Declustering potential Collision energy Cell exit potential
25-Hydroxyvitamin D3 Quantifier 401.3→257.3 120 20 20
25-Hydroxyvitamin D3 Qualifier 401.3→365.1 120 15 35
25-Hydroxyvitamin D2 Quantifier 413.3→395.2 125 12 30
D6-25-Hydroxyvitamin D3 Quantifier 407.3→389.3 125 13 20
D6-25-Hydroxyvitamin D3 Qualifier 407.3→371.3 125 17 30
disagreement was lower than 25, McNemar’s exact binomial test was applied using the mcnemar.exact() function of the ‘exact2x2’ package of R. For the rest of the method pairs, McNemar’s test with continuity correction was employed by running the mcnemar.test() function of the ‘stats’ package. The p-values were adjusted for multiple testing using Hommel’s formula.
All other calculations were performed using Microsoft Excel 2013.
Results
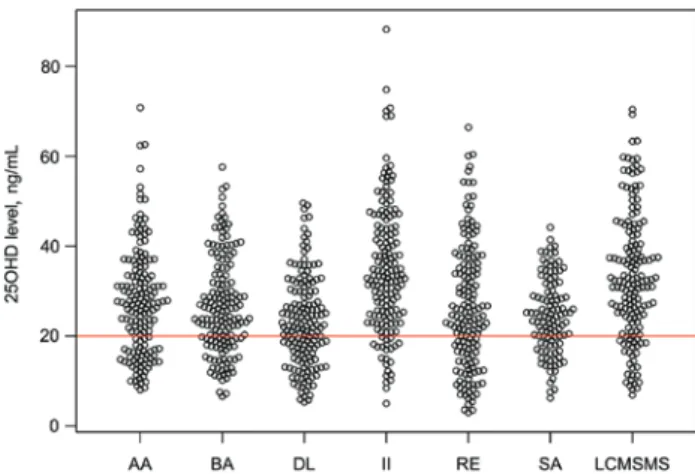
The DL, AA, RE, BA, II, SA and LC-MS/MS assays deliv- ered 25OHD concentrations with the following medians (with ranges in parentheses): 22.0 (5.3–49.6) ng/mL, 27.2 (8.1–70.8) ng/mL, 24.5 (3.0–66.4) ng/mL, 25.3 (6.6–57.6) ng/mL, 33.1 (5.0–88.2) ng/mL, 24.4 (6.2–44.2) ng/mL, and 32.1 (6.9–70.4) ng/mL, respectively. Only two samples were found to contain 25-hydroxyvitamin D2 (1.25 ng/mL and 2.05 ng/mL) above the limit of quantitation using LC-MS/
MS, therefore, the comparison studies are effectively based on the 25-hydroxycholecalciferol levels. The raw assay results are shown in Figure 1.
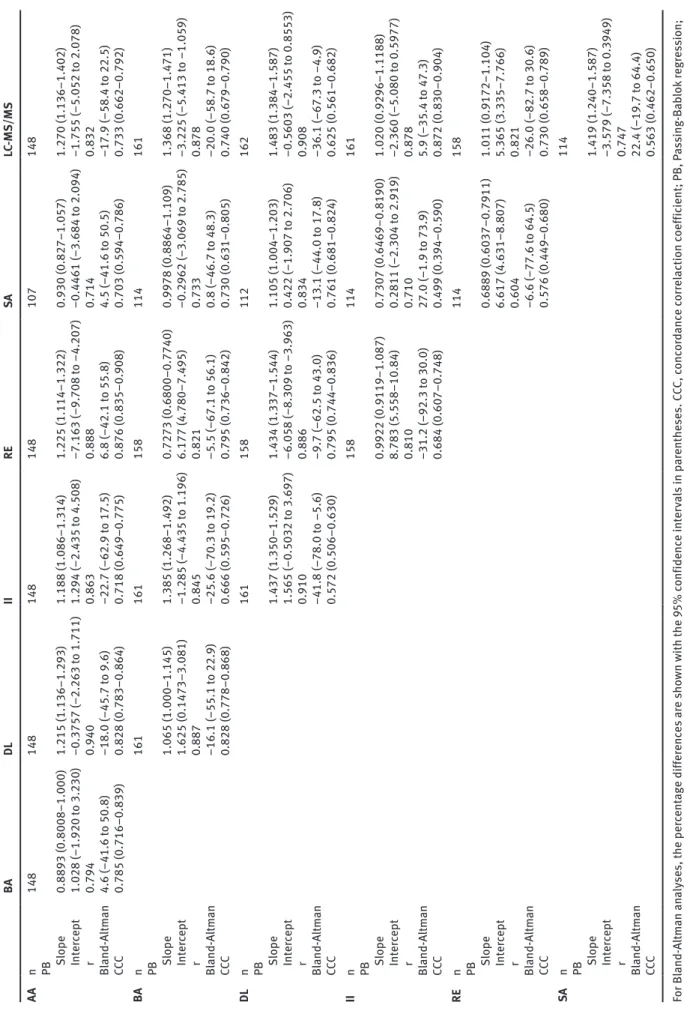
The results of the comparisons of analytical perfor- mance are shown in Table 3. The correlation coefficients of the Passing-Bablok analyses ranged between 0.604 (RE vs. SA) and 0.940 (AA vs. DL). The CCC was between 0.499 (II vs. SA) and 0.876 (AA vs. RE).
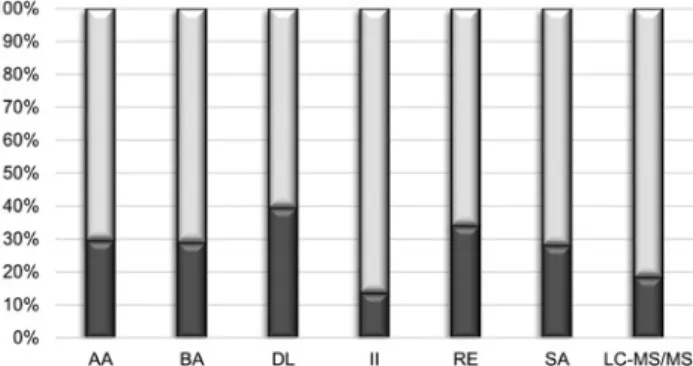
The highest proportion of < 20 ng/mL results was obtained with DL (39.5%), followed by the RE, AA, BA, SA, LC-MS/MS and II assays (34.0%, 29.6%, 29.0%, 28.1%, 18.5% and 13.6%, respectively, Figure 2). The mean PA
Table 2: Major features of the automated assays involved in the study. Abbott Architect 25-OH Vitamin D Beckmann Access 25 (OH) Vitamin D Total DiaSorin Liaison 25 OH Vitamin D Total IDS-iSYS 25-Hydroxy Vitamin DS Roche Elecsys Vitamin D Siemens ADVIA Centaur Vitamin D Total (Vit D) FDA 510(k) decision summary identifier k110619 k142373 k112725 k140554 k113546 k133156 Method principle CMIA CLIA CLIA CLIA ECLIA CLIA Measuring range, ng/mL 13–96 7–120 4–150 7–125 5–60 4.2–150 Antibodies Sheep polyclonal Sheep monoclonal Goat polyclonal Sheep polyclonal VDBP Mouse monoclonal Predicate method DiaSorin Liaison 25 OH Vitamin D Total Assay (1st generation) DiaSorin Liaison 25 OH Vitamin D Total Assay DiaSorin 25-hydroxyvitamin D RIA Assay IDS-iSYS 25-hydroxyvitamin D Assay Abbott Architect 25-OH vitamin D Assay
Siemens ADVIA Centaur Vitamin D Total Assay Standardized to VDSP No Yes No Yes No Yes Reference range < 13–47.8 11.9–43.6 9.3–47.9 12.7–64.2 6.36–49.53 Adult: 7.4–44.0, pediatric: 11.4–45.8 Limit of blank, ng/mL 1.9 0.55 Not declared 0.6 2 1.7 Limit of detection, ng/mL 3.1 1.0 2 2.6 3 3.2 Limit of quantitation, ng/mL 8.0 3.0 4 7.0 5.00 4.2 Within-run precision, % 1.4–3.7 1.5–3.8 4.8–7.7 5.1–6.4 1.6–8.2 3.0–5.3 Total precision, % 2.6–4.6 6.8–7.7 8.8–12.5 7.2–10.6 2.5–10.9 4.2–11.9 CLIA, chemiluminescent immunoassay; CMIA, chemiluminescent microparticle immunoassay; ECLIA, enzyme chemiluminescent immunoassay; RIA, radioimmunoassay; VDBP, Vitamin D binding protein.
Figure 1: Beeswarm plot of the 25-hydroxyvitamin D concentrations obtained using the various testing methods.
The red line corresponds to the 20 ng/mL level which is most frequently considered as the threshold for hypovitaminosis D. See the Materials and methods section for the full identification of the assays.
Table 3: Results of the comparison of the analytical performance of the assays involved in the study. BA DL II RE SA LC-MS/MS AA n 148 148 148 148 107 148 PB Slope 0.8893 (0.8008–1.000) 1.215 (1.136–1.293) 1.188 (1.086–1.314) 1.225 (1.114–1.322) 0.930 (0.827–1.057) 1.270 (1.136–1.402) Intercept 1.028 (–1.920 to 3.230) –0.3757 (–2.263 to 1.711) 1.294 (–2.435 to 4.508) –7.163 (–9.708 to –4.207) –0.4461 (–3.684 to 2.094) –1.755 (–5.052 to 2.078) r 0.794 0.940 0.863 0.888 0.714 0.832 Bland-Altman 4.6 (–41.6 to 50.8) –18.0 (–45.7 to 9.6) –22.7 (–62.9 to 17.5) 6.8 (–42.1 to 55.8) 4.5 (–41.6 to 50.5) –17.9 (–58.4 to 22.5) CCC 0.785 (0.716–0.839) 0.828 (0.783–0.864) 0.718 (0.649–0.775) 0.876 (0.835–0.908) 0.703 (0.594–0.786) 0.733 (0.662–0.792) BA n 161 161 158 114 161 PB Slope 1.065 (1.000–1.145) 1.385 (1.268–1.492) 0.7273 (0.6800–0.7740) 0.9978 (0.8864–1.109) 1.368 (1.270–1.471) Intercept 1.625 (0.1473–3.081) –1.285 (–4.435 to 1.196) 6.177 (4.780–7.495) –0.2962 (–3.069 to 2.785) –3.225 (–5.413 to –1.059) r 0.887 0.845 0.821 0.733 0.878 Bland-Altman –16.1 (–55.1 to 22.9) –25.6 (–70.3 to 19.2) –5.5 (–67.1 to 56.1) 0.8 (–46.7 to 48.3) –20.0 (–58.7 to 18.6) CCC 0.828 (0.778–0.868) 0.666 (0.595–0.726) 0.795 (0.736–0.842) 0.730 (0.631–0.805) 0.740 (0.679–0.790) DL n 161 158 112 162 PB Slope 1.437 (1.350–1.529) 1.434 (1.337–1.544) 1.105 (1.004–1.203) 1.483 (1.384–1.587) Intercept 1.565 (–0.5032 to 3.697) –6.058 (–8.309 to –3.963) 0.422 (–1.907 to 2.706) –0.5603 (–2.455 to 0.8553) r 0.910 0.886 0.834 0.908 Bland-Altman –41.8 (–78.0 to –5.6) –9.7 (–62.5 to 43.0) –13.1 (–44.0 to 17.8) –36.1 (–67.3 to –4.9) CCC 0.572 (0.506–0.630) 0.795 (0.744–0.836) 0.761 (0.681–0.824) 0.625 (0.561–0.682) II n 158 114 161 PB Slope 0.9922 (0.9119–1.087) 0.7307 (0.6469–0.8190) 1.020 (0.9296–1.1188) Intercept 8.783 (5.558–10.84) 0.2811 (–2.304 to 2.919) –2.360 (–5.080 to 0.5977) r 0.810 0.710 0.878 Bland-Altman –31.2 (–92.3 to 30.0) 27.0 (–1.9 to 73.9) 5.9 (–35.4 to 47.3) CCC 0.684 (0.607–0.748) 0.499 (0.394–0.590) 0.872 (0.830–0.904) RE n 114 158 PB Slope 0.6889 (0.6037–0.7911) 1.011 (0.9172–1.104) Intercept 6.617 (4.631–8.807) 5.365 (3.335–7.766) r 0.604 0.821 Bland-Altman –6.6 (–77.6 to 64.5) –26.0 (–82.7 to 30.6) CCC 0.576 (0.449–0.680) 0.730 (0.658–0.789) SA n 114 PB Slope 1.419 (1.240–1.587) Intercept –3.579 (–7.358 to 0.3949) r 0.747 Bland-Altman 22.4 (–19.7 to 64.4) CCC 0.563 (0.462–0.650) For Bland-Altman analyses, the percentage differences are shown with the 95% confidence intervals in parentheses. CCC, concordance correlaction coefficient; PB, Passing-Bablok regression; r, Pearson’s correlation coefficient.
ranged between 74.1% (DL vs. II, 95% confidence interval:
66.6%–80.6%) and 92.6% (II vs. LC-MS/MS, 87.4%–96.1%).
The lowest mean κ value was obtained for DL vs. II (0.388), and the highest for AA vs. DL (0.757). The low 95% confi- dence limits of these values correspond to minimum PA’s of 56.2% and 82.7%, respectively (Figure 3).
The 95% PA confidence intervals showed a close agreement with those obtained by transforming Cohen’s κ values into MPA, except for method pairs including II (Figure 3). Increasing the number of samples involved resulted in negligible changes in the PA values from a low, although method-dependent, sample size onwards. The diagrams which illustrate the consistency of PA scores from n = 100 are provided as Supplementary Material.
The symmetry of the disagreement in the clinical classification of results, along with their statistical sig- nificance, is shown by Figure 4. The data indicate that in Figure 2: Bar chart of the proportions of 25-hydroxyvitamin D results lower (dark sections) or higher (light sections) than 20 ng/mL obtained using the various testing methods.
See the Materials and methods section for the full identification of the assays.
Figure 3: Box plots displaying the percentage agreements (means and 95% confidence intervals, blue) and the minimum percentage agree- ments obtained by transforming the calculated Cohen’s κ values statistics (means and 95% confidence intervals, green) using Monte-Carlo simulation.
See the Materials and methods section for the full identification of the assays.
many combinations either of the two methods was signifi- cantly more likely to deliver positive results.
Discussion
Information on assay performance is highly valuable for clinical laboratories and clinicians, whether transferring to a new method or comparing test results coming from different laboratories for decision making. In contrast to method evaluation comprising part of the validation process or pre-marketing studies which require the dem- onstration of assay properties against those of an estab- lished reference method with an emphasis on analytical characteristics, comparison studies conducted in a clini- cal context should focus on the clinical concordance of the assays. A typical setup is the evaluation of a candidate assay versus the method in use on a sample size that can be run within an acceptable framework of costs and time.
In this study, the experimental setup was intended to simulate method comparison in the clinical environment as described above. To this end, both the analytical and the clinical performance of the involved testing methods was compared on a medium-sized sample set. No refer- ence method was used, instead, all of the pairwise combi- nations of the involved assays were compared.
The Passing-Bablok regressions, Bland-Altman analy- ses and the CCC values consistently demonstrated the lack of acceptable agreement in the analytical performance of the assays involved (Table 3). In the Passing-Bablok analyses, 1 and 0 fell within the 95% confidence interval of the slope and the intercept, respectively, for only four method pairs (AA vs. BA, AA vs. SA, BA vs. SA and II vs.
LC-MS/MS). The confidence intervals were broad, and the correlation coefficients were by far beneath the limit of acceptability (r = 0.975 according to [27]). The Bland- Altman analyses revealed small ( < 10%) biases in many comparisons, but the limits of agreement were unaccept- ably wide in all cases. These findings are similar to those observed by others when these assays were compared to reference methods [28–30].
Despite the poor analytical agreement, the PA was high for all method pairs and within a narrow range (79.0%–89.5%) after excluding the two extreme values (Figure 3). These percentages indicate that the overall clinical concordance is predictable and, for several assay pairs, acceptable. A closer look also reveals, however, two- or even threefold differences in the proportions of positive results obtained using some of the methods (Figure 2).
In addition, McNemar’s tests indicated a high degree of asymmetry in the disagreement through significant differ- ences for 14 of the 21 method combinations, with “false positives” (results found to be lower than 20 ng/mL by one method of a pair) being obtained exclusively by one of the methods in six combinations.
Cohen’s κ is the only statistical tool employed in earlier publications to compare the clinical performance of the currently available 25OHD testing methods, never- theless, its use has been criticized [31]. Figure 3 shows that PA and MPA values are in close agreement for the method pairs except those including II for which the MPA scores
are substantially lower. The latter can be attributed to the small number of positive results and the consequently increased range of uncertainty obtained using the II assay.
These results indicate that at medium sample size the PA can be used as a valid statistic to predict the degree of agreement, providing an alternative to Cohen’s κ statistic or the derived MPA. Because the variable underlying the PA follows a binomial distribution (agreement/disagree- ment), the PA statistics are relatively insensitive to sample sizes except when smaller samples sets are used. In con- trast, Cohen’s κ statistics and, especially, their standard deviations are very sensitive to the sample size [32, 33].
The chance of the biased interpretation of the PA, a well understood indicator, is predictably smaller than that of Cohen’s κ which, in the comparison of 25OHD assays, has been interpreted consistently using arbitrary thresholds and a vague judgement terminology (“good”, “fair”, etc).
PA scores obtained in independent studies can also be compared efficiently which is a considerable challenge regarding the κ statistics due, again, to its dependence on the sample size and on the specific values in the contin- gency tables.
The results of our study demonstrate that DL delivers significantly more 25OHD results lower than 20 ng/mL than the rest of the assays. Similarly, a significantly lower proportion of these results is obtained using LC-MS/MS and by far the lowest using II. On the other hand, all com- binations of AA, BA, RE and SA are similar in their clinical Figure 4: Bar charts illustrating the asymmetry of method disagreement by displaying the proportions of samples assayed lower than 20 ng/mL by only one of the methods within a method pair.
The asterisks indicate a significant disagreement in the clinical classifications of results (p < 0.05). See the Materials and methods section for the full identification of the assays.
concordance including the proportions of sub-cut-off 25OHD concentrations, the PAs and, in line with these, the lack of significant differences in the delivery of posi- tive results.
Three of the methods involved in the study underwent standardization in the VDSP RMP (Table 2). The results of the corresponding Deming regression studies were claimed as 1.01x–2.87, 0.94x+1.34 and 0.93x+2.89 for BA, II and SA with Pearson’s correlation coefficients of 0.95, 0.92 and 0.99, respectively [34–36]. An interesting finding of the present investigation is that the clinical concordance of the results obtained using these assays did not reflect the impact of the standardization process. The Passing- Bablok regression performed on the BA vs. SA results dem- onstrated an outstanding agreement concerning the slope and the intercept, but, at the same time, a considerable random error component resulting in a correlation coef- ficient of 0.733. This is in line with the negligible bias and the ±47.5% range in the limits of agreement obtained in the Bland-Altman analysis and with the degree of clinical concordance found (Table 3). The results are far worse for the BA vs. II and SA vs. II comparisons both in analytical and clinical respect, with all three error terms (constant, proportional and random) being sizeable, with a substan- tial difference identified in the clinical classification of the assay outputs. These findings yield the conclusion that establishing the traceability of assays in the VDSP RMP does not provide sufficient evidence for the equivalence of the testing methods. While the standardization process is undoubtedly desirable for assay harmonization, the direct comparison of methods, both in analytical and clinical respect, seems inevitable in identifying the consequences of a method transfer or the comparison of results delivered by various assays for making clinical decisions.
Our study is not without limitations. First, patient samples were not selected and may include ones with matrix interferences with a selective impact on the results obtained using the various assays. Second, samples had been frozen for a prolonged period which, although 25OHD levels were re-assayed after 12 months and showed no sign of degradation in the patient samples, might have given rise to interferences not typically encountered with freshly assayed specimens. Finally, the employed LC-MS/
MS method was validated but not standardized to the VDSP RMP, has not been tested in an external quality assessment scheme and does not resolve epimers from the 25OHD metabolites. Although none of the specimens had been taken from infants under 1 year of age, encoun- tering substantial positive bias in some of the samples due to the presence of the 25OHD3 epimer could not be excluded.
Conclusions
The direct comparison of the analytical and clinical per- formance of 25OHD assays remains important in the clini- cal setting. The ratio of positive samples, the PA and the symmetry of disagreement as judged by hypothesis testing are together effective for comparing the clinical perfor- mance of 25OHD assays. Transferring to a new method is likely to lead to a detectable change in the 25OHD levels observed in specific patients. The asymmetry of disagree- ment should therefore be taken into consideration before changing the clinical classification of the vitamin D status. Finally, the interpretation of Cohen’s κ values can be improved if transformed into MPA.
Author contributions: All the authors have accepted responsibility for the entire content of this submitted manuscript and approved submission.
Research funding: The study was supported by grant ED_14-1-2014-0002.
Employment or leadership: None declared.
Honorarium: None declared.
Competing interests: The funding organization(s) played no role in the study design; in the collection, analysis, and interpretation of data; in the writing of the report; or in the decision to submit the report for publication.
References
1. LeBlanc ES, Zakher B, Daeges M, Pappas M, Chou R. Screening for vitamin D deficiency: a systematic review for the U.S. Preven- tive Services Task Force. Ann Intern Med 2015;162:109–22.
2. Cashman KD, Dowling KG, Skrabáková Z, Gonzalez-Gross M, Valtuena J, de Henauw S, et al. Vitamin D deficiency in Europe:
pandemic? Am J Clin Nutr 2016;103:1033–44.
3. Moreau E, Bächer S, Mery S, Le Goff C, Piga N, Vogeser M, et al.
Performance characteristics of the VIDAS® 25-OH Vitamin D Total assay – comparison with four immunoassays and two liquid chromatography-tandem mass spectrometry methods in a multi- centric study. Clin Chem Lab Med 2016;54:45–53.
4. Saleh L, Mueller D, von Eckardstein A. Anaytical and clinical performance of the new Fujirebio 25-OH vitamin D assay, a com- parison with liquid chromatography-tandem mass spectrometry (LC-MS/MS) and three other automated assays. Clin Chem Lab Med 2016;54:617–25.
5. LeGoff C, Cavalier E, Souberbielle J-C, González-Antuña A, Delvin E. Measurement of circulating 25-hydroxyvitamin D: a historical review. Practical Lab Med 2015;2:1–14.
6. Robinson S, Canavan M, O’Donnell MJ, Mulkerrin E. Vitamin D supplementation – clarity required regarding treatment regimens and target plasma levels. Q J Med 2014;107:327–9.
7. LeFevre ML. Screening for vitamin D deficiency in adults: U.S:
Preventive Services Task Force recommendation statement. Ann Intern Med 2015;162:133–40.
8. Cavalier E, Lukas P, Crine Y, Peeters S, Carlisi A, Le Goff C, et al.
Evaluation of automated immunoassays for 25(OH)-vitamin D determination in different critical populations before and after standardization of the assays. Clin Chim Acta 2014;431:60–5.
9. Braun A, Chang D, Mahadevappa K, Gibbons FK, Liu Y, Giovaucci E, et al. Association of low serum 25-hydroxyvitamin D levels and mortality in the critically ill. Crit Care Med 2011;39:671–7.
10. Mansbach JM, Ginde AA, Camargo CA. Serum 25-hydroxyvitamin D levels among US children aged 1 to 11 years: do children need more vitamin D? Pediatrics 2009;124:1404–10.
11. Earthman CP, Beckman LM, Masodkar K, Sibley SD. The link between obesity and low circulating 25-hydroxyvitamin D con- centrations: considerations and implications. Int J Obes (Lond) 2012;36:387–96.
12. Wyness SP, Straseski JA. Performance characteristics of six automated 25-hydroxyvitamin D assays: mind your 3s and 2s.
Clin Biochem 2015;48:1089–96.
13. Thienpont LM, Stepman HC, Vesper HW. Standardization of measurements of 25-hydroxyvitamin D3 and D2. Scand J Clin Lab Invest Suppl 2012;243:41–9.
14. Binkley N, Sempos CT. Standardizing vitamin D assays: the way forward. J Bone Mineral Res 2014;29:1709–14.
15. Carter GD. Accuracy of 25-hydroxyvitamin D assays: confronting the issues. Current Drug Targets 2011;12:19–28.
16. Janssen MJ, Wielders JP, Bekker CC, Boesten LS, Buijs MM, Heijboer AC, et al. Multicenter comparison study of current methods to measure 25-hydroxyvitamin D in serum. Steroids 2012;77:1366–72.
17. Bedner M, Lippa KA, Tai SS. An assessment of 25-hydroxyvita- min D measurements in comparability studies conducted by the Vitamin D Metabolites Quality Assurance Program. Clin Chim Acta 2013;426:6–11.
18. Simpson CA, Cusano AM, Bihuniak J, Walker J, Insogna KL.
Effect of 25(OH) vitamin D reference method procedure (RMP) alignment on clinical measurements obtained with the IDS-iSYS chemiluminescent-based automated analyzer. J Steroid Biochem Mol Biol 2015;148:41–6.
19. van den Ouweland JM, Beijers AM, Demacker NM, van Daal H.
Measurement of 25-OH-vitamin D in human serum using liquid chromatography tandem-mass spectrometry with comparison to radioimmunoassay and automated immunoassay. J Chromatogr B 2010;878:1163–8.
20. de Koning L, Al-Turkmani MR, Berg AH, Shkreta A, Law T, Kelogg M. Variation in clinical vitmin D status by DiaSorin Liaison and LC-MS/MS in the presence of elevated 25-OH vitamin D2. Clin Chim Acta 2013;415:54–8.
21. Koivula MK, Matinlassi N, Laitinen P, Risteli J. Four automated 25-OH total vitamin D immunoassays and commercial liquid chromatography tandem-mass spectrometry in Finnish popula- tion. Clin Lab 2013;59:397–405.
22. Cavalier E, Rousselle O, Ferrante N, Carlisi A, Le Goff C, Souberbielle JC. Technical and clinical evaluation of the
VITROS® Immunodiagnostic Products 25-OH Vitamin D Total assay – comparison with marketed automated immunoas- says and a liquid chromatography-tandem mass spectrometry method. Clin Chem Lab Med 2013;51:1983–9.
23. Moon HW, Cho JH, Hur M, Song J, Oh GY, Park CM, et al. Compari- son of four current 25-hydroxyvitamin D assays. Clin Biochem 2012;45:326.
24. Holmes EW, Garbincius J, McKenna KM. Analytical variability among methods for the measurement of 25-hydroxyvitamin D.
Am J Clin Pathol 2013;140:550–60.
25. Lippi G, Salvagno GL, Fortunato A, Dipalo M, Aloe R, Da Rin G, et al. Multicenter comparison of seven 25OH vitamin D auto- mated immunoassays. J Med Biochem 2015;34:344–50.
26. R Development Core Team (2008). R: a language and environ- ment for statistical computing. R Foundation for Statistical Computing, Vienna, Austria. ISBN 3-900051-07-0. Available at:
http://www.R-project.org.
27. Stöckl D, Dewitte K, Thienpont LM. Validity of linear regression in method comparison studies: is it limited by the statistical model or the quality of the analytical input data? Clin Chem 1998;44:2340–6.
28. Freeman J, Wilson K, Spears R, Shalhoub V, Sibley P. Perfor- mance evaluation of four 25-hydroxyvitamin D assays to meas- ure 25-hydroxyvitamin D2. Clin Biochem 2015;48:1097–104.
29. Wielders JP, Carter GF, Eberl H, Moris G, Roth HJ, Vogl C. Auto- mated competitive protein-binding assay for total 25-OH vitamin D, multicenter evaluation and practical performance. J Clin Lab Anal 2015;29:451–61.
30. Li L, Zeng Q, Yuan J, Xie Z. Performance evaluation of two immunoassays for 25-hydroxyvitamin D. J Clin Biochem Nutr 2016;58:186–92.
31. Banerjee M. Beyond kappa: a review of interrater agreement measures. Canadian J Stat 1999;27:3–23.
32. Nofuentes JA, del Castillo JD. Comparing two binary diagnostic tests in the presence of verification bias. Comput Stat Data Anal 2006;50:1551–64.
33. Sim J, Wright CC. The Kappa statistic in reliability studies:
use, interpretation, and sample size requirements. Phys Ther 2005;85:257–68.
34. 510(k) Substantial Equivalence Determination Decision Sum- mary k142373. U.S. Food and Drug Administration, 22 December 2014.
35. 510(k) Substantial Equivalence Determination Decision Sum- mary k140554. U.S. Food and Drug Administration, 19 December 2014.
36. 510(k) Substantial Equivalence Determination Decision Sum- mary k133156. U.S. Food and Drug Administration, 24 July 2014.
Supplemental Material: The online version of this article (DOI:
10.1515/cclm-2016-0536) offers supplementary material, available to authorized users.