Research Article
Modulation of Mitochondrial Quality Control Processes by BGP- 15 in Oxidative Stress Scenarios: From Cell Culture to
Heart Failure
Orsolya Horvath ,1,2Katalin Ordog ,1,2Kitti Bruszt ,1,2Nikoletta Kalman ,3 Dominika Kovacs ,3Balazs Radnai ,3Ferenc Gallyas ,2,3,4Kalman Toth ,1,2 Robert Halmosi ,1,2and Laszlo Deres 1,2,4
11st Department of Medicine, University of Pecs, Medical School, Pecs, Hungary
2Szentágothai Research Centre, University of Pecs, Pecs, Hungary
3Department of Biochemistry and Medical Chemistry, University of Pecs, Medical School, Pecs, Hungary
4HAS-UP Nuclear-Mitochondrial Interactions Research Group, 1245 Budapest, Hungary
Correspondence should be addressed to Laszlo Deres; deres.laszlo@pte.hu
Received 4 November 2020; Revised 15 January 2021; Accepted 9 February 2021; Published 28 February 2021
Academic Editor: Hao Zhou
Copyright © 2021 Orsolya Horvath et al. This is an open access article distributed under the Creative Commons Attribution License, which permits unrestricted use, distribution, and reproduction in any medium, provided the original work is properly cited.
Heart failure (HF) is a complex chronic clinical disease characterized by among others the damage of the mitochondrial network.
The disruption of the mitochondrial quality control and the imbalance in fusion-fission processes lead to a lack of energy supply and, finally, to cell death. BGP-15 (O-[3-piperidino-2-hydroxy-1-propyl]-nicotinic acid amidoxime dihydrochloride) is an insulin sensitizer molecule and has a cytoprotective effect in a wide variety of experimental models. In our recent work, we aimed to clarify the mitochondrial protective effects of BGP-15 in a hypertension-induced heart failure model and“in vitro.” Spontaneously hypertensive rats (SHRs) received BGP-15 or placebo for 18 weeks. BGP-15 treatment preserved the normal mitochondrial ultrastructure and enhanced the mitochondrial fusion. Neonatal rat cardiomyocytes (NRCMs) were stressed by hydrogen-peroxide. BGP-15 treatment inhibited the mitochondrial fission processes, promoted mitochondrial fusion, maintained the integrity of the mitochondrial genome, and moreover enhanced the de novo biogenesis of the mitochondria. As a result of these effects, BGP-15 treatment also supports the maintenance of mitochondrial function through the preservation of the mitochondrial structure during hydrogen peroxide-induced oxidative stress as well as in an“in vivo”heart failure model. It offers the possibility, which pharmacological modulation of mitochondrial quality control under oxidative stress could be a novel therapeutic approach in heart failure.
1. Introduction
Several studies have demonstrated that mitochondria, the powerhouse of cells are damaged in heart failure as well as in hypertension-induced cardiac remodelling [1–3]. The bal- ance of fusion andfission processes that regulate mitochon- drial dynamics is essential for maintaining energy production [4, 5]. The most important fusion proteins in the regulation of mitochondrial dynamics are the optic atro- phy 1 (OPA1) and the mitofusin 1 and 2 (MFN1, MFN2)
proteins, while thefission processes of mitochondria are con- trolled by dynamin-related protein 1 (DRP1) [6–8].
In heart failure due to the increased ROS production,fis- sion processes become predominant, resulting in fragmented mitochondrial network, which is unable to perform its func- tion of providing energy to the cell; thereby, mitochondrial fragmentation can induce cell death [2, 4, 9, 10]. The subject of numerous researches is the regulation of mitochondrial dynamics as a new therapeutic target in cardiovascular dis- eases [6, 11–14].
Volume 2021, Article ID 6643871, 22 pages https://doi.org/10.1155/2021/6643871
BGP-15 (O-[3-piperidino-2-hydroxy-1-propyl]-nico- tinic acid amidoxime dihydrochloride) is an insulin sensitizer molecule and has a cytoprotective effect in a wide variety of experimental models (Figure 1). BGP-15 protects against oxi- dative stress [15–17], promotes mitochondrial fusion [18], inhibits the mitogen-activated protein kinase (MAPK) acti- vation [19–22], and improves cardiac function [21–23], but its specific intracellular target is still unknown.
This study was aimed to further characterize the mito- chondrial effects of BGP-15 in a chronic hypertension- induced heart failure animal model and “in vitro” using primer neonatal rat cardiomyocytes (NRCM). We studied the effect of BGP-15 on the processes of mitochondrial qual- ity control, particularly on fusion-fission processes, on mito- chondrial biogenesis as well as on mitochondrial function.
2. Materials and Methods
2.1. Ethics Statement.Animals received care according to the Guide for the Care and Use of Laboratory Animals published by the US National Institute of Health and the experiment was approved by the Animal Research Review Committee of the University of Pecs, Medical School (Permit number:
BA02/2000-54/2017).
2.2. Animal Model.15-month-old male Wistar Kyoto (WKY) and spontaneously hypertensive rats (SHR) (Charles River Laboratories, Budapest, Hungary) were used. Two animals were housed per cage under standardized conditions throughout the experiment, with 12 hours of dark-light cycle in solid-bottomed polypropylene cages and received com- mercial rat chew and water ad libitum. 8 of the 24 animals were sacrificed at the beginning of the experiment, as a base- line (SHR-Baseline). The surviving 16 SHRs were randomly divided into two groups: SHR-B and SHR-C. SHR-B group was treated with the water-soluble BGP-15 (25 mg/b.w. in kg/day, n= 8), while SHR-C group received only placebo (n= 8, SHR-C) per os for 18 weeks. BGP-15 was a gift from N-Gene Inc. (New York, NY, USA). The dosage of BGP-15 administered in the drinking water was based on preliminary data about the volume of daily water consumption. WKY rats were used as age-matched controls (n= 8). At the end of the 18-week long treatment period, animals were sacrificed, and blood was collected to determine the concentration of plasma brain-derived natriuretic peptide (BNP). Hearts were removed, atria and great vessels were trimmed from the ven- tricles, and the weight of the ventricles was measured; then, it was normalized to the body mass and to the length of the
right tibia (indices of cardiac hypertrophy). Hearts werefixed in modified Kranovsky fixative for transmission electron microscopy or freeze-clamped for Western blot analysis.
The levels of proteins which are involved in the processes of mitochondrial dynamics and biogenesis were monitored by Western blot analysis. In our research, the following group notations were used according to the applied treatment:
WKY: age-matched normotensive Wistar Kyoto rats; SHR- Baseline: 15-month-old spontaneously hypertensive rats;
SHR-C: 19-month-old spontaneously hypertensive rats received placebo for 18 weeks; SHR-B: 19-month-old sponta- neously hypertensive rats received BGP-15 for 18 weeks.
2.3. Neonatal Rat Cardiomyocyte (NRCM) Cell Culture.Car- diomyocytes were isolated using the Pierce™Primary Car- diomyocyte Isolation Kit (Life Technologies, Carlsbad, CA, USA #88281) from 1-3-day-old neonatal Wistar rats. The animals were sacrificed, and then, their hearts were removed and minced into 1-3 mm3 pieces. The pieces were digested with an enzyme complex (Cardiomyocyte Isolation Enzyme 1 (with papain) and Cardiomyocyte Isolation Enzyme 2 (with thermolysin)). After the tissue became primarily a single- cell suspension, the cells had been plated in 6-well plates with a density of2:5 × 10⁶cell/well with specific Dulbecco’s Modified Eagle Medium (DMEM) for Primary Cell Isola- tion containing 10% fetal bovine serum (FBS), 100 IU/mL penicillin and 100μg/mL streptomycin. The medium was replaced 24 hours later with fresh Complete DMEM for Pri- mary Cell Isolation containing Cardiomyocyte Growth Sup- plement, which inhibited the division of fibroblasts and therefore maintained the cardiomyocyte suspension in high purity during the culture period. NRCMs were cultivated in normal culture conditions, 37°C, saturated humidity atmo- sphere of 95% air and 5% CO2. Fresh medium was added every 2-3 days.
2.4. Treatments of Neonatal Rat Cardiomyocytes.On the day of the experiments, cells were washed once in PBS and added fresh medium and, then, treated with 150μM H2O2with or without 50μM BGP-15 for 0.5 hours. The following groups were created according to the applied treatment: Control group: cells without any treatment; BGP-15 group: cells with only 50μM BGP-15 for 0.5 hours; H2O2 group: cells with 150μM H2O2for 0.5 hours; H2O2+BGP-15 group: cells with 150μM H2O2and 50μM BGP-15 for 0.5 hours.
2.5. Determination of Plasma B-Type Natriuretic Peptide Level. Blood samples were collected into Vacutainer tubes containing EDTA and aprotinin (0.6 IU/ml) and centrifuged at 1600 g for 15 minutes at 4°C to separate plasma, which was collected and kept at −70°C. Plasma B-type natriuretic peptide-32 levels (BNP-32) were determined by Enzyme- Linked Immunosorbent Assay method (BNP-32, Rat BNP 32 ELISA Kit, Abcam, ab108815CA, USA) as the datasheet recommends.
2.6. Transmission Electron Microscopy.For electron micros- copy analysis, hearts were perfused retrogradely through the aortic root with ice-cold PBS to wash out the blood and then with modified Kranovsky fixative (2% paraformaldehyde,
N
NH2 CH2 BGP-15
+2HCL
CH2 N CH
OH
N O
C
Figure 1: Chemical structure of BGP-15 (O-[3-piperidino-2- hydroxy-1-propyl]-nicotinic acid amidoxime dihydrochloride) [24].
2.5% glutaraldehyde, 0.1 M Na-cacodylate buffer, pH 7.4, and 3 mM CaCl2). 1 mm thick sections were cut from the free wall of the left ventricle. Dehydrated blocks were embedded in Durcupan resin. From the embedded blocks, semithin sections of 500 nm and ultrathin sections of 50 nm were cut with a Leica ultramicrotome and mounted either on mesh or on Collodion-coated (Parlodion, Electron Microscopy Sciences, Fort Washington, PA) single-slot, copper grids. Additional contrast was provided to these sections with uranyl acetate and lead citrate solutions, and the preparations were exam- ined with a JEOL 1200EX-II electron microscope. 4 animals from each group, 3–5 blocks from each animal were used.
The area of the interfibrillar mitochondria (IFM) was mea- sured by freehand polygon selection (n~500/group) using the ImageJ software.
2.7. Western-Blot Analysis
2.7.1. Total Western Blot Sample Preparation from Cardiac Tissue. 50 milligrams of heart samples were homogenized in ice-cold Tris buffer (50 mmol/l, pH 8.0) containing prote- ase inhibitor (1 : 100; Sigma-Aldrich Co., #P8340) and phos- phatase inhibitor (1 : 100; Sigma-Aldrich Co., #P5726) and 50 mM sodium vanadate. The supernatants were harvested in 2x concentrated sodium dodecyl sulfate- (SDS-) polyacryl- amide gel electrophoresis sample buffer.
2.7.2. Fractionated Western Blot Sample Preparation from Cardiac Tissue.100 milligrams of heart tissues were minced in ice-cold isolation solution (150 mM NaCl, 50 mM TRIS, and 1 mM EDTA), protease inhibitor (1 : 100; Sigma- Aldrich Co., #P8340), and phosphatase inhibitor (1 : 100;
Sigma-Aldrich Co., #P5726)). Samples were disrupted on ice with gently Turrax and, then, processed in a Potter- Elvehjem tissue homogenizer. Samples were centrifuged for 12 minutes at 750 g. Supernatants containing the cyto- solic and mitochondrial fractions were aspirated and the precipitated nuclear fractions were harvested in 2x SDS–
polyacrylamide gel electrophoresis sample buffer and dena- tured at 95°C for 5 minutes. Supernatants were then cen- trifuged for 12 minutes at 11.000 g to gain cytosolic fraction in the supernatant and mitochondrial fraction in
the precipitate. Samples were harvested separately in 2x SDS–polyacrylamide gel electrophoresis sample buffer and denatured at 95°C for 5 minutes.
2.7.3. Total Western-Blot Sample Preparation from NRCM Cell Culture. After the appropriate treatment, cells were harvested. The cell pellet was suspended in ice-cold PBS buffer and, then, centrifuged for 5 min at 1,200 rpm at room temperature. The pellets were suspended in 300μL NP-40 lysis buffer (Amresco, J619) containing protease inhibitor (1 : 100; Sigma-Aldrich Co., #P8340) and phos- phatase inhibitor (1 : 100; Sigma-Aldrich Co., #P5726).
The samples were shaken for 30 min at 4°C; then, they were centrifuged for 20 min (4°C 12,000 rpm). 4x concen- trated SDS-polyacrylamide gel electrophoresis sample buffer was added to each sample.
2.7.4. Fractionated Western Blot Sample Preparation from NRCM Cell Culture. The cell pellet was suspended in an ice-cold isolation solution (0.5 mM TRIS, 1 M EGTA, and 0.4 M sucrose) containing 0.5 mM sodium metavanadate, 0.05 M EDTA, and protease inhibitor (1 : 100; Sigma- Aldrich Co., #P8340). Samples were disrupted on ice by Tur- rax and, then, processed by a Potter-Elvehjem tissue homog- enizer. Centrifugation was carried out for 15 minutes at 750 g. The nuclear fraction in the precipitate was harvested in 72% trichloroacetic acid. Subsequently, supernatants were aspirated and centrifuged for 15 minutes at 10.000 g to gain cytosolic fraction in the supernatant and mitochon- drial in the precipitate. Samples were harvested separately in 72% trichloroacetic acid. The precipitated fractions were centrifuged for 10 minutes at 15.000 g. Each precipitate was harvested separately in a 50 mM TRIS and SDS- polyacrylamide gel electrophoresis sample buffer. The sam- ples were shaken for overnight at 4°C and denatured at 95°C for 5 minutes. After that, they were centrifuged for 10 minutes at 15.000 g, and the supernatants were col- lected as the mitochondrial fraction.
2.7.5. Electrophoresis and Transfer of Proteins.After the prep- aration, the tissue and cell culture samples were processed in the same manner. Protein levels were measured with Table1: Effect of BGP-15 administration on gravimetric parameters and on BNP level of SHR animals.
WKY SHR-C SHR-B
BWSTART(g) 391:51 ± 8:64 340:66 ± 6:74∗ 347:4 ± 10:38∗
BWEND(g) 403:22 ± 10:35 352:13 ± 6:86∗ 365:29 ± 6:82∗
HWEND(g) 1:11 ± 0:03 1:41 ± 0:03∗∗ 1:28 ± 0:02∗∗,#
VWEND(g) 0:98 ± 0:03 1:27 ± 0:02∗ 1:12 ± 0:02∗
VW/BWEND(mg/g) 2:43 ± 0:07 3:60 ± 0:04∗ 3:07 ± 0:09∗,#
VW/TLEND(mg/mm) 21:43 ± 0:71 29:14 ± 0:39∗ 24:81 ± 0:53∗,#
p-BNP (pg/ml) 302:76 ± 13:77 755:15 ± 33:34∗ 352:05 ± 22:50#
BWSTART: body weight at the beginning of the treatment; BWEND: body weight at the end of the treatment; HWEND: heart weight at the end of the treatment;
VWEND: ventricles weight at the end of the treatment; TLEND: length of right tibia at the end of the treatment; p-BNP: plasma brain-type natriuretic peptide.
Values aremeans + SEM. WKY: age-matched normotensive Wistar-Kyoto rats,n= 8, SHR-C: nontreated spontaneously hypertensive rats,n= 8, SHR-B:
spontaneously hypertensive rats receiving BGP-15 for 18 weeks,n= 8.∗p< 0:05vs. WKY,∗∗p< 0:01vs. WKY,#p< 0:05vs. SHR-C.
Nanodrop. Glyceraldehyde 3-phosphate dehydrogenase (GAPDH; 1 : 1000; Cell Signaling #2118) and pyruvate dehy- drogenase (PDC; 1 : 1000; Cell Signaling #3205) were used as a representative loading control. Proteins were separated on 12% SDS-polyacrylamide gel and transferred to nitrocellu- lose membranes. After blocking (2 h with 5% BSA in Tris- buffered saline contained with 1% Tween-20), membranes were probed overnight at 4°C with primary antibodies recog- nizing the following antigens: optic atrophy 1 (OPA1;
1 : 1000; Cell Signaling #80471), mitofusin-1 (MFN1;
1 : 1000; Abcam ab57602), mitofusin-2 (MFN2; 1 : 1000; Cell Signaling #9482), dynamin-related protein 1 (DRP1; 1 : 1000;
Cell Signaling #8570), phosphor-specific DRP1 Ser637 (1 : 500; Cell Signaling #4867), phosphor-specific DRP1 Ser616 (1 : 500; Cell Signaling #3455), voltage-dependent anion channel (VDAC; 1 : 1000; Cell Signaling #4661), mito- chondrialfission 1 protein (FIS1; 2μg/mL, Abcam, ab71498), peroxisome proliferator-activated receptor gamma coactiva- tor 1-alpha (PGC-1α; 1 : 1000; Novus Biologicals, NBP1- 04676), cAMP response element-binding protein (CREB;
1 : 1000; Cell Signaling #4820), phosphor-specific cAMP response element-binding protein Ser133 (1 : 1000; Cell Sig- naling #9198), anti-NADH dehydrogenase Fe-S protein 1 (NDUFs1, Novus Biologicals, NBP1-31142, 1 : 1000), and anti-Ubiquinol-cytochrome c reductase core protein I (UQCRC1, Novus Biologicals, NBP2-03825, 1 : 1000).
Membranes were washed six times for 5 min in Tris- buffered saline (pH 7.5) containing 0.2% Tween (TBST) before the addition of horseradish peroxidase-conjugated secondary antibody (goat anti-rabbit IgG, Sigma Aldrich Co. A0545, 1 : 3000 dilution; rabbit anti-mouse IgG, Sigma
Aldrich Co., A9044, 1 : 5000 dilution). Membranes were washed six times for 5 min in TBST, and then, the antibody-antigen complexes were visualized by enhanced chemiluminescence. The results of Western blots were quantified using the NIH ImageJ program.
2.8. Capillary Electrophoresis Immunoassay.Due to the lim- ited availability of primary neonatal cardiomyocytes and the lower protein concentration of the fractionated samples made from it, the more sensitive capillary immunoassay method with less sample requirements and higher through- put is more suitable for measurement. Simple western analy- sis (Wes) was performed on a Wes system (ProteinSimple, product number 004–600) according to the manufacturer’s instructions using a 12-230 kDa Separation Module (Protein- Simple SM-W004) and either the Anti-Rabbit Detection Module (ProteinSimple DM-001) or the Anti-Mouse Detec- tion Module (ProteinSimple DM-002), depending on the pri- mary used antibody. Subcellular NRCM samples were mixed with Fluorescent Master Mix and heated at 95°C for 5 min.
The samples, blocking reagent (antibody diluent), primary antibodies (in antibody diluent), HRP-conjugated secondary antibodies, and chemiluminescent substrate, were pipetted into the plate (part of Separation Module). Instrument default settings were used: stacking and separation at 475 V for 30 min; blocking reagent for 5 min, primary and second- ary antibody both for 30 min; Luminol/peroxide chemilumi- nescence detection for~15 min (exposures of 1-2-4-8-16-32- 64-128-512 s). The resulting electropherograms were inspected to check whether automatic peak detection required any manual correction.
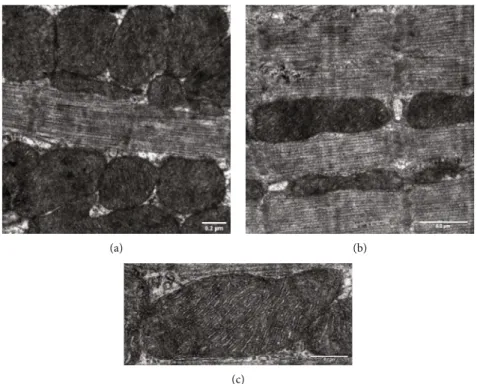
(a) (b)
(c)
Figure2: Ultrastructural analysis of interfibrillar mitochondria in the myocardium of WKY animals. Representative electron micrographs of interfibrillar mitochondria in the myocardium of (a, b) WKY animals ((a) magnification: 15 k, scale bar: 0.2μm; (b) magnification: 20 k, scale bar: 0.2μm). Ultrastructure of interfibrillar mitochondria in the myocardium of (c) WKY animals (magnification: 40 k, scale bar: 0.1μm (n= 4from each group, 3–5 blocks from each animal). WKY: age-matched normotensive Wistar-Kyoto rats.
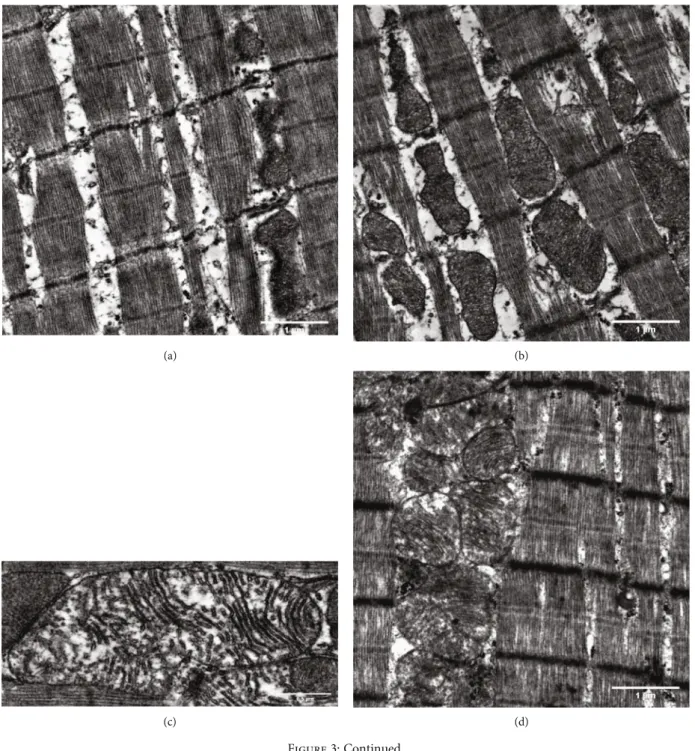
(a) (b)
(c) (d)
Figure3: Continued.
2.9. Evaluation of Mitochondrial Fragmentation with Fluorescent Microscopy.NRCM cells were seeded at a density of 105cells/well in 6 well plates on glass coverslips with 1%
gelatin coating and cultured at least for 2 days before the experiment. On the day of the experiment, cells were washed once in PBS and added fresh medium and, then, treated with H2O2with or without BGP-15. After the appropriate treat- ment, coverslips were rinsed in PBS and were added 75 nM MitoTracker Red CMXRos dissolved in serum-free DMEM and incubated for 30 min at 37°C. After the incubation, cov- erslips were rinsed in PBS, and the mitochondrial network was visualized by a Nikon Eclipse Ti-U fluorescent micro- scope equipped with a Spot RT3 camera using a 60x objective and epifluorescent illumination.
2.10. Quantification of Mitochondrial DNA (mtDNA) Damage by Real-Time PCR.After the appropriate treatment, cells were harvested, and total DNA was isolated using Gen- Elute™Mammalian Genomic DNA Miniprep Kits (Sigma- Aldrich # G1N350-1KT). Real-time DNA amplification was performed using a CFX96 Touch Real-Time PCR Detection System (Bio-Rad) as we performed earlier [25]. The following rat primer sequences were used: SRPCR (210 bp) forward: 5′
-ATGCACGATAGCTAAGACCCAA-3′; reverse: 5′-CTGA ATTAGCGAGAAGGGGTA-3′ and LRPCR (14958 bp) for- ward: 5′-ATTTTCTCCCAGTTACGAAAG-3′, reverse: 5′ -CTTGGTAAGTAAATTTCTTTCTCC-3′. Short fragment, cytochrome c oxidase subunit 1 (COX1), cytochrome c oxi- dase subunit 3 (COX3), andβ-actin were done using a Bril- liant II QPCR Master Mix (Agilent Technologies, # 600804).
Thefinal SRPCR, COXI, COXIII, andβ-actin cycling param- eters followed hot start of 10 min at 95°C, followed by 30 sec at 95°C, 1 min at 60°C, and 30 sec at 72°C for 40 cycles. LRPCR was done using PfuUltra II Hotstart 2x Master Mix (Agilent Technologies, #600852). Thefinal LRPCR cycling parameters followed manufacturer’s recommendations: hot start of 2 min at 92°C, followed by 15 sec at 92°C, 30 sec at 50°C, and 8 : 00 min at 68°C for 40 cycles. The relative mitochondrial DNA content was determined by real-time PCR, using COX1 and COX3 primers, normalized to a nuclear-encoded β-actin gene. The following rat primer sequences were used:
COX1 (199 bp) forward: 5′-CACAGTAGGGGGCCTA ACAG-3′, reverse: 5′-CAAAGTGGGCTTTTGCTCAT-3′;
COX3 (244 bp) forward 5′-TCAGGAGTCTCAATTA CATG-3′, reverse: 5′-CGTAGTAGACAGACAATTAGG- 3′; β-actin (191 bp) forward 5′-GCGGTGACCATAGCCC TCTTT-3′, reverse: 5′-TGCCACTCCCAAAGTAAAGGG TCA-3′. The software automatically generated crossing points and calculation of mtDNA damage was made using theΔ2Ctmethod. EvaGreen dye was used (Biotium # 31000).
2.11. Mitochondrial Membrane Potential Measurement with JC-1 Assay.The mitochondrial membrane potential (ΔΨm) was measured using the mitochondrial membrane potential specific fluorescent probe, JC-1 (Enzo Life Sciences, ENZ- 52304) as we performed it earlier [25]. NRCM cells were seeded on glass coverslips coated with gelatin and cultured for at least 2 days before the experiment. After the treatment, cells were washed in PBS and incubated for 15 min at 37°C in
(e) (f)
Figure3: Ultrastructural analysis of interfibrillar mitochondria in the myocardium of SHR animals. Representative electron micrographs of interfibrillar mitochondria in the myocardium of (a, b) SHR-C and (d, e) SHR-B animals (magnification: 10 k, scale bar: 1μm). Ultrastructure of interfibrillar mitochondria in the myocardium of (c) SHR-C and (f) SHR-B animals (magnification: 25 k, scale bar: 0.5μm). SHR-C:
nontreated spontaneously hypertensive rats; SHR-B: spontaneously hypertensive rats receiving BGP-15 for 18 weeks (n= 4from each group, 3–5 blocks from each animal).
media containing 5μg/mL JC-1. When excited at 488 nm, the dye emits redfluorescence (590 nm) at highΔΨm and green (530 nm) at lowΔΨm. Following incubation, the cells were washed once with PBS and then imaged with a Nikon Eclipse Ti-Ufluorescent microscope equipped with a Spot RT3 cam- era using a 60x objective and epifluorescent illumination. All experiments were repeated three times. Fluorescent signals were quantified by using the ImageJ software (NIH, Bethesda, MD, USA).
2.12. Evaluation of the Mitochondrial Energy Metabolism and Function.As we described earlier, Agilent Seahorse Extracel- lular Flux (XFp) Analyzer (Agilent Technologies, (Santa Clara, CA, USA)) was used to determine the NRCM cells’
oxygen consumption rate (OCR) [25]. NRCM cells were seeded in XFp Miniplate at a density of4 × 104cells/well in 80μL complete growth medium (DMEM for Primary Cell Isolation containing 10% FBS, 100 IU/mL penicillin and 100μg/mL streptomycin) and incubated at 37°C, 5% CO2
0 10 20 30 40 50 60
0–0.3 0.31–0.6 0.61–0.9 0.91–1.2 1.21–1.5 1.51–1.8 1.81–2.1 >2.11
Relative frequency (%)
Area intervals (𝜇m2) WKY
SHR-C SHR-B
(a)
0,00 0,10 0,20 0,30 0,40 0,50 0,60 0,70
WKY SHR-C SHR-B
§
Mean area (𝜇m2)
⁎
(b)
Figure 4: Heart failure-induced fragmentation of interfibrillar mitochondria in the myocardium. (a) Relative frequencies of measured mitochondrial areas in each arbitrary area interval. (b) Means of area values in given groups (~500 mitochondria/group). WKY: age- matched normotensive Wistar-Kyoto rats; SHR-C: nontreated spontaneously hypertensive rats; SHR-B: spontaneously hypertensive rats receiving BGP-15 for 18 weeks. Data are expressed asmean ± SEM.∗p< 0:05vs. WKY,§p< 0:05vs. SHR-C.
for 2 days. On the day before the experiment, sensor car- tridges were hydrated in XFp calibrant and maintained at 37°C without CO2 overnight. On the day of the assay, after subjecting cells to the appropriate treatment, DMEM for Pri- mary Cell Isolation medium was replaced by Agilent Sea- horse XF Base Medium containing 1 mM pyruvate, 2 mM glutamine, and 10 mM glucose (adjusted pH to 7.4 with 0.1 N NaOH). Before measurement, different compounds were loaded into the appropriate ports of a hydrated sensor cartridge (10μM oligomycin, 10μM FCCP, and 5μM rote- none/antimycin). Three measurements were performed after each injection. OCR was used to determine mitochondrial energy metabolism. The parameter values, including basal respiration, maximal respiration, ATP-associated OCR, and spare respiratory capacity, were determined according to the Seahorse XFp Cell Mito Stress user guide protocol. Data were analyzed using the Seahorse XF test report analysis.
2.13. Analysis of Citrate Synthase Activity in NRCM Cells.
NRCM cells were seeded at a density of 106cells/well in 6- well plates and cultured. After the appropriate treatment, cells were harvested; the cell pellet was suspended in ice- cold citrate synthase cell lysis buffer and, then, centrifuged for 5 min at 4°C at 10,000 x g; then, the supernatant was col- lected for further use. Citrate synthase was measured using a kit from Sigma Aldrich (MAK193) following the manufac- turer’s instruction. The absorbance was recorded at 412 nm
every 5 minutes for 50 minutes. The colorimetric product (GSH) was proportional to the enzymatic activity of citrate synthase and normalized to the quantity of cells.
2.14. Statistical Analysis. Statistical analysis was performed by analysis of variance, and all of the data were expressed as the mean ± SEM. The homogeneity of the groups was tested by F-test (Levene’s test). There were no significant dif- ferences among the groups. Comparisons among groups were made by one-way ANOVA with a post hoc correction (SPSS for Windows, version 21.0). The Student’s t-test was used to compare the mean values of two groups. A value of p< 0:05was considered statistically significant.
3. Results 3.1. In Vivo Results
3.1.1. Effect of BGP-15 Administration on Gravimetric Parameters and on BNP Level.At the beginning of the study, the body weight of WKY rats was significantly higher than the SHR rats (WKY: 391:51 ± 8:64g, SHR-C: 340:66 ± 6:74 g, SHR-B:347:4 ± 10:38g;p< 0:05, WKY vs. SHR groups;
Table 1). Similar observation can be made at the end of the study (WKY: 403:22 ± 10:35g, SHR-C: 352:13 ± 6:86g, SHR-B:365:29 ± 6:82g;p< 0:05 WKY vs. SHR groups). At the end of the study, heart weights (HW) and ventricles
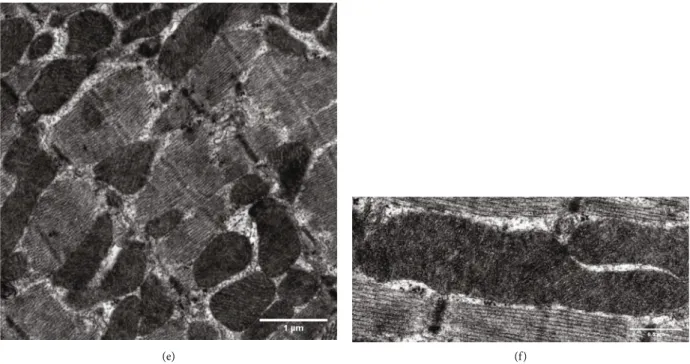
WKY
GAPDH (37 kDa) MFN1 (84 kDa) MNF2 (84 kDa) OPA1 (85-100 kDa)
0 5 10 15 20 25 30 35
WKY SHR-baseline SHR-C SHR-B
Arbitrary units (AU)
0 5 10 15 20 25 30 35
WKY SHR-baseline SHR-C SHR-B
0 5 10 15 20 25 30 35 40
WKY SHR-baseline SHR-C SHR-B
Arbitrary units (AU)
OPA1
MFN1
MFN2
,##
SHR- baseline SHR-C SHR-B Arbitrary units (AU)
⁎⁎ ⁎
⁎⁎,§§
⁎⁎ ⁎⁎ ⁎,## ⁎ ⁎⁎
⁎⁎,§§
Figure5: Effect of BGP-15 treatment on mitochondrial fusion proteins in a hypertension-induced heart failure model. Western blot analysis of OPA1, MFN1, and MFN2 proteins as well as densitometric evaluations is shown. GAPDH was used as a loading control. WKY: age- matched normotensive Wistar-Kyoto rats; SHR-Baseline: 15-month-old spontaneously hypertensive rats; SHR-C: 19-month-old nontreated spontaneously hypertensive rats; SHR-B: 19-month-old spontaneously hypertensive rats receiving BGP-15 for 18 weeks (n= 4).
Values aremean ± SEM.∗p< 0:05vs. WKY,∗∗p< 0:01vs. WKY,##p< 0:01vs. SHR-Baseline,§§p< 0:01vs SHR-C.
weight (VW) were significantly increased in the SHR groups compared to the WKY group (HW: WKY: 1:11 ± 0:03g, SHR-C: 1:41 ± 0:03g, SHR-B: 1:28 ± 0:02g;p< 0:01 SHR-B and SHR-C vs.WKY,p< 0:05SHR-B vs. SHR-C; VW: WKY:
0:98 ± 0:03g, SHR-C: 1:27 ± 0:02g, SHR-B: 1:12 ± 0:02g; p
< 0:05SHR-groups vs. WKY). The ratio of ventricular weight to body weight (VW/BW) was increased markedly in SHR groups compared to WKY animals (VW/BW (mg/g): WKY:
2:43 ± 0:07, SHR-C:3:60 ± 0:04, SHR-B:3:07 ± 0:09;p< 0:01 SHR groups vs. WKY,p< 0:05SHR-B vs. SHR-C). Ventricular weight to the length of right tibia ratio (VW/TL) was also sig- nificantly increased (VW/TL (mg/mm): WKY: 21:43 ± 0:71, SHR-C: 29:14 ± 0:14, SHR-B: 24:81 ± 0:53; p< 0:05 SHR- groups vs. WKY). BGP-15 treatment caused a significant mod- eration of these ratios (p< 0:05SHR-B vs. SHR-C).
By the end of the treatment, the plasma BNP level increased significantly in the SHR-C group compared to the WKY group (BNP (pg/ml): WKY:302:76 ± 13:7684; SHR- C: 755:14 ± 33:34; SHR-B: 352:04 ± 22:50; p< 0:05 vs.
WKY group; Table 1). However, BGP-15 treatment caused a marked reduction of the BNP level in hypertensive animals (p< 0:05, SHR-B vs. SHR-C).
3.1.2. Effect of BGP-15 Administration on Mitochondrial Ultrastructure. Longitudinal sections of the myocardium were evaluated to assess the status of interfibrillar mito- chondria (IFM) by electron microscopy. The mitochondria of SHR-C rats differ from the normal mitochondria of WKY rats (Figures 2(a)–2(c)), because they are morpho- logically more heterogeneous (n= 5 from each group, 3–
5 block from each animal). In the nontreated hypertensive animals (SHR-C), mitochondria were loosely arranged between the contractile elements (Figures 3(a) and 3(b)).
Moreover, in the SHR-C group, extensive disruption of mitochondrial cristae and enlarged intracristal spaces could be observed (Figure 3(c)). Their shape was often elongated, and the mitochondrial matrix was very light.
The mitochondrial ultrastructure in the SHR-B group was
0 0,2 0,4 0,6 0,8 1 1,2 1,4 1,6 1,8
WKY SHR-baseline SHR-C SHR-B 0
5 10 15 20 25 30 35
WKY SHR-baseline SHR-C SHR-B
Arbitrary units (AU) WKY SHR- baseline SHR-C SHR-B
Fis1 (17 kDa) DRP (78-82 kDa)
0 5 10 15 20 25 30 35
WKY SHR-baseline SHR-C SHR-B
Arbitrary units (AU)
0 0,2 0,4 0,6 0,8 1 1,2 1,4
WKY SHR-baseline SHR-C SHR-B
pDRP1 S616/total DRP1
DRP1
FIS1 §§
§ pDRP Ser616 (78-82 kDa) pDRP Ser637 (78-82 kDa) GAPDH (37 kDa)
⁎⁎
⁎⁎,§§
§§
⁎⁎,##
⁎⁎,##
⁎
pDRP1 S637/total DRP1
Figure6: Effect of BGP-15 treatment on mitochondrialfission proteins in a hypertension induced-heart failure model. Western blot analysis of Fis1 and DRP1 proteins, as well as densitometric evaluation, is shown. GAPDH was used as a loading control. WKY: age-matched normotensive Wistar-Kyoto rats; SHR-Baseline: 15-month-old spontaneously hypertensive rats; SHR-C: 19-month-old nontreated spontaneously hypertensive rats; SHR-B: 19-month-old spontaneously hypertensive rats receiving BGP-15 for 18 weeks (n= 4). Values are mean ± SEM.∗p< 0:05vs. WKY,∗∗p< 0:01vs. WKY,##p<0.01 vs. SHR-Baseline,§p<0.05 vs. SHR-C,§§p<0.01 vs. SHR-C.
similar to that of WKY rats (Figures 3(d) and 3(e)). In treated SHR animals (SHR-B), normal, large, and less elongated mito- chondria with tightly packed cristae and electron-dense matrix were seen (Figure 3(f)). The area of IFM was assessed on elec- tron micrographs (~500 mitochondria/group were measured;
Figure 4(b)). We assessed relative frequencies of the measured mitochondrial areas in arbitrary intervals of 0.3μm2 (Figure 4(a)). In all the groups, less than 1% of mitochondrial areas were above the 1.81μm2 value. In the SHR-C group, 43.7% of the measured mitochondria belonged to the lowest area range (<0.3μm2). However, in the WKY group, the pre- dominant area range of the measured mitochondria was between 0.3 and 0.6μm2. Due to BGP-15 treatment (SHR- B), the distribution of mitochondria was similar to that of the WKY group and the highest number of mitochondria (48%) belonged to the 0.3-0.6μm2 range (p< 0:05, SHR-B vs. SHR-C). Our results showed a profound decrease in the mean mitochondrial area of SHR-C group compared to the mitochondria of WKY animals (p< 0:05, SHR-C, vs. WKY).
The values of BGP-15-treated SHRs differed from that of the SHR-C group (p< 0:05), and it was similar to the mitochon- dria of normotensive animals (WKY).
3.1.3. Effect of BGP-15 Treatment on Mitochondrial Fusion Proteins in SHR Animals. Regarding the mitochondrial fusion proteins, we determined the levels of OPA1, MFN1, and MFN2 in the myocardium using Western blot analysis (Figure 5). We observed that the level of OPA1 was moder- ately decreased in the SHR-C group compared to the WKY group (p< 0:05, SHR-C vs. WKY). However, BGP-15 treat- ment caused a significant elevation of OPA1 level in the SHR-B group (p< 0:01 SHR-B vs. WKY, p< 0:05 SHR-B vs. SHR-C). Considering the amount of MFN1 protein level, there was a significant increase in hypertensive animals by the end of the study compared to the baseline levels (p< 0:05, SHR-C and SHR-B vs. SHR-Baseline); however, there was no difference between the SHR groups. The level of MFN2 protein was moderately lower in the SHR-C group than in the WKY group (p< 0:05), as observed in the case of OPA1. In the SHR-B group, this parameter increased signif- icantly due to the treatment compared to the other groups (p< 0:01SHR-B vs WKY, SHR-C).
3.1.4. Effect of BGP-15 Administration on Mitochondrial Fission Proteins in SHR Animals. The levels of fission
WKY SHR-C SHR-B
0 5 10 15 20 25
WKY SHR-baseline SHR-C SHR-B
§§
SHR- baseline OPA1
(85-100 kDa) DRP1 (78-82 kDa)
GAPDH (37 kDa)
Arbitrary units (AU)
Cytosolic DRP1
(a)
WKY SHR-C SHR-B
0 2 4 6 8 10 12
WKY SHR-baseline SHR-C SHR-B
§§
OPA1 (85-100 kDa)
DRP1 (78-82 kDa)
PDC (43 kDa)
SHR- baseline
Arbitrary units (AU)
⁎⁎
Mitochondrial DRP1
(b)
Figure7: Effect of BGP-15 treatment on DRP1 protein intracellular distribution in a hypertension-induced heart failure model. Western blot analysis regarding the intracellular distribution of DRP1 protein and densitometric evaluation are also shown. GAPDH and PDC were used as a loading control. WKY: age-matched normotensive Wistar-Kyoto rats; SHR-Baseline: 15-month-old spontaneously hypertensive rats; SHR- C: 19-month-old nontreated spontaneously hypertensive rats; SHR-B: 19-month-old spontaneously hypertensive rats receiving BGP-15 for 18 weeks (n= 4). Values aremean ± SEM.∗∗p< 0:01vs. WKY,§§p< 0:01vs SHR-C.
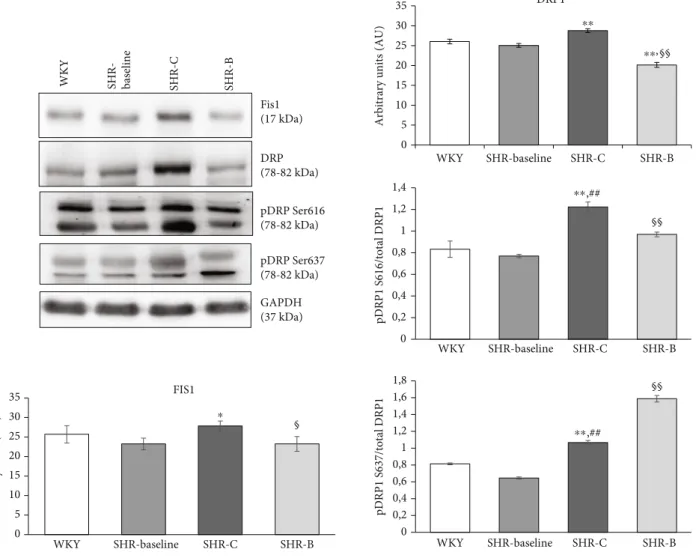
proteins Fis1 and DRP1 were determined in the myocardium in total and in fractionated Western blot samples (Figure 6).
The level of Fis1 increased in the SHR-C group compared to the WKY group (p< 0:05, SHR-C vs. WKY). This elevation was, however, diminished significantly due to BGP-15 treat- ment (p< 0:05SHR-B vs. SHR-C). In the case of thefission protein DRP1, the total level was significantly decreased due to BGP-15 treatment compared to other groups (p< 0:01 SHR-B vs. WKY, SHR-C). The phosphorylation level of DRP1 at the Ser616 and Ser637 residues was also measured. The phosphorylation of DRP1Ser616and DRP1Ser637 was moderate in the WKY group. In the SHR-C group, how- ever, phosphorylation of DRP1Ser616 was increased signifi- cantly (p< 0:01 vs. WKY and SHR-Baseline). BGP-15 treatment decreased DRP1Ser616 phosphorylation in SHR-B animals (p< 0:01vs. SHR-C group). Regarding the phosphor- ylation level of DRP1Ser637, we observed a significant increase in the SHR-C group (p< 0:01vs. WKY, SHR-Baseline). More- over, BGP-15 treatment caused a further increase in the DRP1Ser637 phosphorylation in SHR-B animals (p< 0:01 SHR-B vs. SHR-C).
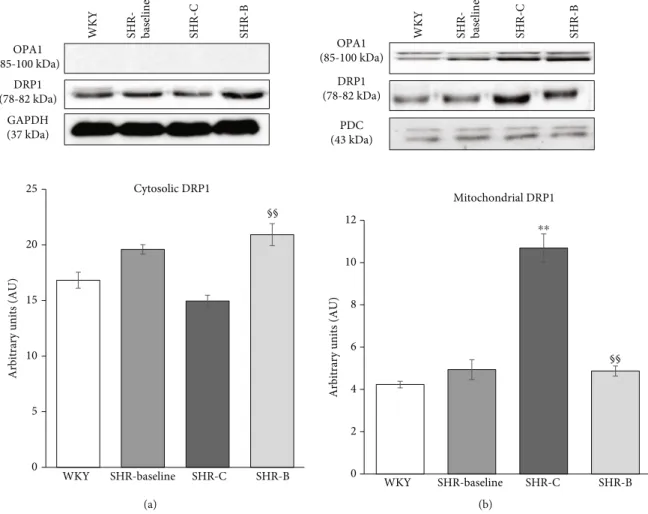
The intracellular distribution of DRP1 was also mea- sured (Figure 7). We observed that the Drp1 accumulated in the mitochondrial fractions of SHR-C animals com- pared to normotensive animals (p<0.01, SHR-C vs.
WKY). BGP-15 treatment resulted in a significantly reduced translocation of Drp1 into the mitochondria (p<0.01 vs. SHR-C), thereby preserving it in a higher con- centration in the cytosolic fraction.
3.2. In Vitro Results
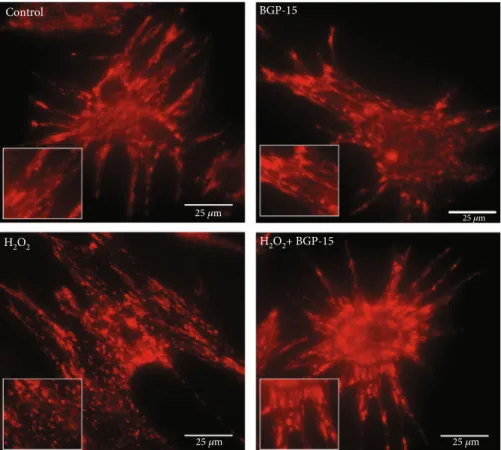
3.2.1. Effect of BGP-15 Administration on Mitochondrial Morphology of NRCM Cells.To examine the changes of the mitochondrial network, we used the MitoTracker Red CMXRos staining method (Figure 8). BGP-15 per se had no effect on the complexity of the mitochondrial network. Fila- mentous mitochondrial network was observed in the Control group; H2O2treatment, however, caused a marked injury to the mitochondrial network. As a result of the H2O2-induced fission processes, degradation of the mitochondrial network could be observed which led to mitochondrial fragmentation.
BGP-15 treatment prevented the mitochondrial network from the oxidative stress-induced fragmentation and pre- served the normalfilamentous network of mitochondria.
3.2.2. Effect of BGP-15 Treatment on Mitochondrial Fusion Proteins in NRCMs.We assessed the levels of OPA1, MFN1 and MFN2 proteins in total Western blot samples of NRCM cells (Figure 9). BGP-15 treatment per se had no effect in the
Control BGP-15
H2O2+ BGP-15 H2O2
25 𝜇m 25 𝜇m
25 𝜇m 25 𝜇m
Figure8: Effect of BGP-15 administration on the morphology of mitochondrial network in NRCM cells. For methodical details, see chapter
“Materials and Methods.”BGP-15 treatment prevented the mitochondrial network from the oxidative stress-induced fragmentation and preserved mitochondria predominantly in the normalfilamentous state. The inserts show thefilamentous and fragmented states, showing that BGP-15 protected the mitochondrial network. Control group: cells without any treatment; BGP-15 group: cells with only 50μM BGP- 15 for 0.5 hours; H2O2group: cells with 150μM H2O2for 0.5 hours; H2O2+BGP-15 group: cells with 150μM H2O2and 50μM BGP-15 for 0.5 hours.
nonstressed cells in comparison to the Control group. H2O2 treatment caused a slight decrease in the level of MFN1 and MFN2 proteins and a slight increase in the level of OPA1, but these changes were not significant. BGP-15 treatment caused a significant increase of OPA1, MFN1, and MFN2 proteins in H2O2 stressed cells compared to the H2O2- stressed group (p< 0:05H2O2-BGP15 vs. H2O2).
3.2.3. Effect of BGP-15 Administration on Mitochondrial Fission Proteins in NRCMs. We determined the levels of Fis1 and DRP1 in total and in fractionated Western blot sam- ples in NRCM cells (Figure 10). No significant difference was found with BGP-15 treatment in nonstressed cells compared to the Control group. The level of Fis1 increased markedly in the H2O2 group compared to the Control group (p< 0:01, H2O2 vs. Control). Due to BGP-15 treatment, this change was blunted (p< 0:05, H2O2-BGP15 vs. H2O2 group). The case of thefission mediator DRP1 protein total level was a significant elevation in the H2O2 group due to oxidative stress (p< 0:05H2O2 vs. Control group). However, a control-like value could be seen in the treated group com- pared to the H2O2 group (p< 0:05 H2O2-BGP15 vs. H2O2 group). The phosphorylation of DRP1 on Ser616 and Ser637 residues was also evaluated. The phosphorylation of
both DRP1 phospho-form was moderate in the Control group. Phosphorylation of DRP1Ser616 increased consider- ably in the H2O2group (p< 0:05H2O2 vs. Control group).
However, BGP-15 treatment decreased DRP1Ser616 phos- phorylation compared to nontreated stressed cells (p< 0:05 H2O2-BGP-15 vs. H2O2group). Measuring the phosphoryla- tion level of DRP1Ser637, a significant decrease could be observed in the H2O2group compared to the Control group (p< 0:01H2O2vs. Control group). However, BGP-15 treat- ment enhanced remarkably the DRP1Ser637phosphorylation (p< 0:01H2O2-BGP15 vs. H2O2group).
Finally, the intracellular distribution offission mediator DRP1 protein was examined (Figure 11). A significantly higher portion of DRP1 could be found in the mitochondrial fraction of cells in the H2O2group compared to the BGP-15- treated group. The translocation of DRP1 protein from the cytosol to the mitochondria was moderated as a result of the BGP-15 treatment and in this way resulted in higher levels of DRP1 in the cytosolic fraction and lower concentra- tion in the mitochondrial fraction (p< 0:01vs. H2O2group).
3.2.4. Effect of BGP-15 Treatment on the Regulatory Factors of Mitochondrial Biogenesis in NRCMs. We determined the levels of PGC-1α, CREB and VDAC in the total Western blot
0 5 10 15 20 25
Control BGP-15 H2O2
H2O2
H2O2+BGP-15
Arbitrary units (AU)
0 5 10 15 20 25 30 35
Arbitrary units (AU)
GAPDH (37 kDa) MFN1 (84 kDa) MNF2 (84 kDa) OPA1 (85-100 kDa)
Control BGP-15 H2O2 H2O2+ BGP1-15
OPA1
MFN1 MFN2
0 5 10 15 20 25 30 35
Control BGP-15 H2O2+BGP-15 H2O2
Control BGP-15 H2O2+BGP-15
Arbitrary units (AU)
⁎,§
⁎,§ ⁎,§
Figure9: Effect of BGP-15 treatment on mitochondrial fusion proteins in NRCM cells. Western blot analysis of OPA1, MFN1, and MFN2 as well as densitometric evaluation is shown. GAPDH was used as a loading control. Control group: cells without any treatment; BGP-15 group:
cells with only 50μM BGP-15 for 0.5 hours; H2O2group: cells with 150μM H2O2for 0.5 hours; H2O2+BGP-15 group: cells with 150μM H2O2and 50μM BGP-15 for 0.5 hours. Values aremean ± SEM(n= 4).∗p< 0:05vs. Control,§p< 0:05vs. H2O2group.
samples of NRCMs. BGP-15 treatment had no effect on these factors in nonstressed cells compared to the Control group.
The PGC-1α level was increased in the H2O2 group com- pared to the Control group (p< 0:01 vs. Control;
Figure 12). However, this elevation was much more marked in the treated group (p< 0:01H2O2-BGP15 vs. Control and H2O2 groups). The phosphorylation level of CREBSer133 was low in the Control group. However, a significant increase was seen in the phosphorylation level of CREB-
Ser133 in the H2O2 group (p< 0:01 H2O2 vs. Control) (Figure 12). BGP-15 treatment increased further the phos- phorylation level of CREBSer133 (p< 0:01, H2O2-BGP15 vs.
H2O2group). The level of VDAC was slightly decreased in the H2O2 group compared to the Control group (p< 0:05 H2O2 vs. Control). The level of the VDAC, however, was significantly elevated in the BGP-15 treated group (p< 0:01 H2O2-BGP-15 vs. H2O2 group).
Moreover, we investigated mitochondrial DNA content compared to the nuclear DNA. The relative mitochondrial DNA content was determined by “real-time” PCR, using COX1 and COX3 primers, normalized to a nuclear- encoded β-actin gene. We found that BGP-15 treatment
increased the relative expression levels of COXI and COXIII genes compared to the H2O2group (p< 0:05H2O2-BGP-15 vs. H2O2group; Figure 13).
Furthermore, we also performed a well-accepted method for studying mitochondrial biogenesis by measuring the activity of citrate synthase (Figure 13). Citrate synthase activ- ity was reduced in hydrogen-peroxide stressed group com- pared to the control group (p< 0:01H2O2vs. Control). The citrate synthase activity was increased significantly due to the treatment (p< 0:01 H2O2-BGP-15 vs. H2O2 group;
Figure 13).
Finally, we measured the level of NDUFs1 subunit of NADH-ubiquinone oxidoreductase and UQCRC1 subunit of Ubiquinol Cytochrome c Reductase proteins in order to support ourfinding regarding the effect of BGP-15 on mito- chondrial biogenesis. The expression level of NDUFs1 was significantly decreased in the H2O2 group (p< 0:01 H2O2 vs. Control; Figure 14). A similar observation was made in the case of UQCRC1 (p< 0:05H2O2vs. Control). However, BGP-15 treatment not only protected against the decrease but also significantly increased the amount of NDUFs1 and UQCRC1 proteins (p< 0:01H2O2-BGP-15 vs. H2O2group).
0 5 10 15 20 25 30 35
Control BGP-15 H2O2 H2O2+BGP-15
Control BGP-15 H2O2 H2O2+BGP-15
Control BGP-15 H2O2 H2O2+BGP-15
Arbitrary units (AU)
0 0,2 0,4 0,6 0,8 1 1,2 1,4
0 0,2 0,4 0,6 0,8 1 1,2 1,4 1,6 Fis1
(17 kDa) DRP (78-82 kDa) pDRP Ser616 (78-82 kDa) pDRP Ser637 (78-82 kDa) GAPDH (37 kDa)
Control BGP-15 H2O2 H2O2 + BGP1-15
Fis1
DRP1
§
§
§§
0 5 10 15 20 25 30 35 40
Control BGP-15 H2O2 H2O2+BGP-15
Arbitrary units (AU)
§
⁎
Phospho DRP1 S616/total DRP1Phospho DRP1 S637/total DRP1
⁎
⁎⁎
⁎⁎
Figure10: Effect of BGP-15 treatment on mitochondrialfission proteins in NRCM cells. Western blot analysis of Fis1 and DRP1 proteins, as well as densitometric evaluation, is shown. GAPDH was used as a loading control. Control group: cells without any treatment, BGP-15 group:
cells with only 50μM BGP-15 for 0.5 hours; H2O2group: cells with 150μM H2O2for 0.5 hours; H2O2+BGP-15 group: cells with 150μM H2O2and 50μM BGP-15 for 0.5 hours. Values aremean ± SEM(n= 4).∗p< 0:05vs. Control,∗∗p< 0:01vs. Control,§p< 0:05vs. H2O2 group,§§p< 0:01vs. H2O2group.
3.2.5. Effect of BGP-15 Administration on Mitochondrial Genome Integrity. Real-time detection of long-range poly- merase chain reaction (LRPCR) was used to examine the impact of H2O2-induced oxidative injury on mtDNA (Figure 15). No significant difference was found with BGP- 15 treatment alone compared to the Control group. H2O2 induced a significant damage of the mtDNA (p< 0:05, H2O2vs. Control); the amplification rate of the entire mito- chondrial genome was markedly diminished. This unfavour- able damage was significantly reduced by BGP-15 treatment (p< 0:01, H2O2-BGP15 vs. H2O2).
3.2.6. Effect of BGP-15 on Mitochondrial Membrane Potential (ΔΨ) in NRCM Cells.We examined the effect of BGP-15 on mitochondrial membrane potential using JC-1, a cell- permeable voltage-sensitive fluorescent mitochondrial dye (Figure 16). JC-1 emits redfluorescence if the mitochondrial membrane potential is high (aggregated dye), while depolar- ized mitochondria emit greenfluorescence (monomer dye).
In the control cells,fluorescence microscopy showed strong redfluorescence and weak green fluorescence, which indi- cates a highΔΨm in mitochondria (Figure 16(a)). BGP-15 per se had no effect on mitochondrial membrane potential.
The addition of H2O2 to cells facilitates the depolarization of mitochondria, resulting in weaker red fluorescence and
stronger green fluorescence (p< 0:01 H2O2 vs. Control;
Figure 16(b)). If BGP-15 was also administered in peroxide- stressed NRCM cells, red fluorescence increased and green fluorescence decreased compared to the H2O2-treated cells (p< 0:01, H2O2-BGP15 vs. H2O2) (Figure 16(b)). Therefore, the quantitative assessment revealed that BGP-15 treat- ment reduced the H2O2-induced depolarization of the mitochondrial membrane; the ΔΨm was similar to that of the Control cells.
3.2.7. Effect of BGP-15 on Mitochondrial Oxygen Consumption and Energy Metabolism in NRCM Cells. To determine the mitochondrial energy metabolism and respira- tory function, we used the Agilent Seahorse XFp Analyzer system and the Agilent Seahorse XFp Cell Mito Stress Test (Figure 17). BGP-15 itself had no effect on the rate of mito- chondrial respiration. The oxygen consumption rate of NRMC cells was decreased in the presence of H2O2to cells compared to Control cells (Figure 17(a)). H2O2 treatment decreased the basal respiration although this difference was not significant (Figure 17(b)). However, the maximal respira- tion, the spare respiratory capacity, and the ATP production were markedly decreased as a result of H2O2-induced oxida- tive damage compared to the Control group (p< 0:05, H2O2 vs. Control) (Figures 17(c)–17(e)). In the presence of both
Control BGP-15 H2O2 H2O2+ BGP1-15 Control BGP-15 H2O2 H2O2+ BGP1-15
0 5 10 15 20 25
Control BGP-15 H2O2 H2O2+BGP-15 Control BGP-15 H2O2 H2O2+BGP-15
Arbitrary units (AU)
Cytosolic DRP1
0 2 4 6 8 10 12 14 16
Arbitrary units (AU)
Mitochondrial DRP1 OPA1
(85-100 kDa) DRP1 (78-82 kDa)
GAPDH (37 kDa)
OPA1 (85-100 kDa)
DRP1 (78-82 kDa)
PDC (43 kDa)
⁎⁎
⁎⁎,§§ ⁎⁎,§§
⁎⁎
Figure11: Effect of BGP-15 treatment on intracellular distribution of DRP1 protein in stressed NRCM cells. Western blot analysis of DRP1 protein regarding its intracellular disruption, as well as densitometric evaluation, is shown. GAPDH and PDC were used as a loading control.
Control group: cells without any treatment; BGP-15 group: cells with only 50μM BGP-15 for 0.5 hours; H2O2group: cells with 150μM H2O2 for 0.5 hours; H2O2+BGP-15 group: cells with 150μM H2O2and 50μM BGP-15 for 0.5 hours. Values aremean ± SEM(n= 4).∗∗p< 0:01vs.
Control,§§p< 0:01vs. H2O2group.
![Figure 1: Chemical structure of BGP-15 (O-[3-piperidino-2- (O-[3-piperidino-2-hydroxy-1-propyl]-nicotinic acid amidoxime dihydrochloride) [24].](https://thumb-eu.123doks.com/thumbv2/9dokorg/752296.31929/2.899.119.392.108.213/figure-chemical-structure-piperidino-piperidino-nicotinic-amidoxime-dihydrochloride.webp)