Vitamins in Fish—with Special Reference to Edible Parts
HIDEO HIGASHI
Tokai Regional Fish Research Laboratory, Tsukishima, Chuoku, Tokyo, Japan
I. Introduction 411
II. Fat-Soluble Vitamins 2 4 1
A. Vitamin A 2 4 1
B. Congeners of Vitamin A 4 28
C. Vitamin D 43 3
D. Vitamin Ε (Tocopherols) 43 7
III. Water-Soluble Vitamins 43 7
Α. Β Vitamins in General 43 7
B. Thiamin (Vitamin Bx) 43 8
C. Riboflavin (Vitamin B2) 2 4 4
D. Vitamin B6 6 4 4
E. Vitamin B1 2 (Cobolamin) 4 48
F. Carnitine 4^4
G. Niacin 5 4 5
H. Pantothenic Acid 4^ 7
I. Folic Acid 9 4 5
J. Choline 9 4 5
K. Vitamin C (Ascorbic Acid) 46 1
References 4^ 3
I. Introduction
The vitamin content of fish varies with species, age, season, and fishing localities. Very few efforts, however, have been made to throw scientific light upon factors responsible for the differences in vitamin content. Still more obscure is the biochemical significance of these factors in the metabolism of fish. For the purpose of elucidating these points, it is most desirable to carry out experiments using fish as test animals.
As yet, few attempts have been made along this line of study. Major obstacles discouraging such experiments are frequent failures in meeting the requirements for experimental raising of fish, and technical difficulties involved in working with animals capable of living nowhere but in water.
In the meantime, we have to draw on available knowledge, although this is chiefly concerned with establishing the vitamin contents of various
411
fishes and their body organs. A compilation of analytical vitamin data has recently been published by Higashi (1957) and by Kiihnau (1958).
A comprehensive treatise on the vitamins in fish and their utilization was made available in the monograph of the author (Higashi, 1949) and in 1951 by the Soviet Academy of Science (Oparin and Bukin, 1951). Nor
wegian data were accumulated by Lunde (1940), Braekkan (1958a, b ) , and Braekkan et al. (1953, 1955). They were originally compiled by Lunde and Erlandsen (1940) and more recently by Taarland et al.
(1958). Several analytical data for vitamins are also available in an extensive United Kingdom report on the chemical composition of fish
(Love et al, 1959).
A whole area requiring far more investigation is the relationship be
tween feed and body composition. Some observations in this respect will be reported below. Reference will here be made only to Malikova
(1956), revealing that, of the invertebrates available to fish as feed, the crustaceans contain ample supplies of various vitamins, whereas mol
lusks are poor in Βχ and B i2, insects in vitamin A, and the oligochaetes in all tested vitamins.
This review is limited to fishes (Pisces) and excludes other water organisms used as food, such as molluscan or crustacean shellfish. Fur
thermore, vitamin changes taking place in handling and in various types of processing are generally not covered, as individual chapters will be reviewing and discussing these areas.
II. Fat-Soluble Vitamins
A. VITAMIN A 1. General Remarks
A general review dealing with the origin of vitamin A in fish, its dis
tribution in various parts and organs of the body, the influence of age, sex, reproductive state, and other external conditions, was published by Creac'h (1955). A recent comprehensive monograph on vitamin A in general was published by Moore (1957). The distribution of vitamin A in the fish body and viscera has been studied by a great number of scientists in several countries, but see the special studies by Katsui (1948, 1951a, b, 1958).
Fish fats as a whole show a higher vitamin A level than those of most terrestrial animals. This particularly applies to the liver oils. This most likely is explained by the feed of the fish. Both diatoms and flagel-
lates, dominating in sea plankton, are rich sources of carotene. Via in
vertebrates they are converted into vitamin A. Rapacious fishes, with the exception of a few sharks, particularly accumulate this vitamin.
Tunas, cod, and halibut are all examples of such fish. Even among fresh
water fish this is true, as in northern pike, pike-perch, and perch.
2. The Liver
Generally speaking, vitamin A is remarkably concentrated in the liver of fish. Species particularly used for the manufacture of vitamin oils include cod, pollock, tuna, dogfish, hammerhead shark, and rock- fish. An interesting exception seems to be the Japanese lamprey, where almost one half of the total vitamin A in the body is reported to be de
posited in the tissues of the alimentary canal (Yamada, 1959). Further
more, the highest amount ever encountered in living material is reported from this same source, namely 1.15 million I.U. per gram.
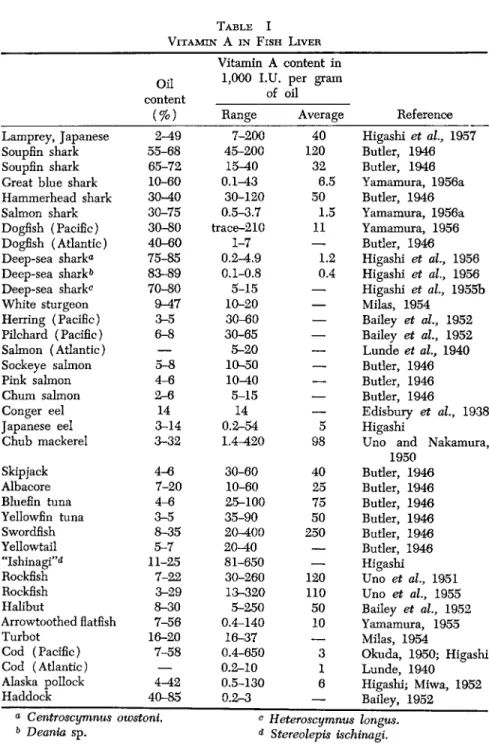
Table I indicates the vitamin A contents in the liver of major species.
Deep-sea sharks, producing squalene, are distinguished from other groups of sharks, as they possess but little vitamin A in their liver. In mature fish, about 90% or more of the total vitamin A in the body is usually stored in the liver. Nevertheless, there are marked variations in the amount of vitamin A in livers, not only among different species but also between individual specimens of the same species. This latter variance may frequently be as large as one hundred times. High values are reported from the liver of the hammerhead shark caught off the Karachi coast—72,000 USP units of vitamin per gram of liver oil—and this species, in both Japanese and Cuban analyses, are counted among the richer sources of vitamin A. Cuban investigations also showed large discrepancies between different shark species (Augulo et al., 1948).
Kizevetter and Lagovskaja (1951b) reported Alaska pollock to be particularly rich, attaining values of 260,000 I.U. per gram liver fat, while the saffron cod was amazingly poor, not exceeding 720 I.U.
Occasionally hypervitaminosis is developed by eating livers of fish (tuna, sharks and rockfish) and terrestrial animals. Cases of hyper
vitaminosis caused from livers with relatively low vitamin A content are reported from the Yenisey river and generally refer to Stenodus leucich- thys and Hucho taimen, those showing values of 3500 to 3800 I.U. and 2910 to 3800 I.U. per gram of liver tissue, respectively. Per gram of this oil is 90,000 I.U. and 55,000 I.U., respectively.
In Peruvian studies vitamin A was encountered in liver oils of all
TABLE I VITAMIN A IN FISH LIVER
Vitamin A content in Oil 1,000 I.U. per gram
content of oil
( % ) Range Average Reference Lamprey, Japanese 2-49 7-200 40 Higashi et al, 1957 Soupfin shark 55-68 45-200 120 Butler, 1946
Soupfin shark 65-72 15-40 32 Butler, 1946
Great blue shark 10-60 0.1-43 6.5 Yamamura, 1956a Hammerhead shark 30-40 30-120 50 Butler, 1946 Salmon shark 30-75 0.5-3.7 1.5 Yamamura, 1956a Dogfish (Pacific) 30-80 trace-210 11 Yamamura, 1956 Dogfish (Atlantic) 40-60 1-7
—
Butler, 1946 Deep-sea shark® 75-85 0.2-4.9 1.2 Higashi et al, 1956 Deep-sea shark0 83-89 0.1-0.8 0.4 Higashi et al., 1956 Deep-sea shark0 70-80 5-15—
Higashi et al, 1955bWhite sturgeon 9-47 10-20
—
Milas, 1954Herring (Pacific) 3-5 30-60
—
Bailey et al, 1952 Pilchard (Pacific) 6-8 30-65—
Bailey et al, 1952Salmon (Atlantic)
—
5-20—
Lunde et al, 1940Sockeye salmon 5-8 1O-50
—
Butler, 1946Pink salmon 4-6 10-40
—
Butler, 1946Chum salmon 2-6 5-15
—
Butler, 1946Conger eel 14 14
—
Edisbury et al, 1938Japanese eel 3-14 0.2-54 5 Higashi
Chub mackerel 3-32 1.4-420 98 Uno and Nakamura, 1950
Skipjack 4-6 30-60 40 Butler, 1946
Albacore 7-20 10-60 25 Butler, 1946
Bluefin tuna 4-6 25-100 75 Butler, 1946
Yellowfin tuna 3-5 35-90 50 Butler, 1946
Swordfish 8-35 20-400 250 Butler, 1946
Yellowtail 5-7 20-40
—
Butler, 1946"Ishinagi"0 11-25 81-650
—
HigashiRockfish 7-22 30-260 120 Uno et al, 1951
Rockfish 3-29 13-320 110 Uno et al, 1955
Halibut 8-30 5-250 50 Bailey et al, 1952
Arrowtoothed flatfish 7-56 0.4-140 10 Yamamura, 1955
Turbot 16-20 16-37
—
Milas, 1954Cod (Pacific) 7-58 0.4-650 3 Okuda, 1950; Higashi
Cod (Atlantic)
—
0.2-10 1 Lunde, 1940Alaska pollock 4-42 0.5-130 6 Higashi; Miwa, 1952
Haddock 40-85 0 . 2 r - 3 — Bailey, 1952
a0 Centroscymnus owstoni. c Heteroscymnus longus.
Deania sp. d Stereolepis ischinagi.
fish species examined and the amount varied within rather wide limits in each single species (Negrete 1954).
a. AGE OF F I S H
Using numerous cod and pollock caught off Hokkaido and the sea adjacent to Sakhalin, Kawai (1929-33) measured vitamin A in their livers taking into account fishing grounds and seasons. For further references see Kawai (1933), and Kawai and Yoshida (1940). The liver oil from older fish, he reports, has a much greater concentration of vitamin A than that of younger ones; between samples of identical sizes, the less the amount of liver oil, the higher is the vitamin A concentration in that oil. McPherson (1933) maintains that there is a linear relationship between the age of such fish as cod and halibut, and the vitamin A concentration in their liver oil. In a study conducted by Higashi (1940b) and concerned with such species as rockfish, yellowfin tuna, and skip
jack, the vitamin A content in the liver of individuals of the same sex caught in the same waters and seasons was determined with a view to comparing the vitamin A concentration as related to body size on the basis of the liver oil and from fishes showing only minor variances in the oil content of their livers. As the results, given in Table II, reveal, vitamin
NOTE: Numerous additional data are available in the following publications:
General: Bills et al, 1935.
For the United States: Holmes and Pigott, 1925; Sanford and Nilson, 1949; San
ford et al, 1950a, b.
For Canada: Brocklesby, 1927.
For the Soviet Union: Far East (Kizevetter and Lagovskaja, 1951a, b, c, d, and e ) . Baltic basin (Perepletshik, 1951b).
Azov-Black Sea basin (Perepletshik, 1951a; Kolchev, 1951;
Vinogradova, 1957).
Siberia (Kizevetter and Lagovskaja, 1951a; Mironova, 1951).
For India: Chakrovorthy et al, 1933 (Bengal); Ghosh et al, 1933; Ghosh and Guha, 1934-35; Seshan, 1940; Niyogi et al, 1941.
For Pakistan: Khan and Hag, 1958.
For the United Kingdom: Lovern, 1934.
For France: Andre and Lecoq, 1932.
For Norway: Lunde et al., 1937.
For Argentina: Castellanos, 1940.
For Peru: Negrete, 1954.
For Cuba: Angulo et al, 1948.
For Australia: Wood and Kuchel, 1941.
For New Zealand: Denz and Shorland, 1934.
A is concentrated in the liver of older fish more highly than in younger specimens. The same trends have been observed in soupfin shark, dog
fish, the arrow-toothed halibut, grayfish, and the South African ' maas- banker" (Kallir et al, 1944; Ripley and Bolomey, 1946; Sanford and Bonham, 1947; Sanford et al, 1950; Yamamura, 1953; Yamamura and Muto, 1955).
TABLE II
T H E E F F E C T OF AGE AND SIZE ON VITAMIN A CONTENT OF LIVER OILS
Vitamin A content Body weight Oil content of liver oil
Fish (kg.) of liver(%) in 1000 I.U.
Dogfish (female) 0.5 59 0.3
7.9 61.5 21.3
Rockfish (female) 4.5 27.5 230
2.0 21.1 52
1.2 17.8 23
Yellowfin (female) 42.7« 3.7 170
34.8ο 3.5 88
Skipjack (female) 7.0° 3.5 98
2.1* 3.2 19.5
Greenfish 1.6 4.4 230
0.6 6.8 5.6
Chub mackerel (male) 0.3 5.1 28.2
0.08 5.3 1.7
Starry flounder 2.7 11.0 52,8
Starry flounder
0.6 12.0 1.1
a& Five to six years old.
Seven years old.
c Five years old.
d Three years old.
Since fish are not capable of synthesizing vitamin A themselves, it must be entirely derived from vitamin A or provitamin A in the feed they eat. Nevertheless, the fact that the older fish have the greater amount of vitamin A in the liver oil may be due to the relatively smaller needs of this vitamin for growth and maintenance in the older fish.
With this in view, Higashi postulates that vitamin A tends to be ac
cumulated in large amounts in the liver of older fish, probably because of the vitamin A consumption being more or less proportional to the growth rate of fish. Furthermore, it may be safely assumed that the larger the size of a fish, the greater the amount of food consumed. Thus,
this circumstance might also intensify the disparity between older and younger specimens.
Cod-liver oil from Newfoundland is said to be richer in vitamins A and D than the Norwegian oil. This is presumed to be due to the fact that the Norwegian cod has exhausted its reserve of vitamins by spawn
ing just prior to capture. It seems more likely, however, that the vitamin content of the liver depends on the cod's food. This was confirmed by Poulsson (1933) and Poulsson and Ender (1933).
b. INFLUENCE OF THE O I L CONTENT
The vitamin A content in the oil depends on the amount of oil in the liver, too. No appreciable differences in the oil content of the liver are found among individual marine mammals; for instance, the oil avail
able in the liver of the fin whale remains within a range of 2 to 4% of the liver weight. The reverse is true with fish, as individual variations in their liver oil content are more common; an example is the rockfish Sebastodes iracundus, the liver oil of which ranges as widely as 11.3 to 58.5%.
In the cases of cod, pollock, sharks, and rockfish, the liver-to-body weight ratio is larger than for some other groups of fish, for instance, skipjack, mackerel, and yellowfin tuna. In the former group the oil con
tent in the liver is more than 1 0 % at the lowest, while in the latter group it is usually less than 5 % . When a fish species possesses a liver oil con
tent of 1 0 % or more on a weight basis, a close relationship is observed between the liver oil content and the nutritional status of a fish. This is probably due to the oil being directly consumed as an energy source.
Thus, when such a fish grows thin, e.g., after spawning activities, the liver oil content is substantially decreased. On the other hand, in skip
jack and mackerel, the livers of which are small and contain little oil, no such correlation is apparent between the liver oil and nourishment.
In extensive Peruvian studies an inverse ratio was established be
tween the oil yield from the livers and the vitamin A content (Negrete, 1954). The same is true of gray cod (Pugsley, 1940c).
Schmidt-Nielsen et al. (1936) measured for a number of fish species, the sizes of the liver and their oil content, as well as the vitamin A concentration. They observed that the vitamin A was diluted through an increase in both the size of liver and the oil content, or increased through the reverse changes. Based on those observations, they advanced the assumption that variations in the vitamin A concentration were not attributable to a single dilution effect, but to a changing function of the
liver in the storing of vitamin A. According to these authors, the relation between the oil content of the liver (F) and the vitamin A concentration
( Τ ) is represented by
d — F = e\ogT ( 1 ) where d and e are constant.
There are, however, additional factors that have an influence on the vitamin A concentration in the liver oil, e.g., the age of the fish, and en
vironmental conditions, such as the location of capture and seasonal differences. For this reason, the relation between the oil content and the vitamin A concentration has to be investigated with samples that have comparable amounts of oil, but are capable of comparison in these other respects, too. Judged from this standpoint, Higashi (1940a), in a work using "mamenuke," Sebastodes flummeus, proposed to express these relationships by the following formula
l o g F = & — α log A ( 2 ) where F = oil content of the liver ( % ) , A = vitamin A concentration in
the liver, a and b are constant.
On the other hand, for the rockfish S. iracundus,
a! — F = b' log A ( 3 )
In effect, this equation ( 3 ) is identical with the equation ( 1 ) given by Schmidt-Nielsen.
Soviet scientists report that in specimens of Oncorhynchus and Sal
velinus the relative weight of the liver and its fat content decline with the size of the fish, and so does the relative content of vitamin A (Kize- vetter and Lagovskaja, 1951b). The flounder family, on the other hand, is characterized by progressively higher A values with increasing fish sizes and age (Kizevetter and Lagovskaja, 1951c). This also applies to Yenisei fish (Mironova, 1951).
c. SEASONAL VARIATIONS
In the pursuit of seasonal variations in the vitamin A content of fish, a great number of research workers have participated and made avail
able new evidence. They all seem to agree that a high concentration of vitamin A in the liver is typical for the spawning season. On the basis of detailed studies of the Alaska pollock, Uno et al. (1952b) and Tamoto
(1954) independently reported that the vitamin A concentration in both the oil and the tissue of the liver exhibited maximum values in the spawning season (March and April); the concentration later declined
until it began to rise again little by little, sometimes around November or December. Scrutinizing their data, however, one will notice that the total amount of vitamin A does not measurably change throughout the year. Takahashi et al. (1952a) studied seasonal variations of the liver oil of the pollock.
Grafskaja (1941) reports for cod a decrease in the vitamin A potency of the livers in the winter period, and only in June and July do the values start increasing. The vitamin A content of gray cod livers is low
est in fall and winter (Pugsley, 1940c). See also Shorland (1934-36).
Kizevetter and Lagovskaja (1951c) report that the flounder Pleuronectes stellatus is richest in vitamin A in the early fall.
Yamamura (1956a), examining the liver oils of dogfish and the great blue shark, found that the former showed a high concentration of vi
tamin A in the liver in February, while the latter had a peak during the months of June to August. Especially for dogfish, he reported, these months coincided with the parturition stage of this viviparous fish."
When Lovern et al. (1933) evaluated the availability of feed for fish as one factor controlling the storage of vitamin A in the liver and fluc
tuating from season to season, supporting evidence was found in the North Sea halibut. There was an intimate relationship between the seas
onal differences in the standing crops of plankton and the vitamin A con
tent in the liver.
d. GEOGRAPHICAL DIFFERENCES
A number of studies are concerned with the differences in the vi
tamin A levels between the samples of the same species caught in geo
graphically different sea areas. Thus, cod and pollock from the Sea of Japan on the western coast of Hokkaido yield a liver oil containing vi
tamin A on a higher level than those caught on the Pacific coast in the east. Kawai and Yoshida (1940) were the first to make this fact known.
In a subsequent examination, Oshima et al. (1941) arrived at the same result. Similar data were obtained in other studies with cod (Uno et al., 1952a, b; Okuda and Miwa, 1952), and chub mackerel (Uno and Nakamura, 1950). Pottinger et al. (1935) reported big differences in the vitamin A values for haddock from various fishing banks.
Climatic factors may also be behind geographical differences and vice versa. Thus, cold-water flounders of the Soviet Far East deposit larger amounts of vitamin A in the liver than warm-water varieties (Kizevetter and Lagovskaja, 1951c).
The very high vitamin A values encountered in Pakistan shark liver
oils—exceeding what is found in any other coastal area of the Indian subcontinent—are attributed to the superabundance of vitamin A-rich prawns and shrimps on the Karachi coast and the dominance of this fish food off Bombay (Maqsood et al., 1958).
e. SEXUAL EFFECTS
A few species have been known to exhibit amazing differences in vitamin A values of the liver depending on sex. According to Ripley and Bolomey (1946), the adult male of soupfin shark holds an A concentra
tion in the liver oil about three times as high as that of the female. Males of hammerhead sharks carry more vitamin A in their liver than do fe
males (Maqsood et al., 1958).
In dogfish and arrow-toothed flatfish, the vitamin A level of the liver oil is higher in females than in males. This may, however, be attributed to the fact that large-sized individuals of these species occur more fre
quently as females than as males. According to studies on dogfish (Bon- ham et al., 1949), and arrow-toothed flatfish (Uno et al., 1951), males hold a vitamin A level higher than that of the female as far as specimens comparable in size are concerned. On the other hand, the female North Pacific cod and ocean salmon have a higher vitamin A content in the liver than does the male, according to Soviet scientists (Kizevetter and Lagovskaja, 1951a, b ) .
f. LIVER COLOR
Kikuchi (1909) first noticed a relationship between the color of cod livers and the quality of the oil. Later, Pugsley (1940a), Bonham et al.
(1949), Yamamura (1952, 1956a), and others studying the Pacific dog
fish, and Templeman (1944), studying the Atlantic dogfish, independently of each other reached the same conclusions, finding that dark-colored livers of these species contained less oil than light-colored ones, while the vitamin A concentrations in these oils exhibited reverse relationships.
g. ANATOMICAL FEATURES
With regard to the vitamin A distribution within the liver, soupfin shark was examined by Bucher et al. (1945); dogfish, great blue shark, and salmon shark by Yamamura (for further references see 1956a); and cod and dogfish by Takahashi et al. (1952b). According to these investi
gators, the vitamin A level in the liver of dogfish was higher at the posterior end rather than at the basal part, and in the interior part as compared to the outer portion; in the cod liver, the posterior end was
richer than the base; in salmon shark, the periphery was indicated as having a high concentration, but the central part had a markedly low level. No differences in the vitamin A content were measurable in differ
ent sections of the livers of the soupfin shark or great blue shark.
In a great number of fishes, some of the internal organs are asym
metrical in their anatomical positions, despite the symmetrical appear
ance of the body. This is particularly true with the livers of harvest fish.
Livers on the right-hand side of the body differed markedly in vitamin A content from those on the left-hand side (Higashi, 1954).
h. HISTOLOGICAL OBSERVATIONS
Histochemical studies by Araki (1952, 1956, 1957) disclosed several points of importance: ( 1 ) vitamin A exists as granules in the liver cells and in the Kupffer cells but not in the interstitia; ( 2 ) the vitamin is en
countered in the fat droplets of various sizes present in the Kupffer cells of the liver.
In dogfish liver, Yamamura (1955, 1956a, b ) observed that ( 1 ) fat is accumulated in the lattice fibers of the liver cells with melanophores dis
persed among them (this fact accounts for the dark liver described above); ( 2 ) vitamin A occurs together with melanin pigments, the amounts of each correlating with the other; ( 3 ) the oil extracted with ether shows a larger amount of vitamin A than the fat naturally sep
arated from the liver, seemingly due to the ether extraction breaking off the vitamin from the melanin pigments. (See also Hashizume, 1941.)
i. BIOCHEMICAL D A T A
Bukin and Areshkina (1940, 1951), on the basis of centrifugal sep
aration, solvent extraction, and alkali digestion, verified the existence of vitamin A bound to protein in the fish liver.
Other points proved by Uno et al. (1954) are that: ( 1 ) in the liver more than 9 0 % of the vitamin is present as ester, regardless of the species; ( 2 ) the dark-colored liver of dogfish holds a greater amount of the vitamin than the light-colored liver; ( 3 ) a greater portion of vitamin A in the liver is separated in emulsions of water-soluble protein than in those of 0.5% NaOH-soluble protein; ( 4 ) vitamin A, in the extract form 0.5% NaOH-soluble protein, is present in the portion not precipitated by acetone.
Ono and Nagayama (1952) demonstrated the existence in mackerel liver of an enzyme, oxidizing vitamin A, with properties resembling
soybean lipoxidase. The liver of Japanese sea perch contained no vitamin A , but an abundance of this enzyme.
3. Flesh Tissue
No extensive investigations have been published on the occurrence of vitamin A in the flesh tissue of fish. Isolated studies are, however, available, particularly from India, Norway, and Canada (see Table I I I ) . Normally, the content is within the range of 50 to 150 I . U . / 1 0 0 g. (Hirao et al, 1954a, b, 1955; Higashi et al, 1953a, b; 1955a, 1957; 1958). EX -
TABLE III VITAMIN A IN FISH MEAT
Fish Vitamin A
(I.U./g. tissue) Skate
Sting ray Smooth dogfish
Centroscymnus owstonia Chimaera
Great blue shark Conger eel Leather fish Carp Flying fish*
Horse mackerel Skipjack Globefish Frigate mackerel
"Isaki"*
Blanquillo Red gurnard Fresh-water catfish Pacific saury Hairtail
Starry flounder Flathead
Angler (Japanese) Rockfish
Sardine (Pacific) Chub and mackerel Dace
Herring (Pacific) Atka mackerel Dog salmon
0-20
21-40
41-60
61-80
Vitamin A Fish (I.U./g. tissue) Porgy \
Bluefin tuna 1
Yellowfin tuna ( 81-100
Common grouper ( 81-100
Alaska pollack j Cod (Pacific) / Japanese salmon \ Japanese sea bass /
101-150
Gray mullet > 101-150
Parrot fish V
Hagfish ) Alfonsino \ Harvest fish /
Blenny Γ 151-200
Conger nystromiid )
Japanese dogfish 201-300
Lantern fish )
Lizardfish ) 500-700
Dogfish 701-1,000
Astroconger myriaster4
Fresh-water eel 1,000-5,000
Heteroscymnus longusa 9,000-27,000 (average 18,000)
Japanese lamprey 13,000-98,000
(average 34,000)
° A deep-sea shark.
b Cypselurus agoo.
c Parapristipoma trilineatum.
d A conger eel.
NOTE: Additional data are available in the following publications:
For the United States: Holmes, 1926.
For Japan: Uno et al (1951, 1955), Uno (1952), Hirao et al (1959).
For the Soviet Union: (see footnote, Table I ) .
For India: Ghosh and Guho, 1934; Seshan, 1940; Basu et al, 1940; Pradhan et al, 1956.
For Pakistan: Khan and Haq, 1958.
For Angola: de Gouveia et al, 1956.
For Peru: Negrete, 1954.
TABLE I I I (continued)
ceptionally high levels of vitamin A have been encountered in a deep-sea shark (Heteroscymnus longus) and in the Japanese lamprey. Dogfish, conger eel, and "nigisu" (Argentina semifasciata) also carry more vi
tamin A in the flesh than normally is the case. The ranges can be ob
tained from Table III, compiled by this author chiefly on the basis of his own analyses. A recent survey of Japanese food fishes as to the vitamin A content in the flesh was carried out by Hirao et al. (1959).
Since very ancient times the Japanese lamprey has been recom
mended as a diet item efficacious for curing night blindness. Its vitamin A content is also several times higher than that of butter, or even that of eel oil. Swordfish appears to be one of the fish richest in the amount of vitamin A in the muscle (1,585 I.U./100 g. of flesh) (Lopez-Matas and Fellers, 1948).
Several commercially important fish, such as cod, herring, and ocean perch, contain negligible quantities in the flesh, even when liver and intestines may be very rich (Scheunert et al., 1958). No vitamin A was found in canned salmon from such different sources as the United Kingdom, the United States, Canada, and Japan (Pyke and Wright, 1941). American shad also has low vitamin A potency in the flesh (Holmes, 1925). Truesdail and Boynton (1931) found, however, that although most salmon are inferior to cod, chinook and sockeye gen
erally are richer than silver, humpback, or chum salmon. The nutritive aspects are discussed by Cruickshank in Chapter 4, volume II.
Recently, a number of analytical data from Peruvian fishes became
TABLE I V
VITAMIN A IN OIL OF FLESH OF PERUVIAN F I S H0
I . U . I . U .
Fish per gram Fish per gram
Sarda chilensisb Sciaena deliciosa
(salted and smoked) 7 , 4 2 0 (fresh) 6 , 3 0 0
Mustelus dorsalis0 Sciaena stärkst 6 , 3 0 0 (salted and smoked) 5 , 5 0 0 (fresh) 1 2 , 0 0 8
Chellodactylis variegatus Paralabrax humeralis
(fresh) 8 , 0 0 0 (fresh) 6 , 9 3 0
Ethonidium chilcae Merluccius gayi 6 , 9 3 0 (salted and smoked) 1 1 , 3 3 2 (fresh) 9 , 4 0 0 a From analytical data published in Anales fac. farm, bioquim. (Lima) 4, 6 6 - 1 8 2 ( 1 9 5 3 ) . 6
Vitamin D . 7 2 4 I.U. per gram of flesh oil.
c Vitamin D . 5 5 I.U. per gram of flesh oil.
available (see Table I V ) . Bluefin tuna meat is a remarkable all-round source of all major vitamins (Braekkan et al., 1955). Hirao et al. (1959) found no relationship between the taxonomic classification and vitamin A content. Even very closely related fishes could differ largely as to their vitamin A content in the flesh.
Much remains, however, to be explained as to the mechanism and function of vitamin A stored in the meat in certain species. Not all deep- sea sharks are characterized by much vitamin A in the body oil. Other species living in the same habitat have low values.
In the majority of teleostean fish, dark meat contains slightly more vitamin A than the white meat. In some sharks and in the Japanese
TABLE V
VITAMIN A IN W H I T E AND DARK FLESH
Vitamin A in I.U. per 100 g. of tissue
Fish White flesh Dark flesh
Dog salmon 70 120
Chub mackerel 77 115
Pacific saury 47 110
Starry flounder 91 102
Japanese eel 2,270 5,450
Dogfish 5,240 2,130
Deep-sea shark 25,400 11,400
lamprey the reverse is true (Table V ) . This may be ascribed to be basic physiological differences between teleosteans and fish belonging to more primitive groups.
In the big-eyed tuna, the vitamin A content is always greater in the front part of the body than in the posterior part (Hirao et al., 1954a).
This also is true of the dogfish and the Japanese lamprey.
In more extensive studies of the fluctuations in vitamin A content, such variables as the location in the body were particularly investigated in nine commercial fishes, including salmon, yellowtail, and crucian carp (Hirao et al., 1954a). Even in exactly the same individual fish, the vitamin A content may vary as much as sevenfold depending on the location in the body. The amount of vitamin A is, as a rule higher in the meat of the inner part of the body as compared to positions closer to the surface. The relationship between the fat content in per cent ( F ) of normal meat from any location in the body and the vitamin A concentration ( A ) in the fat may be expressed by
log A + a log F = b therefore
A Fa = constant a > 0 This equation coincides with the one Higashi (see Section II A, 2b) proposed as expressing the relationship between the oil content of the liver and the concentration of vitamin A in this oil when studying the Alaska pollock and some rockfish. In applying the above equation, Hirao et al. (1955a) observed three different relationships depending on spe
cies. In one species, when α > 1 , the less oil the body stores at a cer
tain location, the higher the A content in the meat at this very section.
In another case, when α < 1 , the higher the oil content at a certain part of the body, the higher the A content in the corresponding meat; finally when α = 0, the A content is constant regardless of the oil content, when this varies from part to part of the body. This equation is not applicable to the oil-vitamin A relationship in dark meat. The following hypothesis was forwarded in these investigations. When fat and vitamin A are re
plenished from pertinent organs to various parts of body, they are con
sumed, but each at different rates depending on the location in the body. No consistent correlation prevails between the shape of a fish, as reflected in its symmetry and the vitamin A content (Hirao et al., 1954b). In flatfishes, Hirao et al. found more vitamin A accumulated on the eyed side than the blind side. Higashi's equation is applicable to the fat-vitamin A relationship in the meat of each side of the body.
Hirao et al. (1955a) concluded that no close relationship exists be
tween the vitamin A storage in the liver and the meat in various fishes.
Nevertheless, the equation above representing the relationship between the oil content ( F ) and the vitamin concentration in the body oil covers different individuals of the same species. Normally, the total amount of vitamin A in the meat does not exceed a few per cent of that accumu
lated in the liver. Exceptions are eel and river lamprey. Their total amount of vitamin A in the meat is three to four times higher than in their livers. This suggests that the vitamin A in the meat may have a different physiological function.
4. The Skin
Hirao et al. (1955b, c ) studied the vitamin A deposition in the skin of fifteen species of marine and fresh-water fish, such as mackerel, fly
ing fish, flatfish, and eel. In a majority of them, the skin was found to be a source of vitamin A several times higher than the meat, except for
Japanese eel and lamprey, the skins of which stored much less vitamin A than the meat (Table V I ) . Abnormally high vitamin A values were also encountered in marine edible teleost fish, of Karachi waters (Khan and Haq, 1958). Lederer (1938) analyzed several of these carotenoid pigments and traced them to invertebrate feed consumed by fish. In this study by Lederer are listed a number of earlier investigations on the skin pigments of fish.
T A B L E VI VITAMIN A IN THE SKIN
Vitamin A in I.U. per 100 g. of tissue
Fish Skin Meat
Chub mackerel 74 34
Porgy 33 17
Fresh-water catfish 192 32
Starry flounder
Eyed side 243 95
Blind side 111 58
Japanese fresh-water eel 1120 2480
Japanese lamprey 6340 23400
a Source: Hirao et ah, 1955b.
It has been known that in the pigments of fish skin several caro- tenoids are to be found, the majority of which are xanthophylls with very little carotene or none at all. All evidence at hand, however, in
dicates that neither the kinds nor the quantities of carotenoids stand in any direct relationship to the amount of vitamin A in the skin. As to which carotenoids are encountered in fish, reference is made to Section II, B , 5.
5. Other Organs
As regards the vitamin A content of other body organs of fish, nu
merous investigations of both physiological and biochemical nature have been reported. In a volume such as this, dedicated to fish as food, it is less justified to discuss these findings, although several of them are of extraordinary interest for understanding the physiology of fishes. Ref
erence is here made to the comprehensive special volume on such sub
jects (Brown, 1957).
It might be mentioned briefly that vitamin A is generally found in the eyes of fish, where the content is subject to minor variations. Fresh
water fish carry more vitamin A in their eyes than do marine species (for further references see Katsui, 1952). This distinguishes the eye from the
liver and the pyloric caeca, where fluctuations in the vitamin A content may be large and sometimes spectacular. In other words, there is a dis
tinct difference between the eyes and the viscera as to the vitamin A range, which is much wider in the latter case.
The high figures for vitamin A encountered in the alimentary canal of the Japanese lamprey, mentioned above in Section II, A, 2, point to the tissues of this canal as an important depot, stored up during the salt-water visits by this fish and utilized gradually in fresh-water life.
The canal contents of this species are relatively low in vitamin A, but rich in sterols. A large part of this stored vitamin A is in the ester form, and only minor quantities are in free form. The major trend of this stor
age is evident from the fact that 7 5 % of the unsaponifiable fat of the alimentary canal tissue consists of vitamin A (Yamada, 1959). High amounts of vitamin A in viscera of several marine fish have been re
ported by Scheunert et al. (1956). Exceptional in this respect is ocean perch—235-320,000 I.U./gram of viscera. This was earlier reported by Novikova (1952) (see the reference list under the heading " B vita
mins"). The carp—a fresh-water species—carries more vitamin A in the intestines than in its liver. Another source of vitamin A is the gonads.
In the herring, the roe is richer than the milt (Scheunert and Schieblisch, 1934).
The pyloric caeca, certain appendages situated between the stomach and the gut and participating functionally in the absorption of lipids, contain appreciable quantities of vitamin A. Their fat frequently shows an A potency exceeding that of the liver oil (Edisbury et al., 1938; Kat- sui, 1948; 1951a, b, 1958). Cod and haddock were studied in this respect (Anonymous, 1951), but as these organs are not generally used as food, the extensive investigations of them cannot be elaborated on further here.
B . CONGENERS OF VITAMIN A
1. Vitamins A± and A2 and Their Ratio
It was earlier thought that vitamin A2 was specific to fresh-water fish.
Except for fish, very few cases of vertebrates and invertebrates have been reported to possess this type. Since about 1931, its existence in fresh-water fish had been accepted on the basis of spectroscopic ex
amination of SbCl3-color reaction of their liver oils (Morton et al., 1931; Heilbron et al, 1931). See also Edisbury et al. (1938), Lovern et al. (1939a, b ) , and Wald (1939). Later, the substance was crystallized as phenylazobenzoate from liver oil of pike (Shantz, 1948). On the basis
of a synthetic product, the structure of vitamin A2 was established (Far- rar et al, 1951). High-potency vitamin A2 oils were obtained from Nile fishes (Abdullah et al, 1954), and from Indian fresh-water fish (Bala
sundaram et al, 1955, 1956).
It was further thought that marine fish were characterized by Αχ. An exception was the Labridae (Wald, 1939). Through extensive research
—see, among others, Lederer and Rozanova (1937), Lederer and Rath- man (1938a, b ) Gillam et al, (1938)—however, it became evident that there existed among fresh-water fish one group storing only Ai, while the other held both Αχ and A2 (Sakamoto, 1940). Deviations exist in special body organs, even of the same fish species. In sharks the ratio of Αχ to A2 varies from 12:1 to 25:1 (Pradhan and Magar, 1956). Furthermore, vitamin A2 is widespread in marine fish liver oils—often 4 - 2 0 % of the total vitamin (Collins et al, 1953).
On the basis of the Αχ/Α2 ratio in the liver oil of fresh-water fish in India, Cama et al (1955) and Balasundaram et al (1956) recently pointed out the dominancy in carnivorous fish of vitamin A2 over Αχ, while the contrary appeared to be the case in herbivorous fish. They also reported that vitamin A in these fresh-water fish exists mainly as an ester, whereas Αχ is an alcohol. Extensive researches by Wald confirmed that fish living in sea water throughout their life contain only A1 ? while those living entirely in fresh water carried only A2, although those fish which lead a sea life as well as having a fresh-water stage are found with both Αχ and A2. Anadromous species such as the salmonoids, which spawn in fresh water, contain vitamin A2 in greater quantities than Αχ, whereas the relation is the reverse in catadromous fish, such as eels.
There are, however, a few exceptions, as some marine fish possess A2
despite the fact that they never inhabit fresh waters. According to Wald, this would be explained on an evolutionary basis in the following way:
Ancestral fresh-water fishes (Vitamin Ax? )
Modern marine fishes
\XVitamin Αλ) (Vitamin \x)
Catadromous fishes (predominantly Ax) Anadromous fishes (predominantly A2)
iodern fresh-water teleosts (Vitamin A2)
In refuting the theory postulated by Wald; Collins et al (1953) in
duced from a few evidences that the A i / A2 ratio in various species of fish is determined by two factors: one is the ratio between Ai and A2 or between provitamins Ai and A2 in the food; the other is hereditary ability to convert a provitamin to Ai or A2. There is also the obvious possibility that the eyes, with regard to vitamin A composition, are more specific and better reflect fundamental phylogenetic differences than other body parts, more easily influenced by diet. This is indicated in a recent review by Wald (1958).
In any event, comparative studies on the structures of vitamins Αχ and A2 suggest that A2 is produced through the dehydration of Ai in the body of fish. Nevertheless, breeding experiments performed with fresh-water fish by Morcos and Salah (1951) failed to change A1 into A2, while Ai in the diet was found stored up, as it was, in the body of fish. On the other hand, Morton and Creed (1939) reported on an
other fresh-water fish that, according to them, was able to change ß-carotene into either Ai or A2. A possible inference from these findings may be something like this: fish would produce vitamin A2 from pro
vitamin A, instead of simply converting Ai into A2. See, however, Sec
tion II, B , 5, where recent French investigations point to astaxanthin as the precursor for both Ai and A2 anticipated by Collins et al (1953).
Grangaud and Moatti (1958), in experimenting with Gambusia hoi- brooki, established that this species was capable of converting ß-caro
tene into Αχ, and in addition Ai into A2. But A2 could not be changed metabolically into Ai.
Vitamin Ai has been considered a specific eye constituent, until Plack et al (1958) reported on its prevalance in fish eggs of herring, cod, haddock, and whiting. It is alternatively bound to proteins or lipids.
In the former case, it becomes water-soluble. See also Section II, B , 2 following.
2. Neovitamins A1 and A2
None of the six cis-isomers of vitamin A has been assured to exist in fish except one. That is neovitamin A or 2-mono-cis-isomer,1 separated for the first time from shark liver oil by Robeson and Baxter (1947).
The ratio of neovitamin A to the total A they obtained from the liver oils of various fish ranged from 32 to 3 9 % ; Meunier and Jouanneteau (1948) obtained figures between 42 and 5 5 % , Hay er and Petitpierre
1 Geneva system of numbering.
(1952) 11-39%, and Braekkan (1952) 14.2-55.8%. In the case of syn
thetic vitamin A, the isomeric equilibrium between all-trans A and neovitamin A is 2:1, or 2:1.5 (Cawley et al.9 1948), a ratio which nearly accords with those obtained from fish liver oil. This fact seems to sug
gest that both neovitamin A and all-trans A exist in fish, regardless of species, at a constant ratio by being transformed from one to the other.
Abdulah et al. (1954) reported on a fresh-water fish from the Nile which possesses neovitamin A2, a cis-isomer of vitamin A2 within the range of 16.2 to 22.5% of total A2. Cama et al. (1955) report 5 - 2 0 % neovitamin A in liver oils of marine fishes with high potencies. There is, however, some doubt as to the identity of the irarw-vitamin A2 due to the finding of new absorption maxima for this compound by Lambertsen and Braekkan (1957). In further studies of several Nile fishes, seven contained exclusively neovitamin A2 and two species showed neovitamin A2 mixed with regular vitamin A (Morcos and Salah, 1958).
Analysis by the maleic anhydride method of 40 samples of liver oils obtained from 31 species of fishes indigenous to Norwegian waters showed neovitamin A to be essentially absent. Vitamin A was, there
fore, believed to be stored in the fish liver in the frans-form, and the commonly reported values of 3 5 % for neovitamin A were due to isomerization of vitamin A. During the handling and processing of the liver samples, storage of livers at 6°C. prior to isolation of the oil re
sulted in an increased amount of neovitamin A (Lambertsen and Braek
kan, 1956).
3. Retinenex and Retinene2
When vitamin Ai in the body of fish participates in the formation of rhodopsin, and vitamin A2 in that of porphyropsin, they are each oxi
dized into aldehydes, specified as retinenei and retinene2, respectively.
For further references see Wald (1949, 1953). They are primarily formed in the retina of fish. Plack et al. (1959) reported that the eggs of herring (roe) and seven other marine teleost fishes contained from 1 to 3 of vitamin Ai-aldehyde per gram—ten times the combined concentration of the Ai ester and alcohol. Pollard and Biari (1959), however, maintain that herring roe contains only retinene2, while shad roe completely lacks vitamin Α-aldehyde, and a mixture of ling and whiting roe carried retinenei. Braekkan et al. (1960) confirmed the presence of vitamin Αχ-aldehyde in herring roe, but no retinene2 was found.
4. Kitolx and Kitol2
Originally, kitoli is a two-molecular condensation of vitamin A en
countered in the liver oil of whales. Though they have no effect of vitamin A, as they stand, these compounds are converted into vitamin A by pyrolysis. Among fish, some species of sharks, such as dogfish, produce liver oil which shows the presence of kitoli, as reported by Embree and Shantz (1943a, b ) and Clough et al (1947). With regard to the forma
tion of kitol in whale-liver oil, Hickman (1943) postulated that whales convert vitamin A into kitol in order to nullify the toxic effects of vitamin A. It does not, however, seem feasible to conclude that kitol is produced from vitamin A. On the structure, see Kaneko (1959). Kitol2 is the name given to a substance convertible into vitamin A2 by pyrolysis, which was found in northern pike liver oil (Embree and Shantz, 1943b).
5. Carotenoids
Among the numerous carotenoids, the following so far have been reported in fish: lutein, taraxanthin, zeaxanthin, violaxanthin, fucox- anthin, ß-carotene and α-carotene (Bailey, 1938; Karrer and Tucker, 1950; Goodwin, 1951; Fox, 1947, 1957), though most of them are not provided with reliable evidences. An exception is astaxanthin or astacin, the presence of which in the body of several fishes is almost certain. This is further discussed in Chapter 6 by Jacquot in this volume. Besides the references given there, mention can be made of its occurrence in the flesh of salmon by S0rensen (1935), in the skin of Beryx species by Led- erer (1935) and Mori and Sato (1939), and in goldfish by Lederer (1935).
Astaxanthin must undoubtedly be considered a vitamin A factor (Gran
gaud, 1951). Experimenting with the fish Gambusia holbrooki (Grd), it was established that primarily vitamin Αχ (retinol) is formed from administered astaxanthin; subsequently this Αχ may through dehydro- genation be converted into A2 (Grangaud et al, 1956). The oxidative breaking of the terpene links takes place in the mucous lining of the intestines.
Hirao et al (1955c, 1957) expressed doubts as to the presence of taraxanthin in fish. They established the occurrence of tunaxanthin. As to the biochemical functions of carotenoids, reference is made to Good
win (1951, 1952) and Fox (1957).
Findings by Hirao et al (1959) based on fifty different species are:
( 1 ) When different carotenoids are present in fish, the dominant is always the same among individuals of the same species, minor carotenoids being dependent on age and environments of fish.
( 2 ) About seven different carotenoids including astaxanthin, lutein, and tunaxanthin, are present in fish skin.
( 3 ) Lutein occurs in eggs of fish. But no amounts of tunaxanthin have been found in eggs even when skin from the same individuals was rich in tunaxanthin.
Hirao and Kikuchi (1958) reported on the existence of a specific fluorescing substance, fluorodermin, commonly encountered in a great number of fishes, such as chub mackerel, jack mackerel, salmon, and goldfish. Presumably, it interacts with other carotenoids.
Both fresh-water and salt-water fish are capable of converting caro
tene into vitamin A (Morton and Creed, 1939; Morcos and Salah, 1951;
Nielands, 1947) and carotene into xanthophylls (Sumner and Fox, 1935).
Notwithstanding, no data show a clear correlation between vitamin A and carotenoids in fish. Consequently, it may be inferred that vitamin A and carotenoids, although they both originate from complex carotenoids in the feed of the fish, presumably perform distinctly different functions in the metabolism of the fish. Kon and Thompson (1949) could also establish that whales f e e d i n g on larger C r u s t a c e a d e r i v e t h e i r v i t a m i n f r o m p r e f o r m e d v i t a m i n A a n d not f r o m c a r o t e n e .
C. V I T A M I N D
Many of the fish appear to be devoid of vitamin D. Some sea fish have moderate deposits. The highest amounts are encountered in the fat from the internal organs of such fresh-water species as the common carp and bream (Bukin and Erofeeva, 1951). Caspian lamprey, pike- perch, and roach are all good sources of vitamin D (Matzko, 1934). This is also true of the Japanese sardine and the sheatfish (Matzko, 1933, 1934), and particularly high values were found in the Atlantic redfish
(Matzko and Vital, 1932). Irradiation of fish fats, lacking vitamin D but containing provitamins as precursors, may result in very high activi
ties—up to 16,000 to 32,000 I.U. per gram (Bukin and Erofeeva, 1951).
Menhaden is a remarkably good source of vitamin D (Manning et al., 1931). Since the less fatty specimens are richer in this respect, Supplee (1937) recommended the early summer catch as being the best source for the purpose of obtaining vitamin D in feed mixtures. Com
mercial pilchard oil lies between cod-liver oil and dogfish oil in regard to vitamin D potency (Brocklesby and Denstedt, 1930).
For analytical methods, see review with 24 references by Watanabe and Kanzawa (1956).
Following McCollum et al. (1921), who first took notice of the anti
rachitic factor present in liver oil, Brockmann (1936) and Brockmann and Busse (1937) succeeded in separating vitamin D3 from tuna-liver oil. A number of reports are available on the vitamin D content of fish.
Provitamin D, known from many plants and animals, has been identified from livers and eggs of fish (see listing in Sebrell and Harris, 1954).
But so far provitamin D has not been isolated from fish flesh.
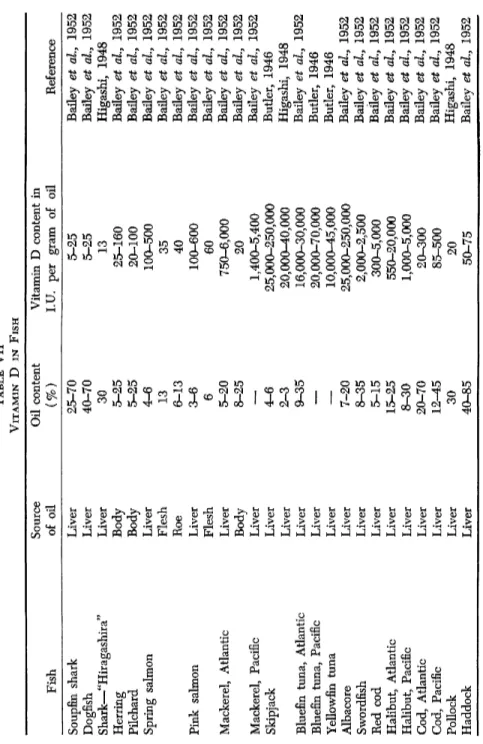
1. Liver
The liver is a richer source of vitamin D than any other viscera of fish. Among various species, the albacore shows the largest potency, ranging 25,000-250,000 I.U./g., while sharks show only 25 LU./g., at the most, in the liver oil. Most analyses are to be found in the following papers: Brocklesby, 1929; Andre and Lecoq, 1932 (France); Cunning
ham, 1934-36, 1936-37 (New Zealand); Lunde at al, 1937 (Norway);
Basu and Gupta, 1940 (India); Pugsley 1940a, b, c, d, 1942 (Canada);
Pugsley at al, 1945 (Canada); Ranganathan, 1941; Butler, 1946 (United States); Bailey et al, 1952 (Canada); Higashi, 1948 (Japan); Komarov, 1953 (Soviet Baltic); Miwa and Kinoshita, 1956 (Japan). The liver oils of the Indian salmon ("dara") and jewfish ("ghoi") are particularly rich in vitamin D (Pradhan and Mager, 1957). See also Table VII.
Poulsson (1929, 1931) put forward the view that the marked scarcity of vitamin D in cartilaginous fishes may be attributed to their lack of physiological need of this vitamin. This assertion may not be entirely valid. See also II, C, 3.
The assays of vitamin D that Kawai and Yoshida (1934) conducted with liver oils of pollock, cod, and dogfish disclosed a tendency for vitamins D and A to run parallel with each other as to quantity, insofar as the same species is concerned. However, individual variations in the D content are not so marked as in vitamin A, despite differences in fishing locality and size of the body. Pottinger et al. (1935) could estab
lish no relationship between the amount of A and D in cod and haddock.
Pugsley, in a series of studies (1938-45) with such fish as dogfish, halibut, pilchard, cod, and gray cod, investigated the effect of such variables as size, age, season, and locality of capture—for further refer
ences see Pugsley et al. (1945). In halibut and gray cod the vitamin D potency was higher in summer than in spring or autumn. Otherwise, no fixed rules could be established. Thus, specimens of cod and pilchard successively caught during July through October showed the oil content
TABLE VII VITAMIN D IN FISH Source Oil content Vitamin D content in Fish of oil (%) I.U. per gram of oil Reference Soupfin shark Liver 25-70 5-25 Bailey et al, 1952 Dogfish Liver 40-70 5-25 Bailey et al, 1952 Shark—"Hiragashira" Liver 30 13 Higashi, 1948 Herring Body 5-25 25-160 Bailey et al, 1952 Pilchard Body 5-25 20-100 Bailey et al, 1952 Spring salmon Liver 4-6 100-500 Bailey et al, 1952 Spring salmon Flesh 13 35 Bailey et al, 1952 Roe 6-13 40 Bailey et al, 1952 Pink salmon Liver 3-6 100-600 Bailey et al, 1952 Flesh 6 60 Bailey et al, 1952 Mackerel, Atlantic Liver 5-20 750-6,000 Bailey et al, 1952 Body 8-25 20 Bailey et al, 1952 Mackerel, Pacific Liver
—
1,400-5,400 Bailey et al, 1952 Skipjack Liver 4-6 25,000-250,000 Butler, 1946 Skipjack Liver 2-3 20,000-40,000 Higashi, 1948 Bluefin tuna, Atlantic Liver 9-35 16,000-30,000 Bailey et al, 1952 Bluefin tuna, Pacific Liver—
20,000-70,000 Butler, 1946 Yellowfin tuna Liver—
10,000-45,000 Butler, 1946 Albacore Liver 7-20 25,000-250,000 Bailey et al, 1952 Swordfish Liver 8-35 2,000-2,500 Bailey et al, 1952 Red cod Liver 5-15 300-5,000 Bailey et al, 1952 Halibut, Atlantic Liver 15-25 550-20,000 Bailey et al, 1952 Halibut, Pacific Liver 8-30 1,000-5,000 Bailey et al, 1952 Cod, Atlantic Liver 20-70 20-300 Bailey et al, 1952 Cod, Pacific Liver 12-45 85-500 Bailey et al, 1952 Pollock Liver 30 20 Higashi, 1948 Haddock Liver 40-85 50-75 Bailey et al, 1952increasing, despite a diminishing vitamin D potency; such studies were reported in several cases by Pugsley. On the basis of a statistical analysis he proved that the vitamin D content of pilchard liver generally is in a close but inverse relationship with the oil content. The vitamin D potency of herring is not related to the size of the fish (Pugsley, 1942).
The liver oil of Murmansk codfish shows constantly lower figures (10-40 I.U./ml.) than the corresponding Baltic species (80-250 I.U./ml.) (Komarov, 1953). By means of the curative method with rats, it was established that Norwegian oils were almost twice as potent in vitamin D as Newfoundland oils (Poulsson, 1933).
Comparing vitamin A and D in the pollock-liver oil by season of the year, Miwa and Kinoshita (1956) inferred that vitamin D is stored in the liver of the pollock prior to spawning, but largely consumed during the recovery subsequent to that period.
Some interesting results have been reported as to the various salmon species on the basis of cannery trimmings. Pink and chum salmon are rich in D, but low in A. Chinooks had all the A and most of the D in the visceral fats (Harrison et al., 1937).
The reason for low D-values may in certain cases be due to method
ological difficulties in analyzing this compound. Chemical procedures are not satisfactory with some shark-liver oils (Pradhan and Magar, 1957). A comparative appraisal of the chemical and biological methods of determining vitamin D has been published by Soviet scientists
(Garkina and Bukin, 1951; Bukin and Erofeeva, 1951).
2. Flesh Tissue
The D content of salmon flesh is below that of the viscera but very small (Bailey et al., 1952). The eel constitutes an exception in this respect
(Bailey et al., 1952). Some clupeids are reported to contain vitamin D.
The fat of the barbel was found to contain 50-60 Steenbock units of vitamin D, and that of "Ivassy" (small herring from the Sea of Okhotsk)
(Matzko, 1933).
3. Congeners
On the basis of analyses of cod-liver oil employing molecular distil
lation, Hickman and Gray (1938) maintained that liver oil contains at least two, and probably six, D vitamins, all with an antirachitic effect.
Among these vitamins, four ( D2, D3, D4, and D5) have been prepared in pure form, with D2 and D3 occurring in larger quantities than the others.
Bills et al. (1937), examining the nutritional fuel efficiency of the liver oils of 25 fish species on chickens and rats, concluded that there existed more than two different Di vitamins. More recently, Raoul et al.
(1952, 1955) separated another vitamin D as a Ca-complex together with a precursor (inactive as a vitamin) which was prepared by partial oxidation of cholesterol obtained from fish-liver oil. This compound was named Vitamin D7. According to them, cod-liver oil contains more vita
min D7 than precursor, while shark-liver oil shows the reverse. Later, these workers (Raoul et al., 1956) met with success in an attempt to iso
late vitamin D3 ester and ketone 250, a new compound. This particular ketone turned out to be identical to vitamin D7. Although the antirachitic effects of this new D vitamin on rats and chicken was only one-tenth of that of vitamin D3, tuna-liver oil contains D7 in amounts five to six times greater than that of D3.
D. VITAMIN Ε (TOCOPHEROLS)
As to this vitamin, reference is made to a rather complete survey of available papers in Chapter 6 by Jacquot (this volume) and in Chap
ter 6 by Tarr in Volume II. See also the general review on vitamin Ε in foods by Lange (1950) and the survey of analytical methods by Katsui (1956). In addition, mention should be made of a study by Mori et al. (1957). They established that the vitamin Ε content was highest in liver oil, followed by the oil in the pyloric caeca. Other interesting facts they observed were that ( 1 ) the Ε content (around 1 mg./g.) in liver oil showed no substantial variation between species, and that
( 2 ) this vitamin possibly is connected with spawning activities, the increase in its potency in the gonad being far greater than that in any other body organ. Furthermore, it is largely depleted during spawning.
III. Water-Soluble Vitamins
Α . Β - V I T A M I N S IN GENERAL
Several traits are common to the entire Β vitamin group. Frequently they have been studied as a group, and as to their occurrence follow the same general pattern.
Certain geographical and climatic factors influence the content of Β vitamins. Codfish from northern areas contain more B i and B2 than specimens from warmer areas (Novikova, 1952).
Most Β vitamins are intimately connected with the basic metabolic
activities of the fish. This becomes particularly evident in the lateral red muscle of the fish, generally carrying large quantities of biologically ac
tive substances, chiefly vitamins of the Β complex (Umemura, 1951;
Braekkan, 1959). Ascorbic acid is also quite common in this muscle (Umemura, 1951)—see further under Βχ2, Section III, E , 5.
Numerous analyses are available as to the content of various Β vi
tamins in national foods and the importance of fish in this respect (United States: Cheldelin and Williams, 1942; Norway: Braekkan et al, 1955; Greenland: Hjarde et al, 1952; Japan: Yano and Yamaguchi, 1955;
Peru: Collazo-Chiriboga et al, 1952). Fish meals (Pritchard and Wraige, 1953; Anonymous, 1953) and fish solubles (Tsuchiya and Oba, 1952) have also been extensively analyzed in this respect. A comparative study of fish meals and fish solubles from different countries showed large variations as to contents of various Β vitamins, presumably due to manufacturing methods (Murayama and Yanase, 1960).
Rat-feeding experiments have not given entirely satisfactory results when using various common fishes as a source of Β vitamins. This dis
crepancy between the composition data and the nutritional findings is not yet clarified as to its causes (Beveridge, 1957). Further experimenta
tion is required.
In storing herring for subsequent meal manufacturing, appreciable quantities of the water-soluble Β vitamins are lost to the blood water.
Frequently it contains more of the essential vitamins than the presscake does. The stickwater may carry away as much as 7 4 % of the total panto
thenic acid and 4 0 - 5 0 % of the thiamin (Klungs0yr et al, 1954).
Since fish livers revealed themselves as rich sources also of water- soluble vitamins (Lunde and Kringstad, 1938; Kringstad and Folkvord, 1949; Guttman, 1950) special methods have been elaborated for their safe extraction (Gray et al.y 1951; Rajagopalan and Sarma, 1956). What applies to livers also is true of pyloric appendages. They not only ac
cumulate the fat-soluble A but most of the Β vitamins. This has been particularly investigated by Murayama and Tabei (1956).
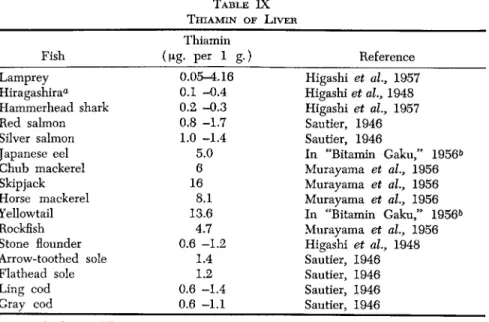
B. THIAMIN ( V I T A M I N Βχ)
1. General Remarks
Within one and the same fish species, individual variations in the thiamin content are not so striking as those occurring in fat-soluble vi
tamins. This might be explained in the way that thiamin is picked up by the flesh tissues to the degree required for the metabolism, but is not accumulated beyond that limit.