The Role of Marine and Fresh-Water Foods in the Japanese Diet
K. ARIMOTO
National Institute of Nutrition, Tokyo, Japan
I. Diet 361 A. Food Intake 361
B. Intake of Nutrients 362 C. Nutritional Deficiencies 364 D. Physical Symptoms 364 E. Needs for Improved Diet 364 II. Catch and Consumption 364
A. Catch 364 B. Consumption 366 C. Animal Protein 367 D. Increased Production 367 III. Nutritive Value of Japanese Seafood 367
A. Protein 367 B. Fat 367 C. Minerals 369 D. Vitamins 369 IV. Seafood in the Diet 372
A. Cooking Methods 372 B. Manufactured and Processed Products 373
I. Diet
A survey is conducted four times a year on the intake of foods. Physi
cal measurements, such as height, weight, and other physical body char
acteristics—likely to reflect the nutritional standard and to reveal defi
ciencies—are registered. On the basis of the dietary figures, intake of various nutrients is calculated.
A. FOOD INTAKE
The consumptional pattern has changed substantially in latter years.
Grains and potatoes show a steady decline, while the consumption of fish, meats, poultry, and eggs has increased. At the same time, the intake of fats, oils, and sugar has expanded in a conspicuous manner (Table I).
The differences between the urban and rural populations are not too great. They show up most in the critical area of consumption of fish and
361
362 K. ARIMOTO
other animal products, which is 30% below the average for the urban population. In rural districts, less sugar is consumed and more potatoes.
TABLE I
INTAKE OF FOODS AS TO COMMODITIES PER CAPITA PER D A Y ( I N G R A M S )a
Foods Cereals and nuts Potatoes
Sugars Fats and oils
Beans and other legumes Fish, meat, egg, and dairy products Vegetables and fruits
Seaweeds
Processed vegetables Miscellaneous
Annual 1949-1951
483.0 136.9 7.9 2.5 55.5 81.9 227.6 3.4 46.7 33.5 1078.9
average per 1952-1954
478.6 78.5 14.9 4.2 68.7 112.4 209.1 4.4 49.4 41.9 1062.1
period 1955-1957
471.2 75.6 13.9 4.8 70.0 112.0 233.2 4.8 56.9 58.1 1100.5
α Source: Ministry of Health and Welfare, Japanese Government.
B. INTAKE OF NUTRIENTS
The nutrient intake is calculated from the dietary figures for consump
tion and on the basis of standard tables for food composition (Table IIA).
These results disclose that the nutritional status has improved since the TABLE IIA
INTAKE OF CALORIES AND NUTRIENTS PER CAPITA PER D A Y ( WHOLE COUNTRY )
Calories and Nutrients Calories
Protein (g.) Total Animal Vegetable Carbohydrate (g.) Fat (g.)
Minerals Calcium (g.) Phosphorus (g.) Iron (mg.) Vitamins
A (I.U.) Βχ (mg.) B2 (mg.) C (mg.)
1949-1951 2107
67 16 50.3 422
17 0.25 1.81 47 2379
1.57 0.73 107
1952-1954 2083
69.1 22.3 46.9 406 204
0.37 1.82 62 2745
1.11 0.66 75
1955-1957 2095
69.4 22.7 46.8 406.5 21.1«
0.37 1.36 15*
1667 1.14 0.69 77
a Average for 1955-1956.
& Change in basis for calculation.
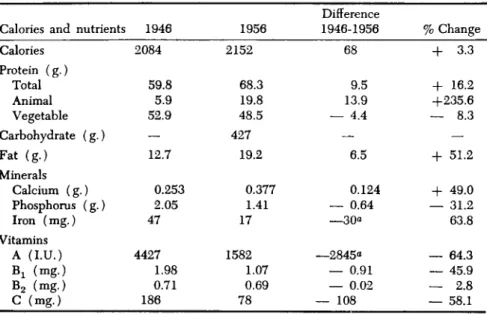
war ended. This change is particularly noticeable in the rural areas (Table IIB and C).
TABLE IIB
INTAKE OF CALORIES AND NUTRIENTS PER CAPITA PER D A Y ( RURAL AREAS )
Calories and nutrients Calories
Protein (g.) Total Animal Vegetable Carbohydrate (g.) Fat (g.)
Minerals Calcium (g.) Phosphorus (g.) Iron (mg.) Vitamins
A (I.U.) Bx (mg.) B2 (mg.) C (mg.)
1946 2084
59.8 5.9 52.9
— 12.7
0.253 2.05 47 4427
1.98 0.71 186
1956 2152
68.3 19.8 48.5 427
19.2 0.377 1.41 17 1582
1.07 0.69 78
Difference 1946-1956
68 9.5 13.9
— 4.4
— 6.5 0.124
— 0.64
—30«
—2845«
— 0.91
— 0.02
— 108
% Change + 3.3 + 16.2 +235.6
— 8.3
— + 51.2 + 49.0
— 31.2 63.8
— 64.3
— 45.9
— 2.8
— 58.1
a Change in basis for calculation.
TABLE IIC
INTAKE OF CALORIES AND NUTRIENTS PER CAPITA PER DAY ( U R B A N AREAS)
Calories and nutrients Calories
Protein (g.) Total Animal Vegetable Carbohydrate (g.) Fat (g.)
Minerals Calcium (g.) Phosphorus (g.) Iron (mg.) Vitamins
A (I.U.) Bx (mg.) B2 (mg.) C (mg.)
1946 1721
59.5 15.2 44.3
— 16.6
0.253 1.87 48 4854
1.63 0.64 188
1956 2034
69.8 25.4 44.5 384
24.3 0.381 1.30 15 1789
1.18 0.72 75
Difference 1946-1956
313 10.3 10.2 0.2
— 7.7 0.128
— 0.57
—33«
—3065«
— 0.45 0.08
— 113
% Change + 18.2 + 17.3 + 67.1 + 0.5
— + 46.3 + 50.6
— 30.5
— 68.8
— 63.1
— 27.6
— 12.5
— 60.1
° Change in basis for calculation.
364 K. ARIMOTO
C. NUTRITIONAL DEFICIENCIES
In spite of improvements in the over-all nutritional condition, many deficiencies still exist. This can be inferred from the discrepancies be- tween the actual intake of nutrients and the standard requirements. The intake is below standard in calories, as well as in all major nutrients such as good high-quality protein, fats, vitamins, and calcium. Furthermore, the-figures for intake are calculated without giving due consideration to the losses taking place during cooking. The urban population enjoys a 26%" higher intake of animal protein and fat but 10% less plant protein and calories than in the rural sector. The intake of calories, protein, and fat increases every year, while that of vitamins and calcium has remained almost unchanged during recent years.
D. PHYSICAL SYMPTOMS
Anemia, xerophthalmia, and cheilosis generally result from dietary shortcomings. These figures are not high. For anemia they amount to 2.5% of the population and for eye disturbances due to lack of vitamin A, 3 %; cheilosis is encountered in 5 % of the population. Approximately one-fourth of the nation shows one or another symptom attributable to lack of some essential nutrient.
E. NEEDS FOR IMPROVED DIET
High-quality protein is still needed in great quantity. Besides meats, eggs, milk, and soybeans, the consumption of fish should be effectively increased to provide additional amounts. Fish, together with soybeans, are considered the most promising sources from which to meet the needs of the expanding population. A greater intake of vitamin-rich food is desirable. Although milk and butter are effectively promoted, the meas- ures of fortification mean more. This is done in rice, flour, "miso," and oleomargarine. Calcium is scarce, and some foods are now enriched with calcium.
II. Catch and Consumption
A. CATCH
Japan, an island country, is geographically favored with marine prod- ucts. Next to China, it is the leading fishing nation of the world (see Chapter 7, this volume). Approximately 60% of the total catch was utilized as food, while the remainder was used as fertilizers and animal feed. Nowadays, however, some 90% goes for human consumption
(Table III). Table I shows postwar supply and consumption of various foods and marine products.
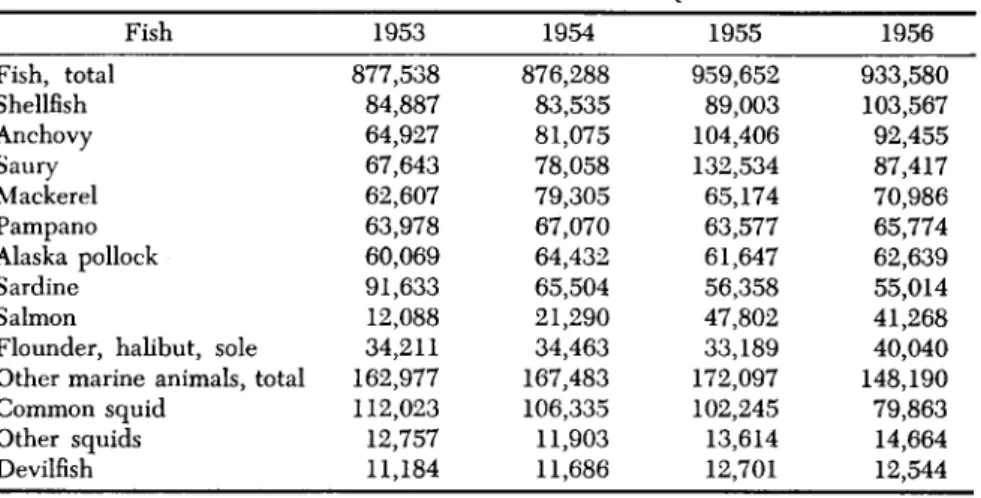
TABLE III
SUMMARY OF CATCHES BY FISHERIES AND AQUICULTURE*
Fish Fish, total Shellfish Anchovy Saury Mackerel Pampano Alaska pollock Sardine Salmon
Flounder, halibut, sole Other marine animals, total Common squid
Other squids Devilfish
1953 877,538
84,887 64,927 67,643 62,607 63,978 60,069 91,633 12,088 34,211 162,977 112,023 12,757 11,184
1954 876,288
83,535 81,075 78,058 79,305 67,070 64,432 65,504 21,290 34,463 167,483 106,335 11,903 11,686
1955 959,652
89,003 104,406 132,534 65,174 63,577 61,647 56,358 47,802 33,189 172,097 102,245 13,614 12,701
1956 933,580 103,567 92,455 87,417 70,986 65,774 62,639 55,014 41,268 40,040 148,190 79,863 14,664 12,544
» Unit: 1000 kan = 3.75 tons.
The total catch at present surpasses the prewar level. Numerous kinds of fish and shellfish are landed and eaten in Japan. The number is well over a hundred, counting only major kinds (Table IV). Furthermore,
TABLE IV
CATCHES O F SELECTED SPECIES IN THE PREWAR AND POSTWAR PERIODS*
1935-1937 1952-1956
Fish Total amount Sardine Saury Mackerel Cod Pampano Tuna Herring Flounder Skipjack Salmon Cuttlefish
Average (A) in 1000 kan&
1,165,669 319,885 26,849 31,574 48,963 7,820 17,925 70,829 19,261 23,576 52,166 20,210
%
100 27.4 2.3 2.0 4.1 0.6 1.5 6.0 1.6 2.0 4.4 1.7
Average (B) in 1000 kan»
1,327,584 168,364 85,183 70,905 69,725 63,078 54,314 43,236 35,013 30,224 26,604 131,276
%
100 12.6 6.4 5.3 5.3 4.7 4.1 3.2 2.6 2.2 2.0 9.9
B/A X 100
—
52.6 317.2 224.5 142.5 806.6 303.0 61.0 181.7 128.5 50.9 649.5
α Source: Ministry of Agriculture and Forestry, Japanese Government.
& Unit: 1000 kan = 3.75 tons.
there is quite a diversity of processed products such as canned, frozen, dried, cured, smoked, and pickled types.
Whale meat, together with fish and shellfish, plays an important role
366 K. ARIMOTO
in Japanese nutrition as a protein and fat source, and its production has increased greatly in recent years (Table V).
T A TU IT V
TABLE V
W H A L E CATCHES®
Pelagic whaling, Antarctic Ocean Number of whales caught Production (metric tons):
whale oil
meat (including skin) for food Pelagic whaling, North Pacific Ocean
Number of whales caught Production (metric tons):
whale oil
meat (including skin) for food Coastal whaling
Number of whales caught
Amounts of production (metric tons):
whale oil
meat (including skin) for food Small-type whaling
Number of whales caught
Amounts of production (metric tons):
whale oil
meat (including skin) for food
1954
—
— —
2216 17,547 15,922 2354 5638 15,169 803 2671 1779
1955 5956 62,377 39,676 2652 19,026 12,223 2387 5853 16,095 871 2919 2006
1956 6462 69,505 44,642 3186 24,922 15,915 3284 7859 18,522 1210 3553 2482
° Source: Ministry of Agriculture and Forestry, Japan.
Seaweeds are also essential as mineral and vitamin sources, and many kinds of such algae are being gathered, and are also cultivated. Several seaweeds are potent sources of vitamin Bi2. This is particularly true of one of the most common species, the red algae Porphyra tenera, which is the basis for the popular dish "asakusanori."
B. CONSUMPTION
Several difficulties prevail in procuring reliable statistics picturing the true scope of the fisheries. A considerable amount of fish being caught does not enter into the statistics. This means that the actual con- sumption of seafood presumably largely exceeds the catch as given in official statistics.
Figures for consumption of seafood in Japan vary considerably. This most likely is due to the fact that the amount of edible flesh is not always computed. The great diversification of products may partly ex- plain these discrepancies.
Fish constitutes almost 5% of the total caloric intake, a larger pro-
portion of the total protein intake (25%), and still more in relation to the animal protein being consumed.
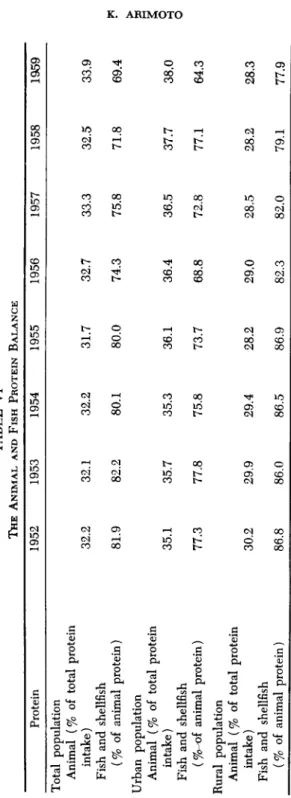
C. ANIMAL PROTEIN
The per capita consumption of fish and shellfish meat in Japan almost equals that in Scandinavia, but the relative role of fish is much greater owing to the low level of total intake of animal protein. This latter figure is, however, at present on the increase.
Fish and shellfish protein constitute a major portion of this high- quality protein, amounting to 69% as a national average, but less in urban regions (64%) and more in rural areas (78%) (see Table VI).
D. INCREASED PRODUCTION
Emphasis is now put on enhancing the production through agriculture of animal protein (milk, meat, and eggs). This progress will be slow and is impeded by the simultaneous growth of the population in numbers.
On the other hand, research and development are encouraged in the field of foods, such as Chlorella and food yeast. Most practical so far, how
ever, are expanded catching of fish and the growing of the protein-rich soybean. Both are traditional in Japan, and the population has developed great skill in their preparation as food. Thus, manufacture of fish sausage is in latter years spreading extensively in the rural areas, this being a cheap food item.
With improved storage facilities and a more efficient utilization of fish and shellfish, it appears possible to attain higher figures for intake of nutrients than hitherto even without an enlargement of the total catch.
III. Nutritive Value of Japanese Seafood
Japanese species do not differ as to composition from what is reported from other fishing nations of the world. A few analytical data referring to more recent data and to species either specific to or dominating in Japanese landings are listed in Table VII.
A. PROTEIN
The nutritive aspects of fish and shellfish protein are discussed in Chapter 2 of this volume. Some pertinent data on important Japanese fish species are listed in Table VII.
B. FAT
Both body fat, deposited in the muscle tissues, as in sardines, herring, salmon, and tuna, and liver fat, as in shark and cod, are important sources of food. The amount of both these types of fats varies depending
CO OS 00 TABLE VI THE ANIMAL AND FISH PROTEIN BALANCE Protein 1952 1953 1954 1955 1956 1957 1958 1959 Total population Animal (% of total protein intake) Fish and shellfish (% of animal protein) Urban population Animal (% of total protein intake) Fish and shellfish (%-Ό{ animal protein) Rural population Animal (% of total protein intake) Fish and shellfish (% of animal protein)
32.2 81.9 35.1 77.3 30.2 86.8
32.1 82.2 35.7 77.8 29.9 86.0
32.2 80.1 35.3 75.8 29.4 86.5
31.7 80.0 36.1 73.7 28.2 86.9
32.7 74.3 36.4 68.8 29.0 82.3
33.3 75.8 36.5 72.8 28.5 82.0
32.5 71.8 37.7 77.1 28.2 79.1
33.9 69.4 38.0 64.3 28.3 77.9
> 5ö O
3
on species, age, and living conditions of the fish, and those variations are more marked in fat than in any other ingredient. The composition of fat is discussed in Volume I, Chapters 7 and 8. As to the possible injurious effect of such highly unsaturated fatty acids due to the forma- tion of toxic substances through oxidation, reference is made to Chapter 3 in this volume.
C. MINERALS
A number of minerals contained in fish and shellfish are essential to the diet. Several of these occur in trace quantities, but are nevertheless essential, e.g., bromine, boron, manganese, lithium, selenium, arsenic, and cobalt. In addition there is a group the importance of which to human nutrition has not so far been clarified, such as silicon, caesium, silver, mercury, gadolinium, tin, chromium, nickel, and aluminum. Iodine and calcium are quite essential and occur more abundantly in fish and shell- fish than in meat and poultry. The amount of these minerals varies de- pending on the kind of fish, living conditions, and organ. The iodine content is highest in shellfish, followed by fish. In one investigated class it was most abundant in viscera, followed by the meat, and lowest in the skin. The calcium content of pond smelt living in sea water is higher than when this same fish develops in a fresh-water lake.
D. VITAMINS
At present, there is a shortage of vitamin A in the Japanese diet, and no less than 9 5 % of what is consumed comes from plant sources. More efficient use should be made of the rich marine sources in this respect.
In the postwar period, an industry has been developed using fish liver oil as a raw material. Concentrated vitamin A oil thus obtained is used for enriching oleomargarine, "miso" (a soybean product), and fish sau- sages.
A great number of vitamin analyses are available from Japan. Several of these are referred to and partially listed in Chapters 6 and 13 of Volume I. Mention should be made of the studies by Yanase on Be, round herring being a particularly rich source; Bi 2 was investigated by Hashi- moto, as well as by Yanase. The liver of the mullet and the saury contains many times more B12 than any other source. Rather large amounts are also found in the liver of pampano and sea bream. It was mentioned by Higashi (Volume I, Chapter 13) that the lamprey by tradition is well known to be a good all-round source of most vitamins, particu- larly of those belonging to the fat-soluble group. Some selected but typical figures have been compiled in a special Table VII. It has already been stated that several seaweeds constitute potent sources of B12.
3 7 0 K. ARIMOTO
TABLE VII
COMPOSITION (PER 1 0 0 G . ) OF MAJOR JAPANESE SEAFOOD
Seafood Alaska pollock Atka mackerel Bastard halibut Bluefin tuna
Conger eel Croaker Dogfish Flounder Herring Mackerel Pampano Salmon Sardine Saury Skipjack Sweet smelt Yellowtail King crab Spiny lobster
"Shibaebi" shrimp Abalone
Common scallop Fresh-water clam Hard clam Oyster
Short-necked clam Squid
Cherry salmon Common carp Crucian carp Eel
Pond smelt Cod roe Herring roe Salmon roe Whale meat
Calo
rie (cal.)
72 110 100 107 311 150 144 314 109 144 111 110 156 125 207 130 95 194 91 80 55 100 100 99 61 93 60 79 136 172 98 243 95 112 139 238 120
Mois
ture (g·) 81.0 77.0 75.7 73.2 52.6 71.5 70.0 50.0 74.0 73.5 76.0 75.0 70.5 75.0 64.5 70.0 78.5 63.0 76.0 80.0 86.0 73.4 74.2 76.0 84.8 79.6 85.4 80.3 71.0 67.0 78.0 60.7 76.8 71.5 69.0 53.0 72.7
Pro
tein (g->
16.6 17.0 22.0 24.0 21.0 19.0 22.0 25.0 22.0 16.0 18.0 20.0 19.0 17.0 20.0 25.0 17.0 25.0 20.0 16.0 11.5 23.5 20.8 15.0 10.0 10.0 10.0 17.0 22.0 22.0 17.0 20.0 17.1 21.0 25.6 25.0 23.3
Fat (g·) 0.6 4.6 1.0 1.0 25.0 8.0 6.0 23.5 2.0 8.5 4.0 3.0 8.7 6.0 14.0 3.0 3.0 10.0 0.5 1.1 0.7 0.4 0.8 1.8 1.2 3.6 1.3 1.0 5.2 9.0 3.0 18.0 2.9 3.0 4.1 15.0 3.0
Carbo
hydrate (g·)
0.1 0.2 0.7 0.6 0.5 0.5 0.6 0.5 0.8 0.8 0.7 0.7 0.3 0.8 0.2 0.7 0.1 1.0 1.5 1.5 0.7 0.7 2.4 5.6 2.5 5.1 2.1 0.5 0.4 0.7 0.7 0.3 0.2 0.2 0 0.8 0
Ash (g·) 1.7 1.2 0.6 1.2 0.9 1.0 1.4 1.0 1.2 1.2 1.3 1.3 1.5 1.2 1.3 1.3 1.4 1.0 2.0 1.4 1.1 2.0 1.8 1.6 1.5 1.7 1.2 1.2 1.4 1.3 1.3 1.0 3.0 4.3 1.3 6.2 1.0
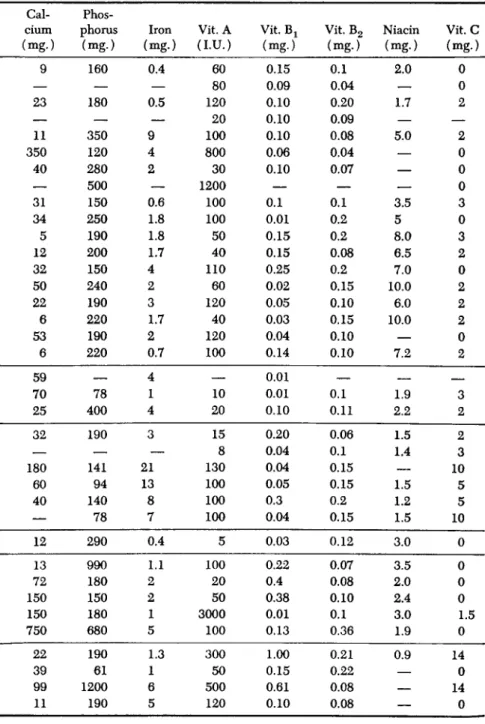
TABLE VII (Continued)
Cal Phos
cium phorus Iron Vit. A Vit. Bx Vit. B2 Niacin Vit.C (mg.) (mg.) (mg.) d . U . ) (mg.) (mg.) (mg.) (mg.)
9 160 0.4 60 0.15 0.1 2.0 0
— — — 80 0.09 0.04 — 0
23 180 0.5 120 0.10 0.20 1.7 2
— — — 20 0.10 0.09 — —
11 350 9 100 0.10 0.08 5.0 2
350 120 4 800 0.06 0.04 — 0
40 280 2 30 0.10 0.07 — 0
— 500 — 1200
—
——
031 150 0.6 100 0.1 0.1 3.5 3
34 250 1.8 100 0.01 0.2 5 0
5 190 1.8 50 0.15 0.2 8.0 3
12 200 1.7 40 0.15 0.08 6.5 2
32 150 4 110 0.25 0.2 7.0 0
50 240 2 60 0.02 0.15 10.0 2
22 190 3 120 0.05 0.10 6.0 2
6 220 1.7 40 0.03 0.15 10.0 2
53 190 2 120 0.04 0.10 — 0
6 220 0.7 100 0.14 0.10 7.2 2
59 — 4 — 0.01 — —
70 78 1 10 0.01 0.1 1.9 3
25 400 4 20 0.10 0.11 2.2 2
32 190 3 15 0.20 0.06 1.5 2
— — — 8 0.04 0.1 1.4 3
180 141 21 130 0.04 0.15 — 10
60 94 13 100 0.05 0.15 1.5 5
40 140 8 100 0.3 0.2 1.2 5
— 78 7 100 0.04 0.15 1.5 10
12 290 0.4 οι 0.03 0.12 3.0 0
13 990 1.1 100 0.22 0.07 3.5 0
72 180 2 20 0.4 0.08 2.0 0
150 150 2 50 0.38 0.10 2.4 0
150 180 1 3000 0.01 0.1 3.0 1.5
750 680 5 100 0.13 0.36 1.9 0
22 190 1.3 300 1.00 0.21 0.9 14
39 61 1 50 0.15 0.22 — 0
99 1200 6 500 0.61 0.08 — 14
11 190 5 120 0.10 0.08
—
0372 K. ARIMOTO
Skin, frequently eaten together with the flesh, is a good source of vitamin A.
IV. Seafood in the Diet
As stated above, many kinds of fish and shellfish are captured in large quantities, and there are quite a number of methods of cooking and processing. The following basic methods are those most commonly used in cooking and in the major processed products.
A. COOKING METHODS
1. Sashimi
This dish consists of raw fish. Head, bones, skin, and viscera are re- moved. The meat is sliced into appropriate pieces and eaten with soy sauce, mixed with spices or vinegar. The meat is served together with vegetables. Certain kinds of shellfish are also eaten in this manner.
2. Shioyaki
Viscera, and/or head and bones are removed. The flesh is sprinkled with a. little salt and then broiled over charcoal fire and served. Nowa- days, electricity and gas are frequently used in place of the charcoal.
3. Teri-yaki
Viscera, head, and bones of fish are removed. The fish is then dipped in a mixture of soy sauce and sugar long enough to allow the meat to become soaked with the mixture. The fish is broiled lightly over fire, and again dipped into the mixture. This is repeated until the meat is well done. Tuna and skipjack are often cooked in this way.
4. Nizakana
Viscera and/or head and bones are removed. The fish is cooked in soy sauce, mixed with a little sugar. This method, together with "shio- yaki," is the most common way of preparing fish.
5. Mushizakana
tresh fish or shellfish is boiled and eaten with a mixture of vinegar, soy sauce, or other seasoning sauce. Sometimes salt, sake (Japanese wine), or soy sauce is sprinkled on the fish prior to the boiling.
6. Tempura
A thick mixture of flour, egg, and water (water content 65 to 70 % ) is prepared separately. The eviscerated fish or shellfish is well covered
with this mixture and then fried in boiling vegetable oil. It is served hot and eaten with a dressing made from soy sauce, sugar, or salt. When the fish is oil-fried with the bones and the head remaining, and sometimes the viscera also, the method is termed "karaage." The oil temperature employed is 150° to 200°C.
B. MANUFACTURED AND PROCESSED PRODUCTS
In addition to the above-mentioned methods for preparing fish, a number of fishery products are available, which are manufactured indus- trially, as frozen, dried, canned, smoked, or salted. It is common practice to remove the salt before cooking. Dried products include those which are direcdy dried and those which prior to drying have been cooked, broiled, or salted.
1. Dried Products
One typical dried product is "katsuobushi." This is skipjack, which, after the viscera, head, and bones have been removed, is cooked in water, peeled of skin, then dried in the flame of burning hardwood for about 40 min. at a temperature of about 85 °C. The drying is combined with a standing period, and the process may be repeated from ten to fifteen times. About 20 days is required for completion of the process.
The fish is then kept in a special box or barrel closed tightly about 2 weeks for molding. After mold has formed on the surface of the meat, the fish is removed and dried in the sun 1 or 2 days. Such procedure of molding is repeated about four times, requiring nearly 3 months.
Through the repeated drying and molding, the product develops a peculiar flavor and taste. Aspergillus glaucus is the chief mold used for inoculation.
"Katsuobushi" differs slightly from other dried fish products in its use. It is used chiefly as a kind of seasoning in the form of thin flakes or powder used in preparation of soup. It is rarely eaten by itself. Fish other than skipjack may be used for "katsuobushi," but their products are inferior in flavor and taste. Freshness of fish and contents of fat in the flesh determine the quality of the product.
Another special method is boil-drying, meaning a drying of the fish after boiling a few minutes in water. Products of this type ("niboshi") are peculiar to Japan and are hardly seen in any other Eastern countries, or in Southeast Asia. The boiling prior to drying can be regarded as a measure to kill spoilage bacteria. Another advantage is the release of water followed by the coagulation of the muscle protein. Fish treated this way dry faster than nonboiled fish. Both sardines and anchovies are processed predominantly into such boil-dried products.
374 K. ARiMOTO
Another dried product is "asakusanori" or laver known to exist as early as the sixteenth century. The seaweed is dried in paper-thin sheets.
It is mostly cultivated nowadays. Good-quality laver contains 30%
protein and 15% carbohydrate on a moisture-free basis.
2. Kamaboko
"Kamaboko" is a steamed fish paste. It is made by grinding fish meat and adding salt and sugar as seasoning. The product is finally steamed and molded in varying shapes. Sometimes it is baked. Starch may also be added to the fish meat. It is sometimes erroneously called fish cake in Western publications; fish jelly would be more appropriate. This product is chiefly made from croaker, lizard fish, and conger eel.
3. Sausages
Fish sausages were mentioned earlier and are a relatively new prod- uct. This industry started as late as 1954, but the annual output now exceeds 400,000 metric tons. The manufacturing process corresponds closely to that of "kamaboki." The grinding and kneading process is similar. The chief diiference is in the choice of raw fish. Even such pigment-rich fish as tuna, albacore, and black marlin may be employed and are even favored for this purpose, as their pigments render a meat- like appearance to the product. Whale meat is also used in the making of fish sausages.
Large-sized manufacturing plants have a daily output of more than 300 tons of such sausages per day.
4. Whale Meat
Whale meat is processed in Antarctic waters on board factory ships.
Approximately 30,000 tons of both lean and fat meat are frozen in slabs (30 kg.) and sent back for further processing.
5. Canned Products
The leading canned products are tuna and skipjack. Half of the pack is exported. Albacore is referred to as white meat tuna; all others, in- cluding yellowfin, bluefin, and skipjack, fall into the light meat category.
Canned Pacific saury has been developed since the 1950 season. Two packs are available—with and without tomato sauce.
Canned Pacific are frequently packed with vegetables and sometimes seasoned with soy sauce and other flavoring matter. Ginger, red pepper, and certain condiments are commonly used spices in canned fish, and such products are served as a side dish to a rice meal.
6. Salted Products
A specially salt-dried fish is "kusaya." This brine has old traditions and is never completely removed, but stored from year to year. Both hard and light salted products are available.
7. Specialties
There are many kinds of seasoned seafood products such as
"tsukudani," "tsukemono," and "skiokara."
"Tsukudanf is a preserved product made of small fishes or shellfish cooked for a long period in soy sauce with much sugar. There are many kinds of "tsukemono." The cooked fish is subsequently preserved in
"miso," rice bran, sake wine, or vinegar. This product is also manufac
tured industrially (150,000 metric tons per year).
"Shiokara" is rich in nutrients. Salt is added to a mixture of the viscera, muscle, and ovary of fish or shellfish. The mixture undergoes auto- oxidation or fermentation, thus giving a unique taste. It is frequently made from squid or sea urchin. From the former, the liver and muscle are used with salt and mold (Aspergillus oryzae) and from the latter the ovaries, rich in vitamin A, are used.