MŰHELYTANULMÁNYOK DISCUSSION PAPERS
INSTITUTE OF ECONOMICS, CENTRE FOR ECONOMIC AND REGIONAL STUDIES, HUNGARIAN ACADEMY OF SCIENCES - BUDAPEST, 2018
MT-DP – 2018/21
The geopolitical impact of Nord Stream 2
BALÁZS R. SZIKLAI LÁSZLÓ Á. KÓCZY
DÁVID CSERCSIK
2
Discussion papers MT-DP – 2018/21
Institute of Economics, Centre for Economic and Regional Studies, Hungarian Academy of Sciences
KTI/IE Discussion Papers are circulated to promote discussion and provoque comments.
Any references to discussion papers should clearly state that the paper is preliminary.
Materials published in this series may subject to further publication.
The geopolitical impact of Nord Stream 2
Authors:
László Á Kóczy senior research fellow Game Theory Research Group
Centre for Economic and Regional Studies, Hungarian Academy of Sciences and Keleti Faculty of Business and Management, Óbuda University, Budapest
E-mail: koczy.laszlo@krtk.mta.hu
Balázs Sziklai research fellow
Game Theory Research Group
Centre for Economic and Regional Studies, Hungarian Academy of Sciences and Corvinus University of Budapest
Department of Operations Research and Actuarial Sciences E-mail: sziklai.balazs@krtk.mta.hu
Csercsik Dávid
Pázmány Péter Catholic University Budapest
csercsik@itk.ppke.hu
September 2018
3
The geopolitical impact of Nord Stream 2 Balázs R. Sziklai - László Á. Kóczy - Dávid Csercsik
Abstract
We investigate the geopolitical impact and the possible consequences of the construction of the Nord Stream 2 pipeline. We model the European gas network as a cooperative game between regions as players over the pipeline network, where LNG is also treated as a separate player. We focus on the change of influence of the players in three different scenarios. We investigate how the power of the agents shift when the Nord Stream pipeline is expanded, when the Ukrainian pipeline is shut down and finally when both of these happen. Our calculations show that when Nord Stream 2 is operational, Russia and Western Europe improve their position compared to the base scenario, while other suppliers, notably Norway, together with Central, Eastern and Southern Europe suffer losses, especially when the Ukrainian route is dismissed. The results highlight that both the supporters and adversaries of Nord Stream 2 are governed by self-interest and solidarity and trust, the values proclaimed by the EU and the Energy Union, remain but a slogan.
Keywords: gas supply, pipeline network, Shapley value, cooperative games, Nord Stream
JEL: C61, Q40
4
Az Északi Áramlat 2 geopolitikai hatásai Sziklai R. Balázs - Kóczy Á. László - Csercsik Dávid
Összefoglaló
Tanulmányunkban az Északi Áramlat 2 gázvezeték geopolitikai vonatkozásait vizsgáljuk. Az európai gázhálózatot egy kooperatív játékként modellezzük, ahol a játékosoknak az egyes régiók felelnek meg, és ahol az LNG-t (cseppfolyós földgáz) is egy külön játékosként kezeljük. A játékosok alkupozíciójának változását követjük nyomon három lehetséges forgatókönyvet megvizsgálva. Megnézzük, hogyan változnak az alkupozíciók, ha az Északi Áramlat vezetéket kibővítik, ha az ukrán tranzitútvonal leáll, illetve ha mindkét esemény bekövetkezik. Számításaink azt mutatják, hogy ha az Északi Áramlat 2-t üzembe helyezik, akkor Oroszország és Nyugat-Európa javít a pozícióján, miközben a többi szállító ország – beleértve Norvégiát, valamint Közép- és Dél-Európát – jelentős veszteségeket könyvelhetnek el, különösen ha az ukrán tranzit is leáll. Az eredmények azt mutatják, hogy mind a projekt támogatói, mind az ellenzői csak a saját hasznukat nézik, és az EU, valamint az Energiaunió által hirdetett értékek – mint a bizalom és szolidaritás – csupán üres jelszavak.
Tárgyszavak: gázellátás, gázhálózatok, Shapley-érték, kooperatív játék, Északi Áramlat
JEL: C61, Q40
The geopolitical impact of Nord Stream 2
Balázs R. Sziklai∗, László Á. Kóczy∗∗, and Dávid Csercsik∗∗∗,
abstract
We investigate the geopolitical impact and the possible consequences of the construction of the Nord Stream 2 pipeline. We model the European gas network as a cooperative game between regions as players over the pipeline network, where LNG is also treated as a separate player. We focus on the change of influence of the players in three different scenarios. We investigate how the power of the agents shift when the Nord Stream pipeline is expanded, when the Ukrainian pipeline is shut down and finally when both of these happen. Our calculations show that when Nord Stream 2 is operational, Russia and Western Europe improve their position compared to the base scenario, while other suppliers, notably Norway, together with Central- Eastern- and Southern Europe suffer losses, especially when the Ukrainian route is dismissed. The results highlight that both the supporters and adversaries of Nord Stream 2 are governed by self-interest and solidarity and trust, the values proclaimed by the EU and the Energy Union, remain but a slogan.
Keywords: Gas supply, Pipeline network, Shapley value, Cooperative games, Nord Stream.
http://www.example.com
1. INTRODUCTION
Satisfying Europe’s hunger for energy has always been a difficulty. Despite efforts to increase the use of renewable sources, with the increasing sentiment against nuclear energy, reliance on fossil fuels is more important than ever. Natural gas is, in particular, a very versatile energy source with extensive industrial and domestic uses. Nearly three-quarters of the European Unions natural gas consumption is imported and 40% of the total import comes from Russia.
To combat this weakness, the European Union (EU) has established a strategic plan for secure, affordable and environmentally-friendly energy for all its citizens. As part of this plan the Third Energy Package, adopted in 2009, has the goal to open up the internal electricity and gas markets of the European Union. It pushes for a separation of energy production and transmission, stipulates the establishment of national regulatory authorities and creates the Agency for the Cooperation of Energy Regulators. Solidarityin energy matters is a key point in the Treaty on the Functioning of the European Union as well as in the Energy Union. In fact, the first point of the EU’s energy union strategy is: security, solidarity and trust1. In the 2014 Energy Security Strategy Communication the European Commission clearly declared how this should be interpreted.
“Government interventions that affect this market framework, such as national decisions on renewable energy or efficiency targets, decisions to support investment in (or decom- missioning of) nuclear generation, or decisions to support key infrastructure projects
∗Corresponding author. Centre for Economic and Regional Studies, Hungarian Academy of Sciences and Corvinus University of Budapest E-mail: sziklai.balazs@krtk.mta.hu.
∗∗Centre for Economic and Regional Studies, Hungarian Academy of Sciences and Óbuda University E-mail:
koczy@krtk.mta.hu
∗∗∗Pázmány Péter Catholic University E-mail: csercsik@itk.ppke.hu
1Seehttps://ec.europa.eu/commission/priorities/energy-union-and-climate_en.
1
(such as Nord Stream, South Stream, TAP or a Baltic LNG terminal) need to be discussed at European and/or regional level to ensure that decisions in one member state do not undermine security of supply in another member state.” (European Commission, 2014)
Natural gas is commonly transported via a network of national and international pipelines.
The Nord Stream pipeline, which connects Russia and Germany, respectively the largest supplier and consumer in Europe, became operational in 2011. Nord Stream 1 already led to political tensions within the EU as Central European Member States viewed it as a Trojan horse, a way to undermine the region’s diversification efforts (EPSC, 2016). The EU introduced restrictions allowing the pipeline to be utilized at only half of its capacity, 27.5 from 55 billion cubic metres (bcm), but recently the limitations were lifted, the utilization reached 93% by 2017. At the same time negotiations started over doubling Nord Stream yearly transmission capacity to 110 bcm. In March 2018, the project received all the required permits to begin construction, and Gazprom expects the pipeline to be operational by the end of 2019. We study the consequences of opening Nord Stream 2.
Propagators of Nord Stream 2 argue that the project has sound commercial reasons.
⊕ The EU’s production capacities are declining, while demand is on the rise.
⊕ Nord Stream 2 helps to lower gas prices in the EU.
⊕ Key pipelines in Ukraine are reaching the end of their service life and lack viable alternatives.
⊕ Ends the uncertainty of the Ukrainian transit route.
What are the main argumentsagainstthe project?
Incompatible with the Energy Union’s strategic goals and with the Third Energy Package.
Does not diversify the EU’s energy supply.
Adds to an infrastructure overcapacity in the EU.
Undermines the economic sanctions towards Russia.
Let us elaborate on the above points.
Due to the 2008 financial crisis and the subsequent recession demand for natural gas declined in Europe in the 2010-2013 period. A key element was the migration of manufacturing industry to other world regions, but the lack of population growth and high gas prices contributed to the effect. Although there is currently an oversupply in the market, the trend has already reversed. Asia continuously diverts the LNG production surplus, while the US shale gas with its high variable cost and high sensitivity to LNG market prices cannot currently compete with the cheap Russian gas.
Honoré (2014) predicts that demand will exceed the 2010 level by 10%. Together with the shrinking local production this amounts up to an additional 50-120 bcm yearly consumption compared to the current level. Nord Stream 2 aims to close this gap.
Russian authorities claim that renovating Ukrainian lines would cost more thane9.5 billion, the construction cost of Nord Stream 2. The new route is also shorter and much more efficient due to the inner pipeline coating which reduces friction and lowers the amount of compression needed to push the gas through, making Nord Stream 2 a cheaper alternative (Barnes, 2017). Alternative routes like the planned Southern Gas Corridor, which supposes to bring natural gas from Azerbaijan to Europe, are too small to make any difference. As a result of lower average EU gas prices, Hecking and Weiser (2017) prognosticate a total welfare benefit for the EU-28 betweene13 ande35 billion per annum. Gazprom has also signed a contract with five European energy companies that lend half of the money, suggesting that the pipeline is commercially viable although four out of these five (Uniper, Wintershall - Germany, Engie - France, Shell - United Kingdom/Netherlands) are based in countries, that are clear beneficiaries of the project (cf. Table 2; the fifth firm being the Austrian OMV).
3 /The Energy Journal
On the other hand, Nord Stream 2 received harsh criticism from both sides of the Atlantic. In March 2016, eight EU leaders, the prime ministers of the Czech Republic, Estonia, Hungary, Latvia, Poland, Slovakia and Romania and the president of Lithuania have signed a letter objecting the Nord Stream 2 project. The letter warns, that Nord Stream 2 would generate “potentially destabilizing geopolitical consequences.” A European Parliament resolution adopted in the same year, describes Nord Stream 2 as harmful to energy security, diversification and European solidarity (European Parliament, 2016). According to the European Political Strategy Centre, the European Commission’s in-house think tank “Nord Stream 2, seen from a common EU perspective, is a project with neither economic rationale nor political backing” (EPSC, 2016). Riley (2016) argues that Nord Stream 2 threatens to plunge the Central Eastern European states back into a pre-2004 market of greater supply security risk and greater Russian leverage in their markets.
Ukraine alone is to lose an estimated $2 billion from transfer fees and, to a lesser extent, the EU members Slovakia, Hungary and Poland would be also harmed by Nord Stream 2 (Fischer, 2016)
— violating the principle of solidarity of Treaty on the Functioning of the European Union. It is not clear whether the rules of the Third Energy Package can be applied to an offshore pipeline (Riley, 2016). The European Commission has therefore proposed to explicitly extend EU internal energy market rules to cover offshore gas pipelines, but the legal services of the Council has opposed the legislative proposal. Note that the five EU countries participating in the construction have enough votes in the Council to form a blocking minority.
EPSC (2016) points out that there is an infrastructure overcapacity in the EU in the sense that it currently imports less than half the gas that it could when using all available existing infrastructure.
The new pipeline does not diversify the EU’s energy supply neither from an energy source perspective nor from a route perspective as (i) Russia is already the main supplier of Europe and (ii) the pipeline would lead to a concentration of routes in the Baltic corridor.
Similar concerns have been expressed by senior figures in the U.S. administration.
Both narratives have compelling elements, and both are true to some extent. As (Fischer, 2016) put it, the EU has to decide on what should drive its natural gas policies: the market approach or the geopolitical approach. In this paper, we aim to answer whether the concerns are well-founded or not. We model the European gas network as a cooperative game and numerically assess the influence of the stakeholders in the different scenarios.
The structure of the paper is accordingly. After a brief literature overview, we introduce our model, and explain the limitations. Next we discuss the data we have used and present the main findings. Finally, we discuss the possible network development alternatives in the conclusion.
2. LITERATURE OVERVIEW
The cooperative game theoretic approach in studying natural gas networks was pioneered by (Hubert and Ikonnikova, 2011), and was soon followed by a number of papers that analyzed different segments of the European and Central Asian markets. Roson and Hubert (2015) presents a detailed discussion of bargaining games on network markets.
Hubert and Ikonnikova (2011) analyze how Russian natural gas reaches the European market through the Eastern-European gas network, and derived bargaining power by calculating the Shapley-value for the stakeholders. The scope of the paper is limited to seven countries, among which Russia was the only supplier. Hubert and Coblani (2015) extend this framework to a full scale analysis of the European network. They compare three scenarios corresponding to the Nord Stream 1, Nabucco, and the South Stream pipeline projects. They construct a cooperative game by calculating profits of coalitions. In contrast, we focus on how much cost a coalition cansaveby cooperation. An even more important difference is, that instead of optimizing the network flows of a coalition in one step, we do it iteratively country-after-country according to a certain order. We do this in order to obtain a more fitting model of the gas market, where long term bilateral contracts are still dominant.
Copyright © 2016 by the IAEE. All rights reserved.
One advantage of this approach is that flows corresponding to the consumption of individual countries can be distinguished in this way.
Cobanli (2014) also uses the cooperative approach to assess the bargaining power of Central Asian countries. He considers various projects, both East- and Westbound2, and concludes that there is no demand competition between Europe and China.
Non-cooperative models of the European natural gas market have also been applied in a number of papers. Cachon and Netessine (2004) provide an introduction to game theory models for supply chains in general. Oligopolistic modelling has been applied by Boots et al. (2004), Holz et al.
(2008) and recently by Abada et al. (2013). There are a number of highly detailed numerical models:
The EUGAS model by (Perner and Seeliger, 2004); the TIGER model developed by EWI Institute in Cologne (Petrovich et al., 2016; Lochner, 2011); the ambitious World Gas Model (Egging et al., 2010).
Apart from the above mentioned papers, there are a few others that offer scenario analyses:
Mitrova et al. (2016) reviews a number of scenarios, including the disruption of the Ukrainian transit, and conclude that the European gas mix is fairly robust, and will include a significant share of natural gas from Russia in all scenarios under study. Lochner and Bothe (2007) analyses the impact of Nord Stream 1 and forecasts that the project will mainly lead to a cannibalization of transport volumes on the traditional transit pipelines.
3. MODEL
In this section, we describe our model. We begin by identifying the stakeholders of the gas market with countries. This assumption may seem like an oversimplification, but considering the strategic importance of managing gas supply it seems fair to assume that production, transportation and consumption are coordinated at the national level in each country.
3.1 Notation
Each country is represented by a node and the pipelines connecting countries are the arcs of the network. The set of nodes is denoted byN,|N|=nwith a generic element denoted byiorj. Nodes are also referred as players and a subsetS ⊆Nis called a coalition. The set of arcs is denoted byL,
|L|=mwith generic element`.
Now, we turn to the physical characteristics of the network. The network itself is described by an incidence matrixA∈Rn×mwhereAi`=−1 andAj`=1 means that arc`runs from nodeitoj.
Each node is characterised by a demand and a production value,d0∈Rn+denotes the vector of demands ands0 ∈R+nthe vector of (maximum) supplies. In the following we modify these to obtain the net demand and net production vectors,d,s∈R+n: There are fundamentally two types of regions: those where the production capacity is higher than the domestic demand and those where it is not. In the first group we assume that domestic consumption is fully satisfied by domestic production, and domestic production is reduced by this amount. In the latter the domestic consumption uses up all the production and the net import is the remaining part. What happens to these countries if they cannot import enough gas to satisfy demand? We assume that they have a virtual energy source that can satisfy all residual demand, but this alternative is more expensive. One interpretation could be that this is really another energy source, but we can also interpret this as the loss due to unsatisfied demand. Therefore
di=(di0−si0)+ and si = di0−si0
(1)
where(·)+denotes the positive part, that is(x)+=max{x,0}for anyx∈R. Production has different costs in different countries, in particular, the alternative energy source has a unit price ¯pthat is (much)
2Including the TAP, TANAP and TCP projects, which we also review in Section 6.
5 /The Energy Journal
higher than the cost at any of the producers. The production cost vector is denoted byp∈R+mwhere pi =p¯ifdi0>s0i. Note, that ifdi0 >s0i, then countryihas no real excess supply, stillsi is positive - in this case this amount signifies the supply of the alternative energy source. This technical detail ensures that each country can satisfy its own demand albeit in this case at a higher price.
Edges, representing the pipelines are characterised by a maximal transfer capacity. The vector of transfer capacities is denoted byq. Transporting gas over these pipelines has its costs. A pipeline may travel across several regions and therefore it is convenient to define costs by a cost matrix C ∈Rn+×mwhereCi jis the cost of transferring a unit gas over pipelinejoccurring in regioni.
3.2 Power
Our goal is twofold: for each region we look for the lowest cost possible to satisfy its needs in natural gas. Cost can be interpreted in a more general sense and our focus turns tocost savings. Our interest lies in the players’ ability to reduce costs. Their contributions to a coalition can be one or more of the following types: production, consumption and transit.
1. A new, inexpensive source is the most obvious way to reduce costs by replacing some of the more expensive sources. By our assumption, all players can satisfy demand by alternative energy forms if no gas is available, so the first contribution is to replace these alternative forms.
2. Producers cannot reduce costs unless there is demand. A consumer would normally use its own alternative sources; in cooperation these alternative sources are replaced by natural gas, thereby saving costs. Therefore demand is another great way to reduce costs.
3. Finally, gas must travel from producers to consumers. Transit countries link producers and consumers making the aforementioned savings possible. Even if there is a connection already, a less expensive connection is a great way to reduce costs.
Where do all these savings go? If we regard the problem as an optimisation problem, the optimum tells us the minimal cost of supplying members of the coalition with natural gas. But why should only consumers benefit from the savings? When a coalition forms, members join one-by-one, and each member contributes a non-negative amount to the cost saving. Existing members are not harmed if (almost all) of this saving is kept by the new entrant. Considering all possible orders we can calculate the average marginal contribution to cost saving of each of the members of the coalition – or the Shapley-value, as it is known (Shapley, 1953).
Formally, we consider a function on the power set of playersc: 2N →Rthat gives the costc(S)of supplying all the demand in the coalitionS ⊆ N. We also define a coalitional game with transferable utility given by a pair(N,v)whereN is the set of players andv: 2N → Ris a characteristic function that gives the value
v(S)=Õ
i∈S
c({i}) −c(S), (2)
that is, the cost saving of each coalition compared to the case where each country acts as a singleton.
The Shapley-value of a playeri, denoted byφi(v)can be calculated as follows:
φi(v)= Õ
S⊂N,S=i
|S|!(|N\S| −1)!
|N|! (v(S∪ {i}) −v(S))
Calculating the Shapley-value allows us to see the power distribution in the European natural gas market, but much of the power is simply due to the size of countries. It is more interesting to see how the power distributionchangeswith the network: what is the effect of new pipelines built, who gain and who lose with them. Similarly, the closing of certain pipelines may harm some, but may benefit others.
Copyright © 2016 by the IAEE. All rights reserved.
3.3 Optimal flows
We are interested in optimal flows over the network. What is optimal? Under the first best approach we minimise the overall cost of satisfying all demand. This is primarily done by transporting supplied gas to the demand, but lack of production or transportation capacities may mean that some of the demand is satisfied using alternative sources.
Under this optimum the flow over the pipelines is given, but in the case of multiple sources it is not clear in general which gas molecules turn left or right at a node. Hence, we can not necessarily distinguish between the flows of individual countries. We assume that flows from cheaper sources are directed towards countries with high bargaining power. In practice this means that “strong” players grab the less expensive sources and the remaining supply is shared among the rest. This bargaining power depends on the size of the market, i.e. on the demand of the players. Notice, however that if strong players grab cheap sources first, we may run out of transfer capacity too soon making some weaker players unable to use optimal, inexpensive sources. The overall cost will therefore increase, giving us a second best solution: In the bargaining order countries satisfy demand at the lowest possible cost using the available sources and transport capacities; this consumption is removed from the market and for the next player the flows are calculated using residual production and transfer capacities and so on.
Similar calculations are also possible when only a subsetSof players participate in the network. In this case the optimisation is restricted to the supply of the elements ofS using the production and transportation capacities ofS. The latter condition also implies that only pipelines where both endpoints belong to the coalition can be used. We do not exclude pipelines that travel through regions. Using these calculations the total cost of supplying the coalition can be determined.
Comparing this cost to the individual (singleton) costs of gas supply we obtain the cost saving due to cooperation.
The iterative method we described here stands in contrast with the approach of Hubert and Ikonnikova (2011); Hubert and Coblani (2015) and Cobanli (2014), where the optimal flows for each coalition is calculated in one step. The natural gas market is driven by long-term contracts. Suppliers negotiate with each consumer one-by-one. Here we assume that bigger markets have priority over smaller ones. In case of a capacity shortage this seemingly technical detail makes a difference. In addition, we can distinguish between the flows of each player, even when they are integrated in a coalition. Hence, the individual cost can be accounted for, which is helpful if we want to keep track which region benefits from the cheap Russian gas.
Formally, let f`+∈R+denote the flow in the positive direction over edge`, and let f`−∈R+
denote flow in the opposite direction, f+is the vector of positive directional flows on all edges while f−is the vector of negative directional flows on all edges. LetI∈R+ndenote the inlet values at the nodes. The variable vector is then
x=©
« f+ f− I
ª
®
¬
∈R2m+n+ . (3)
LeteiandeSdenoten-dimensional indicator vectors for playeriand coalitionS, respectively:
eik =
(1 ifk=i
0 otherwise and eSk =
(1 ifk∈S 0 otherwise.
LetESdenote a diagonal matrix witheSover the diagonal, let 1ndenote ann-dimensional vector of 1’s, letIk×kdenote akdimensional identity matrix, and let 0k×ldenote ak×l-dimensional 0 matrix.
We now describe the linear programming problem and then interpret the constraints. We
7 /The Energy Journal
minimise the cost of supplying playeriin coalitionS:
minx
1>nC 1>nC p>
x (4)
such that
A A ES
x=diei (5)
Ij ≤sj (6)
I2m×2m 02m×n x≤
q+ q−
(7)
x≥0 (8)
The objective function and the constraints are, actually, rather straightforward. We want to minimise the total cost that is the sum of the transportation costs in the positive direction, the transportation costs in the negative direction and the cost of gas itself. Naturally, gas does not flow over the same pipeline in both directions, it is only for the purposes of calculation that we separated the two flows. The first constraint explains that no gas is lost at any of the nodes: the total of inputs, inflows, outflows must add up to the consumption that is zero except for playeri. Inputs cannot exceed the supply capacities. The last condition merely insists on positivity. Finally constraint 7 explains that the flows must not exceed transmission capacities. Initially3, we setq+=q−=q. Then in each round we recalculate the capacities. If over pipeline jthe two capacities have beenq+j andq−j and a flowf was allocated, then the capacity in the positive direction becomes smaller: q+j −f, but at the same time the capacity in the opposite direction has been expanded toq−j + f. The reason is that any flow in the opposite direction would be realised by reducing flow in this direction. This, of course relies on the assumption that gas is commodity where molecules are not labelled. We return to this assumption in the last section.
Let us summarize how the value of coalitionv(S), is computed.
1. For eachi ∈ S we compute the country’s singleton costc(i), which is just ¯ptimes its net consumptiondi.
2. In the predefined order (which depends ondi) we compute the individual costs of the countries using the above LP iteratively. After each iteration we update the network (i.e. the flows and capacities).
3. We setv(S)=Í
i∈Sc({i}) −c(S)wherec(S)is the sum of the individual costs computed in Step 2.
4. DATA AND CALCULATIONS
We study the European gas transit network and our interest lies in determining the positions of countries and regions in this network. Our focus is on the international connections, our network links corresponding to international pipelines and nodes to countries or regions. In reality countries have an extensive network of gas pipelines with a few international pipelines connecting the national networks. This requires a number of simplifications and in the following we outline the steps we had to take to make the network manageable.
3Each pipeline has a characteristic transmission capacity in each direction: these are rarely symmetric. We could use these different capacities. Note, however, that necessary compression facilities to inverse the flow can be built at a relatively small cost. We therefore chose to consider the maximum of the two capacities and calculate less constrained optima.
Copyright © 2016 by the IAEE. All rights reserved.
4.1 Network simplifications
In our model we assume that each player corresponds to a node — this must correspond to a single location on the map. The link connecting these nodes is then a combination of the international pipeline plus the segments of the national network connecting the entry point with this idealised geographical location. Since players are typically countries, the geographical location is often very trivial, it is the main gas distribution hub of the country. There are some exceptions:
• Germany has a circular distribution network with hubs on the North and on the South. To avoid representing Germany with two nodes — and therefore with two players — we picked an idealised point near the centre of the country, Frankfurt and estimated internal pipeline-distances thereto.
• Italy is a long country with a hub in the North and one in the South. By the same argument we picked a single node at Rome.
• Russia typically works with delivery prices. For a better comparison we modified these to the price at the border (subtracting the transportation costs at public prices). There is no benefit in further modifying to some hypothetical location subtracting the costs of internal transportation – only to add them back in the calculations. The same applies to North-Africa, taken as a single
player.
While the LP program is simple and runs fast we had to do these optimisation rounds very many times where even small differences in speed matter. This is even more true for the calculation of the Shapley-value, that cannot be done in polynomial complexity. Therefore we chose to simplify the map a little — and then more drastically — in two steps. In the first step we looked for countries that are linked to only one other country or whose network is oriented towards a neighbour’s.
In the first round we have merged Iberia (Spain and Portugal), the BeNeLux states (Belgium, Netherlands, Luxembourg), the Baltics (Estonia, Latvia, Lithuania), the British Isles (Great Britain plus Ireland), Romania and Moldavia, Germany and Switzerland and finally Central Asia (Azerbaijan, Georgia, Kazakhstanand the Eastern part of Turkey). The latter requires some explanation. Our focus is on international pipelines as it is generally assumed that these form the bottlenecks of gas transport.
The exception is Turkey where there are abundant sources from Central Asia in the Eastern part, high demand in the Western part (the Istanbul area), but the current connection has a very low capacity.
We therefore assume that the demand on the Eastern part is fully satisfied by the nearby production as if it were part of the internal market there and the low capacity internal pipeline becomes a link in our network.
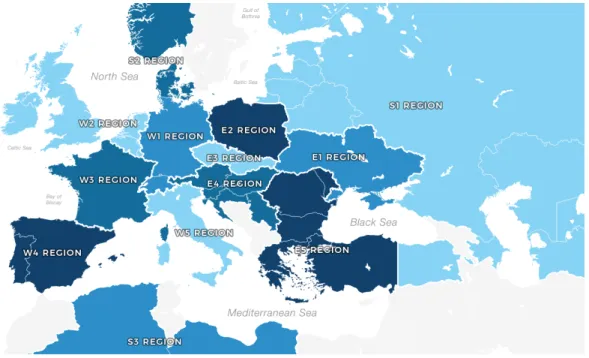
For the calculation of the Shapley-values we take this simplified network and simplify it even further: countries or country groups are merged into larger superplayers. It is important to stress that we do not change the underlying pipeline network, only the players. The resulting regions are depicted in Figure 1.
Pipelines constitute the other component of the network. While there may be specific costs to using each pipeline, as a simplification we assume that the transportation costs are uniform, proportional to the volume and to the length of the pipeline. This is convenient to estimate the cost of virtual pipelines to idealised hubs or costs that are not publicly available, but is also in line with the mid-term goals in the European Union to liberalise access to (international) pipelines. We are aware of the difference between pipelines where costs only cover maintenance, and those still in the financing stage. Such differences could be introduced into our model by an appropriate adjustment of pipeline length, but it is also easy to generalise it to introduce heterogeneous transportation costs.
9 /The Energy Journal
Figure 1: Regions for calculating the Shapley-value
4.2 Liquefied Natural Gas
In the past years Liquefied Natural Gas (LNG) appeared as a new player on the European gas market.
Liquefying is an alternative transportation method with a very different cost structure. Gas is liquefied near the source and transported, typically by tankers to the destination LNG terminal. Since these tankers use the evaporated gas — actually, a loss — from their tanks, the transportation costs are negligible4. It is quite common to re-route tankers to another part of the world if the market conditions change.
On the other hand the required infrastructure is expensive, in fact, most of the cost is related to the infrastructure and the process of liquefying and gasifying. Since LNG tankers serve the entire world, supply depends very much on market conditions elsewhere. In the past East-Asia was the strongest market and capacities have been developed to serve this profitable market. Lately a combination of excess capacities and more favourable conditions in Europe meant that more LNG appeared on the European market. Initially to serve remote, poorly connected areas, but increasingly to input into the gas network for further transport over the pipeline network. The question is: how to include LNG sources?
In our approach we include LNG as a new player with zero consumption, a production corresponding to current LNG imports to Europe and links to every player with a significant LNG terminal. Assigning zero transportation costs over these links would create a wormhole in the network, connecting remote parts of the network with free pipelines. To avoid this, we say that the LNG transportation is expensive and correspondingly reduce the LNG price (cf. the length parameter of LNG terminals in Table 4). Overall this does not affect the cost of using LNG.
4At distances beyond 4000 km (ca. 2500 mi), the cost of delivering compressed natural gas becomes higher than the cost for LNG because of the disparity in the volumes of gas transported with the two technologies (Economides et al., 2006).
Copyright © 2016 by the IAEE. All rights reserved.
4.3 Producers’ prices
In our model we describe an idealised market, where producers have ‘shops’ where anyone can buy gas for the advertised price. The reality is somewhat different. Currently consumers purchase gas in two different ways. There are commodity exchanges at major pipeline hubs: here anyone can buy gas at the exchange, but transportation is subject to available capacities: the purchased gas is not located at the hub, it has to be transported from the source. However, the majority of consumption is via direct, long-term contracts for undisclosed prices. For such contracts the supplier takes responsibility for the delivery reserving transportation capacities for the long run. Undisclosed prices mean that producers may apply favouritism and directly differentiate between consumers. The European Union would like to move towards a more transparent market similar to the one modelled in this paper.
We also assume that these producers’ prices are fixed. In reality the market is oligopolistic, where producers are price makers. We may assume that the current prices are equilibrium prices that are robust to small changes, but it is not clear how they would react to major shocks. We have made some simulations using different gas prices for the three major suppliers. We found that the value of the objective function does not change much, but the supplied areas and presumably the individual producers’ profits change drastically.
4.4 Gas quality
We assume that the natural gas transported over the network is homogeneous. Gas coming from different sources will differ in calorific value by up to 10% (Chandra, 2006, Chapter 1). Interestingly, consumers pay for the energy content, while for transportation capacities and costs the volume must be considered. As a result better quality gas is a little less costly to transport. Taking calorific capacities into account seems feasible, but transporting gases of different qualities over the same pipeline segment can be difficult. Either we have to handle ‘cocktails’ or add a complex scheduling problem. Cancelling counter-directional flows over the same pipeline is also problematic as the gas quality may not be the same.
4.5 Power measure
We use the Shapley-value to calculate the power of the stakeholders. The nucleolus, another popular cooperative game theoretical solution concept introduced by Schmeidler (1969), is also a possible choice for measuring power in networks (Montero, 2013). The nucleolus is obtained through a lexicographic optimization process, where the profit of the poorest coalitions are maximized first. In this sense the nucleolus implements some kind of social justice. On the other hand the Shapley-value rewards productivity, as the players’ payoffs depend on their marginal contributions. Thus, it is not surprising that the Shapley-value proves to be a more reliable indicator of power in distribution networks (Hubert and Ikonnikova, 2011; Hubert and Coblani, 2015).
4.6 Alternative sources
When local production and imports are insufficient to cover demand some of the demand for natural gas must be directed to other energy sources. In some cases this may be relatively easy, but in others nearly impossible. Ideally such a model should take a detailed replacement cost-function into account.
In the absence of such information we have taken the replacement cost to be 600 M$/bcm. This is 2-3 times higher than the price of natural gas including transportation costs over the most extreme distances: consuming gas is always preferred even if it is far from the consumer. Our results proved to be robust to a wide range of replacement costs.
11 /The Energy Journal
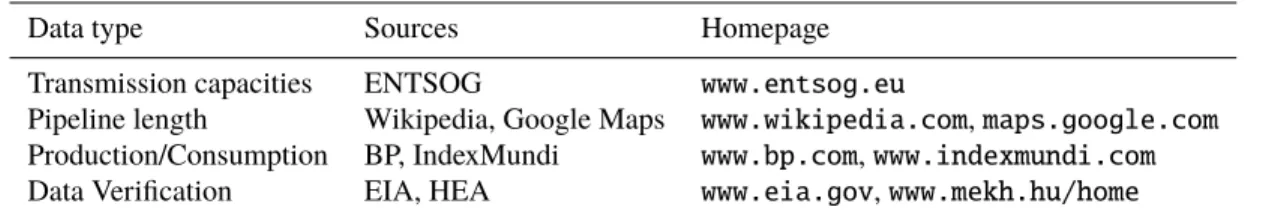
Table 1: Data sources
Data type Sources Homepage
Transmission capacities ENTSOG www.entsog.eu
Pipeline length Wikipedia, Google Maps www.wikipedia.com,maps.google.com Production/Consumption BP, IndexMundi www.bp.com,www.indexmundi.com
Data Verification EIA, HEA www.eia.gov,www.mekh.hu/home
4.7 Data sources and implementation
Fortunately, developments of the natural gas market are very well documented and data concerning national resources like oil and gas are published regularly by a number of reliable sources. Transmission capacities were mainly derived from the public database of the European Network of Transmission System Operators for Gas (ENTSOG). For consumption and production data we relied on the statistical yearbook of BP (2017). Some missing data was gathered from IndexMundi, which in turn seems to use the CIA Factbook as a source. Pipeline lengths were retrieved from various online sources, including but not limited to Wikipedia. In some rare situations when we had to estimate the pipeline length, like in the aforementioned case of Germany, we used a simple distance metric based on Google Maps. We used alternative sources to verify our database, like the U.S. Energy Information Administration and the private database of Hungarian Energy and Public Utility Regulatory Authority.
The reference year was chosen as 2016 since at the time of the analysis this year had the most complete data available. The data is provided in the appendix.
The model was implemented in the OPTI toolbox of MATLAB (Currie and Wilson, 2012), and the linear programming task was solved by the CLP solver, using the Dual simplex method (Vasilyev and Ivanitskiy, 2001).
5. RESULTS
We have made use of a number of simplifications to translate a complex economic, engineering and even political problem into a simple mathematical setting. The calculation of the Shapley-values is based on the simplified game with 14 players. Beyond an evaluation of the current network we have looked at two modifications.
Firstly, the 2009 Ukrainian gas crisis, when Russia stopped exports via Ukraine was a scary incident for many countries in Southeastern Europe. More recent events did not reduce Ukrainian-Russian tensions and the risk of a future crisis remains high. As these pipelines are nearing the end of their service life, in the absence of refurbishment plans, closing seems inevitable. Our first alternative scenario is therefore the stopping of all Russian (and Central-Asian) gas exports via Ukraine.
Perhaps the most important recent and future development of the network is the construction of the Nord Stream, the longest sub-sea pipeline in the world, directly connecting Russia and Germany over the Baltic Sea. Nord Stream is already fully operational and its capacity is planned to be doubled by 2019; our Nord Stream scenario looks at the network once the pipeline is completed. In the base scenario we still assume that only half of the capacity is used, as it was the case in the major part of 2016.
At last, we consider a combined scenario: what happens if the Nord Stream is fully developed and then the Ukrainian connection is shut down.
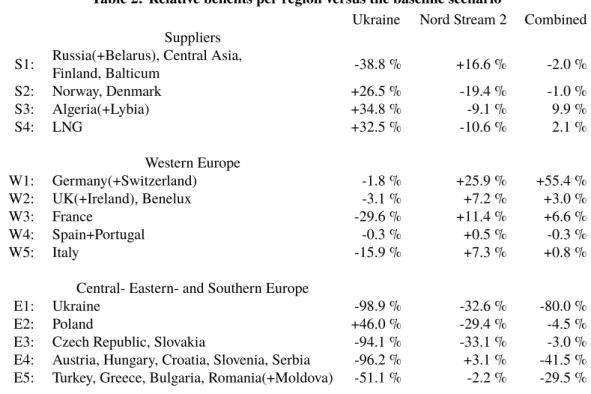
Our results are presented in Table 2. Since the figures include own consumption and are showing savings with respect to the artificial replacement costs, the absolute values are less interesting, it is better to focus onchanges. But what do these figures tell us?
Shutting down the connection via Ukraine harms Ukraine... but also Russia. It clearly affects
Copyright © 2016 by the IAEE. All rights reserved.
Table 2: Relative benefits per region versus the baseline scenario
Ukraine Nord Stream 2 Combined Suppliers
S1: Russia(+Belarus), Central Asia,
-38.8 % +16.6 % -2.0 %
Finland, Balticum
S2: Norway, Denmark +26.5 % -19.4 % -1.0 %
S3: Algeria(+Lybia) +34.8 % -9.1 % 9.9 %
S4: LNG +32.5 % -10.6 % 2.1 %
Western Europe
W1: Germany(+Switzerland) -1.8 % +25.9 % +55.4 %
W2: UK(+Ireland), Benelux -3.1 % +7.2 % +3.0 %
W3: France -29.6 % +11.4 % +6.6 %
W4: Spain+Portugal -0.3 % +0.5 % -0.3 %
W5: Italy -15.9 % +7.3 % +0.8 %
Central- Eastern- and Southern Europe
E1: Ukraine -98.9 % -32.6 % -80.0 %
E2: Poland +46.0 % -29.4 % -4.5 %
E3: Czech Republic, Slovakia -94.1 % -33.1 % -3.0 %
E4: Austria, Hungary, Croatia, Slovenia, Serbia -96.2 % +3.1 % -41.5 % E5: Turkey, Greece, Bulgaria, Romania(+Moldova) -51.1 % -2.2 % -29.5 %
Southeastern Europe negatively, since this area is supplied mostly by Russia, via Ukraine. On the other hand Norway, Algeria and the LNG suppliers come out positively, since they can be more competitive. Poland retains its position as an important transit country, but Slovakia and the Czech Republic lose this role.
Expanding Nord Stream brings more Russian gas on the market so we expect that hard to reach regions, such as the South Balkan are better off, but this does not seem to be the case. Most of the benefit goes to Russia and Germany, while other suppliers and transit countries get competitors:
Norway gets much cheap Russian gas right at its doorstep, Ukraine, and Poland on the other hand, can now be bypassed with most of the Russian gas export.
It is interesting to see how would a combination of these two changes affect the players. Since Russia can bypass Ukraine via Nord Stream, we expect that it becomes less important to maintain the connection via Ukraine’s Brotherhood pipeline. We find that the country that reaps the benefits is Germany: it gets a direct connection to cheap Russian gas, plus it becomes its main distributor in most of Europe. Central-, Eastern- and Southern Europe is harmed, although to different extent. Poland, Czech Republic and Slovakia are less affected, due to the fact that they remain transit countries. Only this time the flows are reversed: they provide Southern and Eastern Europe with cheap ‘Western’ gas.
On the other hand, Ukraine, Central Europe and the Balkans are severely harmed in this scenario.
If we consider Nord Stream 2 as a certainty and view the closing of the Ukrainian route as possibility occuring with some fix probability, then we can take the expected outcome of the Nord Stream 2 and Combined scenarios. Looking at the data like this, Russia and Western Europe come out as winners, while other suppliers and Eastern Europe suffer massive losses. From this viewpoint, the political stance of the protesting Eastern European countries seems perfectly logical.
6. DISCUSSION
Our analysis shows that each country in Europe is governed by self interest. Russia and Germany are the main beneficiaries and supporters of the Nord Stream 2 project. Northeast Europe, namely, Poland, Ukraine, Czech Republic and Slovakia oppose it because they will lose their advantage as transit
13 /The Energy Journal
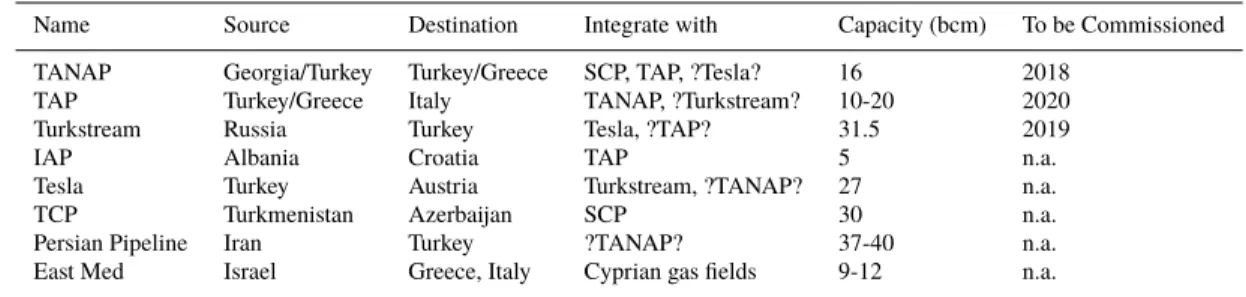
Table 3: Possible pipeline projects
Name Source Destination Integrate with Capacity (bcm) To be Commissioned
TANAP Georgia/Turkey Turkey/Greece SCP, TAP, ?Tesla? 16 2018
TAP Turkey/Greece Italy TANAP, ?Turkstream? 10-20 2020
Turkstream Russia Turkey Tesla, ?TAP? 31.5 2019
IAP Albania Croatia TAP 5 n.a.
Tesla Turkey Austria Turkstream, ?TANAP? 27 n.a.
TCP Turkmenistan Azerbaijan SCP 30 n.a.
Persian Pipeline Iran Turkey ?TANAP? 37-40 n.a.
East Med Israel Greece, Italy Cyprian gas fields 9-12 n.a.
countries. Central- and South Europe fear that the construction of Nord Stream 2 will ultimately result in closing down the Ukrainian route in which case there will be a shortage of cheap Russian gas in the region. Network flows show, that even if Nord Stream 2 would provide significantly cheaper gas, the benefits would never reach the Eastern part of Europe. A way to maintain solidarity would be to introduce a compensation scheme.
One cannot, but wonder if Nord Stream 2 and similar, somewhat controversial developments are consequences of the changes in the decision making in the Council of the European Union under the Lisbon Treaty (Kóczy, 2012). The changes increased the Council’s ability to act, but also along the interest of a smaller majority than before. The changes have not affected all countries equally, medium sized countries typically losing some of their power. While under earlier, Nice-rules countries harmed by the project had formed a blocking minority, under the new voting rules they do not.
It is worth to consider how the situation in the European gas market may change in the near future. The substantial investment costs, the interstate nature of pipeline projects and rapidly changing geopolitical interests make the gas network development very volatile. Hubert and Coblani (2015) analyze, among others, the impact of the Nabucco and South Stream projects, but by the time of publication both projects were officially cancelled. Declining inland production and the need to increase supply security, forces EU decision makers to commit themselves on further developing the European gas network. Consequently there is no lack of project plans. Still there are options that are more, while other that are less viable. Table 3 summarizes the potential projects.
The most promising alternative of Russian gas is to connect Central Asian gas fields with the European market. The Southern Gas Corridor consist of three independent pipeline segment:
the South Caucasus Pipeline (SCP), the Trans-Anatolian Natural Gas Pipeline (TANAP), and the Trans-Adriatic Pipeline (TAP). The SCP connects the Shah Deniz gas field of Azerbaijan, through Georgia, to the Eastern edge of Turkey. TAP starts from the Turkish/Greek border and runs to Italy, first through Albania, then under the Adriatic Sea. TANAP runs through Turkey connecting SCP and TAP. Although SCP has 25 bcm yearly capacity, TANAP can only transmit 16 bcm, which is little more than half of Western Turkey’s net demand of gas. Its unlikely that TAP will run dry though, as another pipeline the Turkstream (formerly Turkish Stream) connecting Russia and Western Turkey is also under construction. Turkstream would also supply the Tesla pipeline which in turn is planned to extend from the shores of the Black Sea through Central Europe to the Baumgarten gas hub in Austria. The Ionian Adriatic Pipeline (IAP) would connect TAP with the planned LNG terminal in Krk, Croatia.
Turkmenistan has the largest proven reserves of natural gas in Central Asia, 9.4% of the world total. The planned Trans Caspian Pipeline (TCP) would help to feed the SCP. The traditional route for Turkmen gas to Europe is through Russia, which is supposedly not happy of the prospect of having a competitor. Let us note that all the Turkmen pipelines are owned by Gazprom.
Iran possesses even larger reserves, 18% of the world total, and produces more gas than Qatar. However, it consumes nearly all of it. Now and then there are rumors of the Persian Pipeline that would run parallel with TAP and TANAP, but Iran has to invest in its production first, as they already have a gas pipeline to Turkey, which they are yet unable to fill.
Copyright © 2016 by the IAEE. All rights reserved.
Although the production in Europe is declining, this is not true for all countries. Romania may soon become a net exporter due to the increasing production on the Black Sea. The Middle-East might be another supply source. Apart from Iran, Egypt and Israel can also become potential producers. The former due to the discovery of the giant Zohr gas field, the latter due to rapidly developing gas industry in the Levantine Basin.
The profitability of these developments rests on many factors. Notably oil and LNG prices in general, which in turn depend on the demand in Asia, and the costs of the production of shale gas in the US (Rogers, 2015). Game theoretic analysis of the different scenarios can help us deciding which projects will be realized in the future.
7. APPENDIX
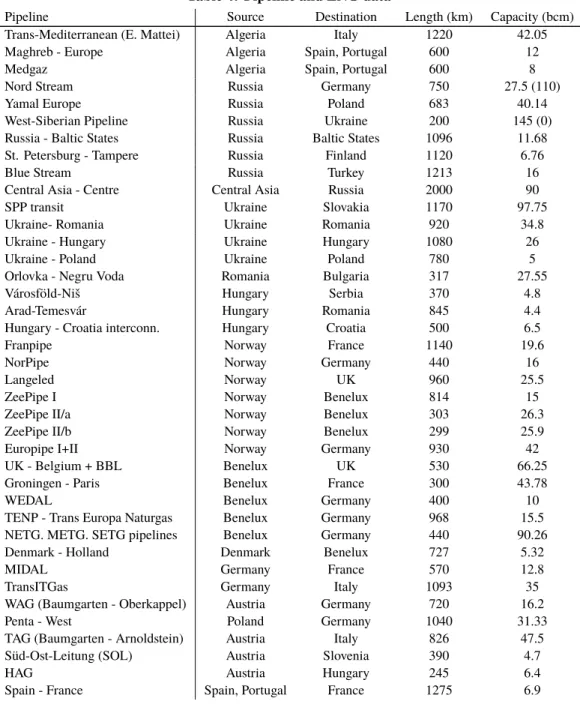
Table 4: Pipeline and LNG data
Pipeline Source Destination Length (km) Capacity (bcm)
Trans-Mediterranean (E. Mattei) Algeria Italy 1220 42.05
Maghreb - Europe Algeria Spain, Portugal 600 12
Medgaz Algeria Spain, Portugal 600 8
Nord Stream Russia Germany 750 27.5 (110)
Yamal Europe Russia Poland 683 40.14
West-Siberian Pipeline Russia Ukraine 200 145 (0)
Russia - Baltic States Russia Baltic States 1096 11.68
St. Petersburg - Tampere Russia Finland 1120 6.76
Blue Stream Russia Turkey 1213 16
Central Asia - Centre Central Asia Russia 2000 90
SPP transit Ukraine Slovakia 1170 97.75
Ukraine- Romania Ukraine Romania 920 34.8
Ukraine - Hungary Ukraine Hungary 1080 26
Ukraine - Poland Ukraine Poland 780 5
Orlovka - Negru Voda Romania Bulgaria 317 27.55
Városföld-Niš Hungary Serbia 370 4.8
Arad-Temesvár Hungary Romania 845 4.4
Hungary - Croatia interconn. Hungary Croatia 500 6.5
Franpipe Norway France 1140 19.6
NorPipe Norway Germany 440 16
Langeled Norway UK 960 25.5
ZeePipe I Norway Benelux 814 15
ZeePipe II/a Norway Benelux 303 26.3
ZeePipe II/b Norway Benelux 299 25.9
Europipe I+II Norway Germany 930 42
UK - Belgium + BBL Benelux UK 530 66.25
Groningen - Paris Benelux France 300 43.78
WEDAL Benelux Germany 400 10
TENP - Trans Europa Naturgas Benelux Germany 968 15.5
NETG. METG. SETG pipelines Benelux Germany 440 90.26
Denmark - Holland Denmark Benelux 727 5.32
MIDAL Germany France 570 12.8
TransITGas Germany Italy 1093 35
WAG (Baumgarten - Oberkappel) Austria Germany 720 16.2
Penta - West Poland Germany 1040 31.33
TAG (Baumgarten - Arnoldstein) Austria Italy 826 47.5
Süd-Ost-Leitung (SOL) Austria Slovenia 390 4.7
HAG Austria Hungary 245 6.4
Spain - France Spain, Portugal France 1275 6.9
15 /The Energy Journal
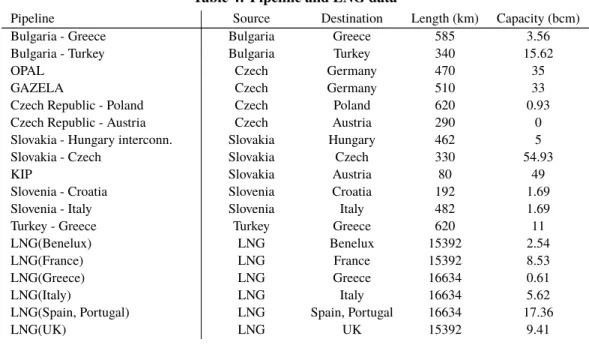
Table 4: Pipeline and LNG data
Pipeline Source Destination Length (km) Capacity (bcm)
Bulgaria - Greece Bulgaria Greece 585 3.56
Bulgaria - Turkey Bulgaria Turkey 340 15.62
OPAL Czech Germany 470 35
GAZELA Czech Germany 510 33
Czech Republic - Poland Czech Poland 620 0.93
Czech Republic - Austria Czech Austria 290 0
Slovakia - Hungary interconn. Slovakia Hungary 462 5
Slovakia - Czech Slovakia Czech 330 54.93
KIP Slovakia Austria 80 49
Slovenia - Croatia Slovenia Croatia 192 1.69
Slovenia - Italy Slovenia Italy 482 1.69
Turkey - Greece Turkey Greece 620 11
LNG(Benelux) LNG Benelux 15392 2.54
LNG(France) LNG France 15392 8.53
LNG(Greece) LNG Greece 16634 0.61
LNG(Italy) LNG Italy 16634 5.62
LNG(Spain, Portugal) LNG Spain, Portugal 16634 17.36
LNG(UK) LNG UK 15392 9.41
ACKNOWLEDGEMENTS
This research was supported by the Higher Education Institutional Excellence Program of the Ministry of Human Capacities in the framework of the ’Financial and Retail Services’ research project (1783-3/2018/FEKUTSTRAT) at the Corvinus University of Budapest. The authors acknowledge the support of Hungarian National Research, Development and Innovation Office, grant numbers K124550, K109354 and PD123900. Dávid Csercsik thanks the support of Fund KAP18-1.1-ITK of the Pázmány Péter Catholic University.
REFERENCES
Abada, I., Gabriel, S., Briat, V., and Massol, O. (2013). A generalized Nash – Cournot model for the Northwestern European natural gas markets with a fuel substitution demand function: The GaMMES model.Networks and Spatial Economics, 13(1):1–42.
Barnes, A. (2017). Nord Stream 2 - Friend or enemy of energy security in Europe? CEPS Special Report no. 2017/46, Centre for European Policy Studies.
Boots, M. G., Rijkers, F. A., and Hobbs, B. F. (2004). Trading in the downstream European gas market: A successive oligopoly approach.The Energy Journal, 25(3):73–102.
BP (2017). Statistical review of world energy 2017. London, UK.
Cachon, G. P. and Netessine, S. (2004). Game theory in supply chain analysis. In Simchi-Levi, D., Wu, S. D., and Shen, Z., editors,Handbook of quantitative supply chain analysis: modeling in the e-business era, pages 13–65. Springer US, Boston, MA.
Chandra, V. (2006).Fundamantals of natural gas: An international perspective. Pennwell, Tulsa, Oklahoma.
Cobanli, O. (2014). Central Asian gas in Eurasian power game.Energy Policy, 68(Supplement C):348 – 370.
Currie, J. and Wilson, D. I. (2012). OPTI: Lowering the barrier between open source optimizers and the industrial MATLAB user. In Sahinidis, N. and Pinto, J., editors,Foundations of Computer-Aided Process Operations, Savannah, Georgia, USA.
Economides, M. J., Sun, K., and Subero, G. (2006). Compressed natural gas (CNG): An alternative to liquefied natural gas (LNG).Society of Petroleum Engineers, 21.
Egging, R., Holz, F., and Gabriel, S. A. (2010). The world gas model: A multi-period mixed complementarity model for the global natural gas market.Energy, 35(10):4016 – 4029.
EPSC (2016). Nord Stream 2 - Divide et impera again? Avoiding a zero-sum game. Strategic note, European Political Strategy Centre.
Copyright © 2016 by the IAEE. All rights reserved.
European Commission (2014). European Energy Security Strategy. Communication from the Commission to the European Parliament and the Council COM/2014/330 .
European Parliament (2016). EU strategy for liquefied natural gas and gas storage. EP resolution 2016/2059(INI).
Fischer, S. (2016). Nord Stream 2: Trust in Europe.Policy Perspectives, 4(4).
Hecking, H. and Weiser, F. (2017). Impacts of Nord Stream 2 on the EU natural gas market. ewi energy research & scenarios, Institute of Energy Economics at the University of Cologne.
Holz, F., von Hirschhausen, C., and Kemfert, C. (2008). A strategic model of European gas supply (GASMOD).Energy Economics, 30(3):766–788.
Honoré, A. (2014). The outlook for natural gas demand in Europe. OIES Paper NG:87, The Oxford Institute of Energy Studies.
Hubert, F. and Coblani, O. (2015). Pipeline power: A case study of strategic network investments. Review of Network Economics, 14(2):75–110.
Hubert, F. and Ikonnikova, S. (2011). Investment options and bargaining power: The Eurasian supply chain for natural gas.
The Journal of Industrial Economics, 59(1):85–116.
Kóczy, L. Á. (2012). Beyond Lisbon: Demographic trends and voting power in the European Union Council of Ministers.
Mathematical Social Sciences, 63(2):152–158.
Lochner, S. (2011). Identification of congestion and valuation of transport infrastructures in the european natural gas market.
Energy, 36(5):2483 – 2492.
Lochner, S. and Bothe, D. (2007). From Russia with gas – An analysis of the Nord Stream pipeline’s impact on the European Gas Transmission System with the Tiger-Model. Ewi working paper, no 07.02, Institute of Energy Economics at the University of Cologne.
Mitrova, T., Boersma, T., and Galkina, A. (2016). Some future scenarios of Russian natural gas in Europe.Energy Strategy Reviews, 11-12:19 – 28.
Montero, M. (2013). On the nucleolus as a power index. In Holler, M. and Nurmi, H., editors,Power, Voting, and Voting Power: 30 Years After, pages 283–299. Springer, Berlin.
Perner, J. and Seeliger, A. (2004). Prospects of gas supplies to the European market until 2030—results from the simulation model EUGAS.Utilities Policy, 12(4):291 – 302. Infrastructure Regulation and Investment for the Long-Term.
Petrovich, B., Rogers, H., Hecking, H., and Weiser, F. (2016). European gas grid through the eye of the TIGER: Investigating bottlenecks in pipeline flows by modelling history. OIES Paper NG:112, The Oxford Institute of Energy Studies.
Riley, A. (2016). Nord Stream 2: A legal and policy analysis. CEPS Special Report no. 2016/151, Centre for European Policy Studies.
Rogers, H. V. (2015). The impact of lower gas and oil prices on global gas and LNG markets. OIES Paper NG:99, The Oxford Institute of Energy Studies.
Roson, R. and Hubert, F. (2015). Bargaining power and value sharing in distribution networks: A cooperative game theory approach.Networks and Spatial Economics, 15(1):71–87.
Schmeidler, D. (1969). The nucleolus of a characteristic function game.SIAM Journal on Applied Mathematics, 17:1163–1170.
Shapley, L. S. (1953). A Value for n-Person Games. In Kuhn, H. W. and Tucker, A. W., editors,Contributions to the Theory of Games II, volume II ofAnnals of Mathematics Studies, chapter 17, pages 307–317. Princeton University Press, Princeton, New Jersey.
Vasilyev, F. and Ivanitskiy, A. Y. (2001). Dual simplex method. InIn-Depth Analysis of Linear Programming, pages 119–166.
Springer.