Energy Policy 144 (2020) 111692
Available online 29 June 2020
0301-4215/© 2020 The Authors. Published by Elsevier Ltd. This is an open access article under the CC BY-NC-ND license
(http://creativecommons.org/licenses/by-nc-nd/4.0/).
Contents lists available atScienceDirect
Energy Policy
journal homepage:www.elsevier.com/locate/enpol
The impact of Nord Stream 2 on the European gas market bargaining positions
Balázs R. Sziklai
a,c,∗, László Á. Kóczy
a,b, Dávid Csercsik
daInstitute of Economics, Centre for Economic and Regional Studies, Hungary
bDepartment of Finance, Budapest University of Technology and Economics, Hungary
cDepartment of Operations Research and Actuarial Sciences, Corvinus University of Budapest, Hungary
dFaculty of Information Technology and Bionics, Pázmány Péter Catholic University, Hungary
A R T I C L E I N F O
Keywords:
Gas supply Pipeline network Bargaining power Shapley value Cooperative games Nord Stream
A B S T R A C T
We investigate the impact and the possible consequences of the construction of the Nord Stream 2 pipeline. We model the European gas network as a cooperative game between regions as players over the pipeline network.
Our model offers several novelties compared to earlier cooperative studies. Firstly, we focus on cost saving rather than on the profits of cooperation. Secondly, we introduce liquefied natural gas as a player. Thirdly, we apply an iterative linear program to account for the long term bilateral contracts that still drive the gas market. This modelling technique also allows us to identify individual gas flows. We focus on the change of influence of the players in three different scenarios. We investigate how the power of the agents shift when the Nord Stream pipeline is expanded, when the Ukrainian pipeline is shut down and finally when both of these happen. Our calculations show that when Nord Stream 2 is operational, Russia and Western Europe improve their position compared to the base scenario, while other suppliers, notably Norway, together with Central- Eastern- and Southern Europe suffer losses, especially when the Ukrainian route is dismissed. The results highlight that both the supporters and adversaries of Nord Stream 2 are governed by self-interest and solidarity and trust, the values proclaimed by the EU and the Energy Union, remain but a slogan.
1. Introduction
Satisfying Europe’s hunger for energy has always been a difficulty.
Despite efforts to increase the use of renewable sources, with the mounting sentiment against nuclear energy, reliance on fossil fuels is more important than ever. Natural gas is, in particular, a very versatile energy source with extensive industrial and domestic uses.
Nearly three-quarters of the European Unions natural gas consumption is imported and 40% of the total import comes from Russia (European Commission,2014).
To combat this weakness, the European Union (EU) has established a strategic plan for secure, affordable and environmental-friendly en- ergy for all its citizens. As part of this plan, the Third Energy Package, adopted in 2009, has the goal to open up the internal electricity and gas markets of the European Union. It pushes for a separation of energy production and transmission, stipulates the establishment of national regulatory authorities and creates the Agency for the Cooperation of Energy Regulators.Solidarity in energy matters is a key point in the Treaty on the Functioning of the European Union as well as in the
∗ Corresponding author at: Institute of Economics, Centre for Economic and Regional Studies, Hungary.
E-mail addresses: sziklai.balazs@krtk.mta.hu(B.R. Sziklai),koczy@krtk.mta.hu(L.Á. Kóczy),csercsik@itk.ppke.hu(D. Csercsik).
1 Seehttps://ec.europa.eu/commission/priorities/energy-union-and-climate_en.
Energy Union. In fact, the first point of the EU’s energy union strategy is: security, solidarity and trust.1In the 2014 Energy Security Strategy Communication the European Commission clearly declared how this should be interpreted.
‘‘Government interventions that affect this market framework, such as national decisions on renewable energy or efficiency targets, decisions to support investment in (or decommissioning of) nuclear generation, or decisions to support key infrastructure projects (such as Nord Stream, South Stream, TAP or a Baltic LNG terminal) need to be discussed at European and/or regional level to ensure that decisions in one member state do not undermine security of supply in another member state’’. (European Commission,2014)
Natural gas is commonly transported via a network of national and international pipelines. The Nord Stream pipeline, which connects Russia and Germany, respectively the largest supplier and consumer in Europe, became operational in 2011. Nord Stream 1 has already led to political tensions within the EU: Central European Member
https://doi.org/10.1016/j.enpol.2020.111692
Received 7 August 2019; Received in revised form 24 April 2020; Accepted 10 June 2020
States viewed it as a Trojan horse, a way to undermine the region’s diversification efforts (European Policy Strategy Centre, 2016). The EU introduced restrictions allowing the pipeline to be utilized at only 27.5 from 55 billion cubic metres (bcm) or half of its capacity. Re- cently the limitations were lifted, utilization reached 93% by 2017 and negotiations started to double transmission capacity to 110 bcm.
By August 2018, the project received permits from Russia, Finland, Sweden and Germany, but not yet from Denmark. To prevent fur- ther delay, Gazprom identified an alternative route avoiding Danish territorial waters and started the construction. A year later, three quarters of the work was completed and soon Denmark gave consent to construct the pipeline through her continental shelf area. Meanwhile the US threatened participating companies with sanctions and as a final twist Swiss pipelay contractor Allseas halted work. Gazprom remained adamant that they will find a solution to complete the pipeline. We study the consequences of opening Nord Stream 2.
Propagators of Nord Stream 2 argue that the project is commercially viable.
⊕ Declining European production capacities cannot meet rising net demand.
⊕ Nord Stream 2 helps to lower gas prices in the EU.
⊕ Key pipelines in Ukraine are reaching the end of their service life and lack viable alternatives.
⊕ Ends the uncertainty of the Ukrainian transit route.
What are the main argumentsagainstthe project?
⊖ Does not diversify the EU’s energy supply.
⊖ Adds to an infrastructure overcapacity in the EU.
⊖ Undermines the economic sanctions towards Russia.
⊖ Incompatible with the Energy Union’s strategic goals and with the Third Energy Package.
Let us elaborate on the above points.
The demand for natural gas has declined in Europe during the 2010–
2013 period largely due to the 2008 financial crisis and the subsequent recession and the migration of manufacturing industry to other world regions, but the lack of population growth and high prices have also contributed to the effect. Although there is currently an oversupply in the market, the trend has already reversed. Asia continuously diverts the LNG production surplus, while the US shale gas with its high variable cost and high sensitivity to LNG market prices cannot currently compete with the cheap Russian gas. TheInternational Energy Agency (2017) forecasts flat demand and an average annual decline of−2.5%
for European production. This amounts up to 34 bcm deficit in the 2017–2022 period and possible more in the future. Nord Stream 2 aims to close this gap.
Russia claims that renovating Ukrainian lines would cost more than e9.5 bn, the construction cost of Nord Stream 2 (National Energy Security Fund,2016). The new route is shorter and more efficient due to the inner pipeline coating which reduces friction and lowers the amount of compression needed to push the gas through (Barnes,2017).
Furthermore, alternatives, such as the planned Southern Gas Corridor, connecting Azerbaijan to Europe, are too small to make any difference.
As a result of lower average EU gas prices,Hecking and Weiser(2017) forecast ae13–35 bn annual welfare benefit for the EU-28.
Gazprom has also obtained half of the funds from five European energy companies, suggesting that these firms also expect profits, al- though four of them (Uniper and Wintershall from Germany, Engie from France, and Shell from United Kingdom/Netherlands) are based in countries that are clear beneficiaries of the project (cf.Table 3; the fifth firm being the Austrian OMV).
On the other hand, Nord Stream 2 received harsh criticism from both sides of the Atlantic. In March 2016, eight EU leaders, the prime ministers of the Czech Republic, Estonia, Hungary, Latvia, Poland, Slo- vakia and Romania and the president of Lithuania have signed a letter warning that Nord Stream 2 would generate ‘‘potentially destabilizing geopolitical consequences’’. A European Parliament resolution adopted in the same year describes Nord Stream 2 as harmful to energy security, diversification and European solidarity (European Economic and Social Committee,2016). According to theEuropean Policy Strategy Centre (2016), the European Commission’s in-house think tank ‘‘Nord Stream 2, seen from a common EU perspective, is a project with neither economic rationale nor political backing’’, furthermore the project far exceeds the renovation costs of the Ukrainian route ate6 bn.Riley (2016) argues that Nord Stream 2 threatens to plunge the Central Eastern European states back into a pre-2004 market of greater supply security risk and greater Russian leverage in their markets. Similar concerns were raised before the construction of Nord Stream 1 and these turned out to be well-founded. While Nord Stream 1 brought new supplies to compensate declining internal production, EU officials documented various abusive practices of Gazprom’s market power, primarily in Eastern Europe (European Commission,2018).
Ukraine alone is to lose an estimated $2 billion from transfer fees and, to a lesser extent, the EU members Slovakia, Hungary and Poland would be also harmed by Nord Stream 2 (Fischer,2016) — violating the principle of solidarity of Treaty on the Functioning of the European Union. The European Commission has therefore proposed to explicitly extend EU internal energy market rules to cover offshore gas pipelines.
The legal services of the Council of the European Union – where, incidentally, the constructing countries have a blocking minority – has opposed the legislative proposal. Eventually a compromise was reached in February, 2019. Although the adopted text is less clear-cut than the original proposal had been, it is the first document declaring the Union’s jurisdiction over Nord Stream 2. It asserts, that the Mem- ber State with the first interconnection point is primarily responsible for applying EU rules on pipelines with third countries. The legal framework for the entire pipeline will be established either through bilateral German–Russian talks or an intergovernmental agreement between the EU and Russia, negotiated by Germany or the European Commission (Łoskot-Strachota,2019).
There is already an infrastructure overcapacity in the EU in the sense that imports amount to less than half of the existing infras- tructure capacity (European Policy Strategy Centre, 2016). Finishing Nord Stream 2 and Turkstream, Russia’s overall export capacity of 340.5 bcm (198.5 bcm without the Ukrainian corridor) will tower over the 161 bcm of estimated upper limit of her exports to the region in 2025 (Vatansever,2017). Nord Stream 2 does not diversify the EU’s energy supply neither from an energy source perspective nor from a route perspective as (i) Russia is already the main supplier of Europe and (ii) the pipeline would lead to a concentration of routes in the Baltic corridor. Similar concerns have been expressed by senior figures in the US administration — although they are hardly impartial as Europe is a prime target for future shale gas exports.Vainio(2019a,b) on the other hand looks at energy transformation to renewables and the risks related to ‘‘geopolitical changes in countries dependent on fossil fuel production’’Vainio(2018), that is, —sine nomine— Russia.
Both narratives have compelling elements, and both are true to some extent (see Goldthau, 2016 for a more in-depth analysis). As Fischer(2016) put it, the EU has to decide on what should drive its natural gas policies: the market approach or the geopolitical approach.
In this paper, we aim to answer whether the concerns are well-founded or not. We model the European gas network as a cooperative game and numerically assess the influence of the stakeholders in the different scenarios.
The structure of the paper is accordingly. After a brief literature overview, we introduce our model, and explain the limitations. Next we discuss the data we have used and present the main findings.
Finally, we discuss the possible network development alternatives in the conclusion.
2. Literature overview
The cooperative game theoretic approach in studying natural gas networks was pioneered by Hubert and Ikonnikova(2011), and was soon followed by a number of papers that analysed different segments of the European and Central Asian markets.Roson and Hubert(2015) presents a detailed discussion of bargaining games on network markets.
Hubert and Ikonnikova (2011) analyse how Russian natural gas reaches the European market through the Eastern-European gas net- work, and derived bargaining powers by calculating the Shapley-values for the stakeholders. The scope of the paper is limited to seven coun- tries, among which Russia was the only supplier.Hubert and Coblani (2015) extend this framework to a full scale analysis of the Euro- pean network comparing three scenarios corresponding to the Nord Stream 1, Nabucco, and the South Stream pipeline projects. They construct a cooperative game by calculating profits of coalitions. In contrast, we focus on how much cost a coalition can saveby cooper- ation. An even more important difference is that instead of optimizing the network flows of a coalition in one step, we do it iteratively, country-by-country according to a given order. We do this in order to obtain a more fitting model of the gas market with predominantly long term bilateral contracts. One advantage of this approach is that flows corresponding to the consumption of individual countries are well-defined.
Cobanli (2014) also uses the cooperative approach to assess the bargaining power of Central Asian countries. He considers various projects, both East- and Westbound,2 and concludes that there is no demand competition between Europe and China. To deal with the externalities raised by the third-party-access policy imposed by the EU regulations,Csercsik et al.(2019) replace the characteristic form approach and represent the game in partition function form (Kóczy, 2018).
Among other approaches Holz et al. (2008) and recentlyAbada et al.(2013) consider strategic, while others highly detailed numerical models including the EUGAS model by Perner and Seeliger (2004);
the TIGER model developed by EWI Institute in Cologne (Petrovich et al.,2016;Lochner,2011); the ambitious Global Gas Model (Egging et al., 2010). A non-linear model is presented by Bouwmeester and Oosterhaven(2017).
Additionally, there is a handful of papers that offer scenario analy- ses or consider the potential impact of new pipelines: Mitrova et al.
(2016) reviews a number of scenarios, including the disruption of the Ukrainian transit, and conclude that the European gas mix is fairly robust, and will include a significant share of natural gas from Russia in all studied scenarios. Richter and Holz(2015) also analyses Russian natural gas supply disruption scenarios using the Global Gas Model. Dastan (2018) investigates the bargaining positions of Rus- sia and Turkey in view of the Turkstream (formerly Turkish Stream) project. Aune et al. (2017) use the numerical energy market model LIBEMOD to investigate long-run effects of increased export capacity of piped Russian gas. They find that the projects Nord Stream 2, Turkish Stream and Power of China all lead to moderate increases in net total Russian export, but the increases are lower than the capacities of the new pipelines.
3. Model
In this section we describe our model. We are interested in cal- culating thevaluesof countries or country-groups, representing their bargaining power. First, we shortly define the cooperative game the- oretic framework, and the Shapley value. Following this, we describe our modelling assumptions, and discuss how the coalitional values are determined in our case.
2 Including the TAP, TANAP and TCP projects, which we also review in Section7.
3.1. Coalitional cooperative games
The bargaining between a buyer and a seller – or a consumer and a producer – is best modelled by a cooperative game. When we have more buyers and/or sellers we may also want to consider trades among more than two players, especially when the transmission of the goods must also be taken into account. Such trading groups arecoalitionsand the members are theplayers. Of course, we can consider the possible trade with any group or coalition of players — the realized utility is called the characteristic value of the coalition.
Formally, the characteristic function 𝑣 ∶ 2𝑁 → R, where 𝑁 is the set of players, gives the value a coalition is able to obtain via cooperation without the help or participation of players outside the coalition. One-member coalitions are termedsingletons.
In our case, the values of the coalitions will be defined as the savings resulting from transporting (trading) gas within the coalition.
We interpret these savings in the following context. We assume that every consumer node of the network has a given (inelastic) demand for gas. If this is not fully supplied, it must use its (expensive) backstop source: alternative energy sources (renewables, coal, etc.), or alterna- tive technologies requiring less energy. The backstop source can also be interpreted as the cost of government intervention to mitigate damages due to the gas shortage. The gain of a coalition is then the cost saving from consuming natural gas instead of the expensive backstop source.
The cost function𝑐∶ 2𝑁→Rassigns a non-negative value to each coalition, the cost of supplying that coalition using only the network connections and resources that are available within this coalition. Then 𝑣(𝑆) =∑
𝑖∈𝑆
𝑐({𝑖}) −𝑐(𝑆), (1)
that is, the difference between the cost of coalition 𝑆 and the total cost of its members as singletons (when consumers use their backstop sources).
Later in Section3.5we describe the details how the cost savings are calculated for each coalition, and in Section3.6we provide an example of how these values are calculated in the case of a simple network. In the next subsection, we introduce the Shapley-value, which represents the bargaining power of individual payers in a characteristic function form cooperative game.
3.2. The Shapley-value
Usually, full cooperation is the most beneficial scenario for the play- ers (that is players are expected to form the so-calledgrand coalition, 𝑁). On the other hand, it is not trivial how the gains of 𝑣(𝑁) are divided.
The share a player manages to secure from the value of the grand coalition𝑣(𝑁)can be considered as an indicator of power. We discuss different solution concepts in Section6.3. In general, more successful a player is in generating value for himself or others, the more he in entitled from the whole cake.
In consumers-only coalitions there is no cost saving, each player uses its backstop source. Similarly, without consumers there is no opportunity for cost saving. Finally, in mixed coalitions, suppliers and consumers without connections cannot reduce costs. Consequently, when a player joins a coalition, his contributions can be one or more of the following types: production, consumption and transit.
1. A new, inexpensive gas source is the most obvious way to reduce costs by replacing some of the more expensive sources. By our assumption, all players can satisfy demand by alternative energy forms if no gas is available, so the first contribution is to replace these alternative forms.
2. Producers cannot reduce costs unless there is demand. A con- sumer would normally use its own backstop sources; in cooper- ation these backstop sources are replaced by natural gas, thereby saving costs. Therefore consumer countries create value (i.e. cost saving) by having a demand that can be satisfied.
3. Finally, gas must travel from producers to consumers. By linking them, transit countries make the aforementioned savings possi- ble. For existing routes, a less expensive alternative may also reduce costs.
When a coalition forms, members join one-by-one, and each mem- ber contributes a non-negative amount to the cost saving. Existing members are not harmed if (almost all) of this saving is kept by the new entrant. Considering all possible orders we can calculate the average marginal contribution to the cost saving of each of the members of the coalition. This is known as the Shapley-value (Shapley, 1953).
Formally, the Shapley-value of a player 𝑖, denoted by 𝜙𝑖(𝑣) can be calculated as follows:
𝜙𝑖(𝑣) = ∑
𝑆⊂𝑁 ,𝑆∌𝑖
|𝑆|! (|𝑁⧵𝑆|− 1)!
|𝑁|! (𝑣(𝑆∪ {𝑖}) −𝑣(𝑆)) (2) where|𝑆|denotes the number of players in coalition𝑆.
What do the Shapley-values tell us in our context? As our game will represent natural gas trading on the European network, the Shapley- values are the expected contributions of players to savings in the entire European market. Regarding on consumers, the saving originates partly from replacing the backstop source by cheaper gas and is partly from helping others to save by providing transit lines. In the latter case part of the saving is kept as a transit fee, which comes on top of the transfer costs and can be seen as the profit of the transit operation. Both reduce costs and with some simplification we can say that a higher Shapley- value implies cheaper gas in a region. Much of the value is, however is simply due to the size of countries. It is more interesting to see how the power distributionchangeswith the network: what is the effect of new pipelines built, who gain and who lose with them. Similarly, the closing of certain pipelines may harm some, but may benefit others.
3.3. Modelling assumptions
In this subsection, we summarize the assumptions, which are used through the modelling calculations.
Players. We identify the stakeholders of the gas market with countries, represented by nodes in the graph of the pipeline network correspond- ing to the main distribution hubs. Considering the strategic importance of managing gas supply it seems fair to assume that production, trans- portation and consumption are coordinated at the national level in each country and is also in line with the strive for national energy authorities as stipulated by the Third Energy Package. Note that the legislative negotiations within the EU concerning the regulation of Nord Stream 2 also took place on a country level.
Demand. For each node, we assume a non-negative perfectly inelastic demand (zero for source nodes).
Regions. For computational reasons – the calculation of the Shapley- value is factorial (cf. Eq. (2)) – we need to simplify the player set.
We assume that certain countries always act together: join or leave coalitions collectively. Players may then represent individual countries or regions consisting of multiple nodes of the network. The latter is an important point: The underlying pipeline network is unaffected;
supplies, demands and eventual flows are considered for each member country separately.
Ordered players. We assume that suppliers focus first on the largest markets that provide the largest part of their revenues: countries with higher demand have, effectively, priority over countries who import less gas. In the context of our model, this implies that ‘large’ players grab the less expensive sources and the remaining supply (and transmis- sion capacity) is shared among the rest. We formalize this assumption in Section3.5and check for robustness in6.2.
Transportation costs. Pipelines constitute the other component of the network. While there may be specific costs to using each pipeline, we assume that the transportation costs are uniform, proportional to the volume and to the length of the pipeline (1.5 m$/bcm/100 km). Having a fixed number is convenient both for estimation, but is also in line with the mid-term goals in the European Union to liberalize access to (international) pipelines.
Sourcing costs. In order to calculate the cost savings we specify the production or sourcing cost for the suppliers and the price of the alternative or backstop source for consumers. We use expert estimations for sourcing costs; we assume that the Russian gas is somewhat cheaper than the Norwegian and North-African gas. The price of the backstop source is uniform across all consumers and is 2–3 times higher than the sourcing cost. Our robustness analysis in Section6.2includes sensitivity checks to sourcing costs and backstop prices.
Quality. We assume that the natural gas transported over the net- work is homogeneous. Gas coming from different sources will differ in calorific value by up to 10% (Chandra,2006, Chapter 1). Interestingly, consumers pay for the energy content, while for transportation capaci- ties and costs the volume must be considered. As a result better quality gas is a little less costly to transport. Taking calorific capacities into account seems feasible, but transporting gases of different qualities over the same pipeline segment can be difficult. Either we have to handle
‘cocktails’ or add a complex scheduling problem. Cancelling counter- directional flows over the same pipeline is problematic if we do not assume homogeneous gas sources, as the gas quality may not be the same.
Now we move on to the technical details of our model.
3.4. Model formulation
We consider the European natural gas pipeline network as a graph, where each country is represented by a node and the pipelines connect- ing countries are the arcs of the network. The set of nodes is denoted by𝑉,|𝑉|= 𝑛with a generic element denoted by𝑖or𝑗. The set of arcs is denoted by𝐿,|𝐿|=𝑚with generic element𝓁. The player set is denoted by𝑁, a generic coalition by𝑆 ⊆ 𝑁. When𝑁is considered as a coalition, we refer to it as the grand coalition. A player may correspond to multiple nodes in the network.
Now, we turn to the physical characteristics of the network. The network itself is described by an incidence matrix 𝐴 ∈ R𝑛×𝑚 where 𝐴𝑖𝓁= −1and𝐴𝑗𝓁= 1means that arc𝓁runs from node𝑖to𝑗.
Edges, representing the pipelines are characterized by a maximal transfer capacity. The vector of transfer capacities is denoted by 𝑞.
Transporting gas over these pipelines has its costs. A pipeline may travel across several regions and therefore it is convenient to define costs by a cost matrix𝐶∈R𝑛×𝑚+ where𝐶𝑖𝑗 is the cost of transferring a unit gas over pipeline𝑗occurring in region𝑖.
Each node is characterized by exogenous or perfectly inelastic de- mand and a production value,𝑑0∈R𝑛+denotes the vector of demands and𝑠0 ∈ R𝑛+ the vector of (maximum) supplies. In the following we modify these to obtain the net demand and net production vectors, 𝑑, 𝑠∈R𝑛+: There are fundamentally two types of regions: those where the production capacity is higher than the domestic demand and those where it is not. In the first group we assume that domestic consumption is fully satisfied by domestic production, and domestic production is reduced by this amount. In the latter the domestic consumption uses up all the production and the net import is the remaining part. Hence, we define
𝑑𝑖= (𝑑𝑖0−𝑠0𝑖)+ and 𝑠𝑖=|||𝑑𝑖0−𝑠0𝑖||| (3) where(⋅)+ denotes the positive part, that is(𝑥)+ = max{𝑥,0}for any 𝑥∈R. Note, that if𝑑𝑖0> 𝑠0𝑖, then country𝑖has no real excess supply, still𝑠𝑖is positive. We will come back to this issue in a moment.
As mentioned in Section3.1, we assume that countries that do not receive enough gas to satisfy their demand use some kind of backstop source: We model it by providing the countries with a virtual energy source that can satisfy all residual demand, but this alternative is more expensive.
Production has different costs in different countries, in particular, the backstop energy source has a unit price 𝑝̄that is (much) higher than the cost at any of the producers. The price of producing one unit of gas is called the sourcing cost and is represented by a vector 𝑝 ∈ R𝑛+. For consumer countries, where demand exceeds domestic supply capacities, 𝑝𝑖 is set to𝑝̄ — the price of the backstop energy source. That is, consumer countries also have supply capacities (that is the reason we defined𝑠𝑖as|||𝑑0
𝑖−𝑠0
𝑖|||), but they can produce gas only for the price of the backstop source (𝑝/bcm). This technical detail ensures̄ that each country can satisfy its own demand albeit in this case at a higher price.
3.5. Optimal flows
In this subsection, we describe how the cost saving of a coalition is determined as gas trade takes place on the available pipelines. The first best approach would be to minimize the overall cost of satisfying all demand. This can be done by transporting supplied gas to the demand sites via the cheapest available route, but more expensive sources, routes or even backstop sources may be used due to bottlenecks of production or transportation capacities.
Under the optimum, which describes the cheapest possible supply of a given coalition, the flow over the pipelines is given, but in the case of multiple sources or consumption sites and branching flows it is not clear which gas molecules turn left or right at a node. Hence, we cannot necessarily distinguish between the flows of individual countries.
The approach we opted for resolves this issue. As foreshadowed in Section 3.3, we assume that producers supply the larger consumers first. In practice, this means that ‘large’ players grab the less expen- sive sources and the remaining supply – and transmission capacity – is shared among the rest. As a result, we may run out of transfer capacity too soon making some smaller players unable to use optimal, inexpensive sources. The overall cost will therefore increase, giving us a second best solution: In the order of demand, countries satisfy their needs at the lowest possible cost using the available sources and transport capacities; this consumption is removed from the market and for the next player the flows are calculated using residual production and transfer capacities and so on.
Similar calculations are also possible when only a subset 𝑆 of players participate in the network transfer. In this case the optimization is restricted to the supply of the elements of𝑆 using the production and transportation capacities of 𝑆. The latter condition also implies that only pipelines where both endpoints belong to the coalition can be used. We do not exclude pipelines that travel through regions belonging to a third party. Using these calculations the total cost of supplying the coalition can be determined. Comparing this cost to the individual (sin- gleton) costs of gas supply we obtain the cost saving due to cooperation.
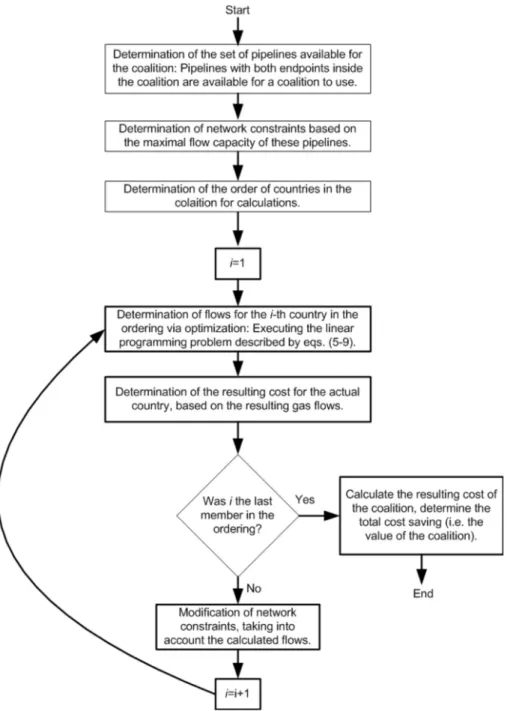
The flow chart of this calculation process is shown inFig. 1.
The iterative method we described here stands in contrast with the approach of Hubert and Ikonnikova (2011),Hubert and Coblani (2015) andCobanli(2014), where the optimal flows for each coalition is calculated in one step. The natural gas market is driven by long-term contracts. Suppliers negotiate with each consumer one-by-one. Here we assume that bigger markets have priority over smaller ones. In case of a capacity shortage this seemingly technical detail makes a difference.
In addition, we can distinguish between the flows of each player, even when they are integrated in a coalition. Hence, the individual cost can be accounted for, which is helpful if we want to keep track which region benefits from the cheap Russian gas.
Note that because of the ordering the game is not superadditive, that is there might exists some coalitions,𝑆, 𝑇such that𝑆∩𝑇= ∅and
𝑣(𝑆) +𝑣(𝑇)> 𝑣(𝑆∪𝑇). The intuitive explanation is that, when a player with higher priority joins a coalition, he may request that some cheap gas previously supplied to a lower priority player should be delivered to him. Although the amount of gas that is replaced by the backstop source might not change, the overall cost of the coalition could decrease, because the route from the supplier to the high priority player is longer and more costly than the route to the low priority paper.
In the following, we define the formalism required for the determi- nation of the cheapest possible supply of a coalition: the solution of a linear programming (LP) problem. Readers who are less interested in mathematical details should note that the following description is just a simple flow model with multiple sources and sinks.
Formally, let𝑓𝓁+∈R+denote the flow in the positive direction over edge𝓁, and let𝑓−
𝓁 ∈R+denote flow in the opposite direction,𝑓+is the vector of positive directional flows on all edges while𝑓−is the vector of negative directional flows on all edges. Let𝐼∈R𝑛+denote the inlet values at the nodes. The variable vector is then
𝑥=
⎛⎜
⎜⎝ 𝑓+ 𝑓− 𝐼
⎞⎟
⎟⎠
∈R2𝑚+𝑛+ . (4)
Let𝑒𝑖and𝑒𝑆denote𝑛-dimensional indicator vectors for player𝑖and coalition𝑆, respectively:
𝑒𝑖𝑘=
{1 if𝑘=𝑖
0 otherwise and 𝑒𝑆𝑘=
{1 if𝑘∈𝑆 0 otherwise.
Let𝐸𝑆denote a diagonal matrix with𝑒𝑆over the diagonal, let1𝑛denote an𝑛-dimensional vector of 1’s, let𝐼𝑘×𝑘denote a𝑘dimensional identity matrix, and let0𝑘×𝑙denote a𝑘×𝑙-dimensional 0 matrix.
We now describe the linear programming problem and then inter- pret the constraints. We minimize the cost of supplying player 𝑖in coalition𝑆:
min𝑥
(1⊤𝑛𝐶 1⊤𝑛𝐶 𝑝⊤)
𝑥 (5)
such that [𝐴 𝐴 𝐸𝑆]
𝑥=𝑑𝑖𝑒𝑖 (6)
𝐼𝑗≤𝑠𝑗 (7)
(𝐼2𝑚×2𝑚 02𝑚×𝑛) 𝑥≤
(𝑞+ 𝑞− )
(8)
𝑥≥0 (9)
The objective function and the constraints are, actually, rather straightforward. We want to minimize the total cost that is the sum of the transportation costs in the positive direction, the transportation costs in the negative direction and the cost of gas itself. Naturally, gas does not flow over the same pipeline in both directions, it is only for the purposes of calculation that we separated the two flows. The first constraint explains that no gas is lost at any of the nodes: the total of inputs, inflows, outflows must add up to the consumption(𝑑𝑖)that is zero except for player𝑖. Inlets cannot exceed the supply capacities.
The last condition merely insists on positivity. Finally constraint(8)ex- plains that the flows must not exceed transmission capacities. Initially,3 we set𝑞+=𝑞−=𝑞. Then in each round we recalculate the capacities. If over pipeline𝑗the two capacities have been𝑞𝑗+and𝑞𝑗−and a flow𝑓was allocated, then the capacity in the positive direction becomes smaller:
𝑞𝑗+−𝑓, but at the same time the capacity in the opposite direction has been expanded to𝑞𝑗−+𝑓. The reason is that any flow in the opposite direction would be realized by reducing flow in this direction. This, of
3 Each pipeline has a characteristic transmission capacity in each direction:
these are rarely symmetric. We could use these different capacities. Note, however, that necessary compression facilities to inverse the flow can be built at a relatively small cost. We therefore chose to consider the maximum of the two capacities and calculate less constrained optima.
Fig. 1.Flow chart of the iterative flow calculations for a given coalition.
course relies on the assumption that gas is commodity where molecules are not labelled. We return to this assumption in the last section.
Let us summarize how the value of coalition𝑣(𝑆), is computed.
1. For each𝑖 ∈ 𝑆 we compute the country’s singleton cost𝑐(𝑖), which is just𝑝̄times its net consumption𝑑𝑖.
2. In the predefined order (which depends on𝑑𝑖) we compute the individual costs of the countries using the above LP iteratively.
After each iteration we update the network (i.e. the flows and capacities).
3. We set𝑣(𝑆) = ∑
𝑖∈𝑆𝑐({𝑖}) −𝑐(𝑆)where𝑐(𝑆)is the sum of the individual costs computed in Step 2.
3.6. Numerical example
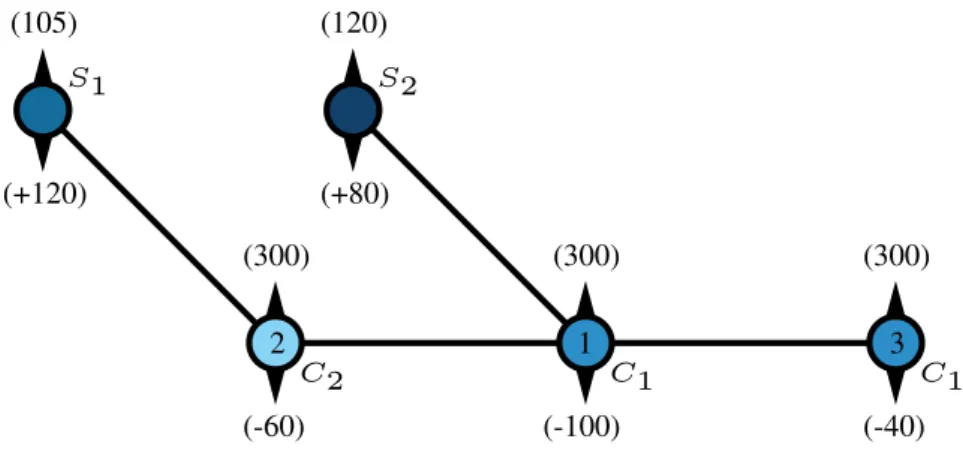
Let us see an example how this works in practice. Consider the network depicted by Fig. 2, where each node represents a country.
Four players are involved in this game, two suppliers𝑆1, 𝑆2, and two consumers𝐶1, 𝐶2. Note that𝐶1 is an aggregated region consisting of two countries. The numbers inside the nodes represent the priority ordering of the consumers, based on the decreasing ordering of their consumption values (100, 60 and 40 respectively), as described in Sec- tion3.3. The numbers below the nodes show the available gas capacity of the country in bcm. Positive gas capacity shows that the country is a supplier, while negative gas capacity means that the country is a consumer. The numbers above the nodes represent the sourcing cost, or – in case of consumer countries – the price of the backstop source (in m$s). To make things simple each pipeline has unlimited transfer capacity and uniform transportation cost: 10 m$/bcm.
Let us see how the worth of the grand coalition (𝑁) is calculated.
First we look at the individual costs denoted by 𝑐({𝑖}) in Eq. (1), which serve as reference in the process of determining the value of the
Fig. 2. Example of a gas network game. Numbers below the nodes correspond to production/consumption amounts, while numbers above the nodes correspond to production/backstop prices.
coalition. These cost are 𝑐(𝐶1) = (100 + 40)⋅300 = 42000 𝑐(𝐶2) = 60⋅300 = 18000
Thus the sum of the individual costs is 60 000 (suppliers have a cost of 0).
As we consider the grand coalition, each pipeline and gas source is available for the consumers. Consumer countries are served in their order of priority.
The left node of𝐶1is the largest consumer and the first in the order- ing. This node imports 100 units of gas from the cheapest source𝑆1for 125 m$/bcm (105 m$/bcm sourcing cost + 20 m$/bcm transportation cost).
In the case of this simple example, the calculations of optimal flows for the individual nodes are trivial, in general, this is done via solving the LP described in Eqs.(5)–(9).
Node𝐶2, the second in the ordering, imports 20 bcm from𝑆1and the rest (as𝑆1is depleted) from𝑆2. The problem is that the capacity of 𝐶2−𝐶1pipeline is used in the reverse direction. The network operators solve this by letting less amount of gas through, that is, 𝐶2 and the leftmost node of𝐶1 exchange gas molecules (but not suppliers). This technicality does not affect the import cost, which is20⋅(105 + 10) + 40⋅ (120 + 20) = 7900m$/bcm. Finally, the rightmost node of𝐶1 imports from 𝑆2 for40⋅(120 + 20) = 5600m$/bcm. The total cost and the characteristic value (cost saving) of the grand coalition is,
𝑐(𝑁) = 12500 + 7900 + 5600 = 34000 𝑣(𝑁) =∑
𝑖∈𝑁
𝑐(𝑖) −𝑐(𝑁) = 60000 − 34000 = 26000.
The same steps are repeated for each coalition (with the actually available lines and sources) to determine all costs and all values of the characteristic function (Appendix A,Table A.5).
Once the characteristic function is determined, the Shapley-values of the players can be determined via Eq.(2):
𝜙(𝑆1) = 6.72⋅103 𝜙(𝑆2) = 4.6⋅103 𝜙(𝐶1) = 7.97⋅103 𝜙(𝐶2) = 6.72⋅103.
4. Data and calculations
Considering the data, our first task is to specify the network we consider. Our focus is on the international connections; we need to make a number of simplifications and in the following we outline the steps we had to take to make the network manageable.
4.1. Network simplifications
In our network model nodes are countries and arcs are international pipelines.
By ‘‘country’’ we mean a geographical location and the arcs con- necting them are typically combinations of international and national pipeline segments. For the geographical location we use the main gas distribution hub; in Italy, a long country with hubs in the North and the South we picked an artificial location near Rome; in Germany, a coun- try with a circular distribution network and multiple hubs we picked an idealized point near Frankfurt. For idealized points pipeline-distances are estimated. Russia operates with delivery prices. We provided the sourcing costs at the border. There is no benefit in further modifying to some hypothetical location inside the country and subtracting the cost of internal transportation from the sourcing costs to later add them back during the computations. The same applies to North-Africa, taken as a single player.
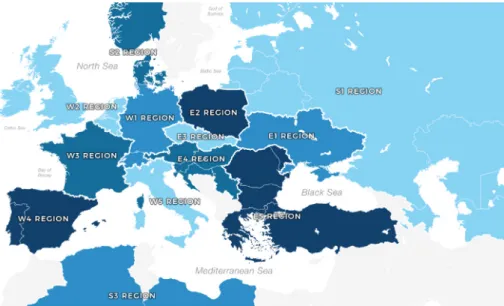
For computational reasons – the calculation of the Shapley-value is of non-polynomial complexity – we must reduce the number of players, therefore we calculate the values of groups of countriesor regions as players (Fig. 3).
Finally, parallel pipelines connecting the same two countries were combined into a single pipeline with aggregated capacity and average length. Transportation costs were fixed at 1.5 m$/bcm/100 km on each pipeline.
4.2. Liquefied natural gas
In the past years, Liquefied Natural Gas (LNG) appeared as a new player on the European gas market. Liquefying is an alternative trans- portation method with a very different cost structure: While the re- quired infrastructure is expensive and liquefying and gasifying is ex- pensive, as tankers use the evaporated gas – the loss – from their tanks, distance-related transportation costs are negligible. LNG is a cheaper transportation method for distances beyond 4000 km than delivering compressed natural gas (Economides et al.,2006).
On the other hand supply depends very much on world market conditions elsewhere. In the past East-Asia was the strongest LNG market, lately more LNG appeared on the European market. Initially to serve remote, poorly connected areas, but increasingly to input into the pipeline network.
We include LNG as a new player with zero consumption, a pro- duction corresponding to current LNG imports to Europe and links to every player with significant LNG terminals. The low transportation costs would create wormholes in the network, connecting remote nodes with free pipelines so we shift the LNG source cost to transportation cost by assuming long ‘‘pipelines’’ (see supplementary data in Appendix B). Overall this does not affect the cost of using LNG.
Fig. 3. Regions for calculating the Shapley-value.
Table 1
Sourcing costs and maximum supply by country.
Supplier Sourcing cost (m$/bcm) Supplied quantity (bcm)
Algeria 230 64.3
Central Asia 200 50.5
Denmark 225 1.9
Russia 220 192.8
Norway 225 118.7
LNG 240 56.6
backstop source 600 ∞
4.3. Sourcing costs
Table 1compiles the sourcing costs. We assumed that the Russian gas is somewhat cheaper than the Norwegian and North-African gas.
LNG is the most expensive alternative, however, it is still cheap com- pared to the price of the backstop source. Although the Central Asian sourcing cost appears to be lower than the Russian gas, considering the transfer costs of the circa 2000 km long pipeline that delivers the gas, it is equal in fact to the North-African sourcing cost.
4.4. Backstop sources
When local production and imports are insufficient to cover demand some of the demand for natural gas must be directed to other energy sources. In some cases this may be relatively easy, but in others nearly impossible. Ideally such a model should take a detailed replacement cost-function into account. In the absence of such information we have taken the replacement cost to be 600 m$/bcm. This is 2–3 times higher than the price of natural gas including transportation costs over the most extreme distances: consuming gas is always preferred even if it is far from the consumer. Our results proved to be robust to a wide range of replacement costs (see Section6.2).
4.5. Data sources and implementation
Fortunately, developments of the natural gas market are well doc- umented and data concerning national resources like oil and gas are published regularly by a number of reliable sources. Transmission capacities were compiled from the data sheet provided by the Inter- national Energy Agency (2020). Pipeline lengths were derived from the European Natural Gas Network Map published by the European
Table 2 Data sources.
Data type Sources Homepage
Transmission capacities IEA www.iea.org
Pipeline length ENTSOG www.entsog.eu
Production/Consumption BP, www.bp.com,
IndexMundi www.indexmundi.com
Data verification EIA, www.eia.gov,
HEA www.mekh.hu/home
Network of Transmission System Operators for Gas (ENTSOG,2019).
For consumption and production data we relied on the statistical year- book of BP (2019). Missing data were gathered from IndexMundi, which in turn uses CIA Factbook as a source. LNG data were obtained fromRogers et al.(2018) andInternational Energy Agency(2020). We used alternative sources to verify our database, like the US Energy Information Administration and the private database of Hungarian Energy and Public Utility Regulatory Authority. The reference year was chosen as 2019 since at the time of the analysis this year had the most complete data available. The dataset is provided in Appendix B (for the sources seeTable 2).
The model was implemented in the OPTI toolbox of MATLAB (Cur- rie and Wilson,2012), and the linear programming task was solved by the CLP solver, using the Dual simplex method (Vasilyev and Ivanitskiy, 2001).
5. Results
We have made use of a number of simplifications to translate a complex economic, engineering and even political problem into a simple mathematical setting. The calculation of the Shapley-values is based on the simplified game with 14 players. Beyond an evaluation of the current network we have looked at two modifications.
Firstly, the 2009 Ukrainian gas crisis, when Russia stopped exports via Ukraine was a scary incident for many countries in Southeastern Europe. More recent events did not reduce Ukrainian–Russian tensions and the risk of a future crisis remains high. As these pipelines are near- ing the end of their service life, in the absence of refurbishment plans, closing seems inevitable. Our first alternative scenario is therefore the stopping of all Russian (and Central-Asian) gas exports via Ukraine.
Perhaps the most important recent and future development of the network is the construction of the Nord Stream, the longest sub-sea
pipeline in the world, directly connecting Russia and Germany over the Baltic Sea. Nord Stream is already fully operational and its capacity is planned to be doubled by 2020; our Nord Stream 2 scenario looks at the network once the pipeline is completed.
At last, we consider a combined scenario: what happens if Nord Stream 2 is fully developed and then the Ukrainian connection is shut down: with the excess transportation capacities, Russia is likely to shift gas transports to the more efficient pipeline to save costs even if we ignore the geopolitical considerations (Vainio,2019a,b).
Our results showing savings per region are presented in Table 3 and visually inFig. 4. Since the figures exclude own consumption and are showing savings with respect to the estimated backstop costs, the absolute values are less interesting. What one should look at is the change in incomes or savings. Substantial changes may have drastic effects on a country’s consumer gas price and even its financial stability.
Shutting down the connection via Ukraine harms Ukraine... but also Russia. It clearly affects Central-Eastern Europe negatively, since this area is supplied mostly by Russia, via Ukraine. On the other hand Norway, Algeria and the LNG suppliers come out positively, since they can be more competitive. Poland improves its position as an important transit country, but Slovakia and the Czech Republic lose this role. Sim- ulations show that the Southeast Europe would have been negatively affected without the recently commissioned Turkstream pipeline (see Appendix B,Table B.7).
Expanding Nord Stream brings more Russian gas on the market, but we also see that some of the gas gets rerouted. Most of the benefit goes to Russia and Germany, while other suppliers and transit countries get competitors: Norway gets much cheap Russian gas right at its doorstep, Ukraine, Poland the Czech Republic, and Slovakia on the other hand, can now be bypassed with most of the Russian gas export.
It is interesting to see how a combination of these two changes would affect the players. Since Russia can bypass Ukraine via Nord Stream, we expect that it becomes less important to maintain the con- nection via Ukraine’s Brotherhood pipeline. We find that the country that reaps the benefits again is Germany: it gets a direct connection to cheap Russian gas, plus it becomes its main distributor in most of Europe. Central-, and Eastern Europe is harmed, although to different extent. Poland is less affected, due to the fact that it remains a transit country. On the other hand, Ukraine, Central Europe and some part of the Balkans are severely harmed in this scenario.
If we consider Nord Stream 2 as a certainty and view the closing of the Ukrainian route as possibility occurring with some fix probability, then we can take the expected outcome of the Nord Stream 2 and Combined scenarios. Looking at the data like this, Western Europe comes out as winner, while Eastern Europe suffer massive losses. From this viewpoint, the political stance of the protesting Eastern European countries seems perfectly logical.
Finally, let us address the validity of the fears expressed byFischer (2016),Riley(2016) andVatansever(2017), namely, that Russia will completely bypass the Ukrainian transit route. FromTable 3we see that the closure of the Ukrainian route would decrease the Shapley-value of Russia from+7.5% to 0.8%. A fair assumption would be that should Russia decide to cease the supply through Ukraine, the Russian natural gas export revenues would not decline more than 10%. The volume of Russian export4 in 2017 was around $342 bn from which natural gas took 5.2%, ca. $18 bn. Thus, the potential revenue loss for Russia is at most $2 bn.
In comparison, the Crimean conflict and the ensuing economic sanc- tions cost very likely more. Russian business newspaper, Kommersant estimated5 the yearly cost of integrating Crimea into Russia around
$3 bn. The effects of sanctions on Russian GDP is less clear.Kholodilin
4 https://oec.world/en/visualize/tree_map/hs92/export/rus/all/show/
2017/.
5 https://www.kommersant.ru/doc/2425287(In Russian).
and Netšunajev (2019) found weak evidence that Russian and euro area GDPs declined as a result of the sanctions. On the other hand, Bloomberg Economics calculated6that the economy of Russia is more than 10 percent smaller compared with what might have been expected at the end of 2013. Admittedly, part of the loss is due to the plummeting oil prices, but 60% of the gap, ca. $137 bn, can be attributed to the sanctions.7 The truth is possibly in between these two estimations.
There are other costs, which are hidden or even harder to measure numerically, e.g. that EU countries supported the suspension of nego- tiations over Russia’s joining the OECD and the International Energy Agency, for further details see a compilation inTyll et al.(2018).
The point is, the Crimean conflict provided a precedent where Rus- sia was willing to take financial losses to achieve political gains (both domestic and international). The question is whether the geopolitical gains exceed the costs of the closure of the Ukrainian route? In any case, a credible threat will likely increase the geopolitical influence of Russia.
6. Discussion
Our analysis uncovers strong predictions on the consequences of Nord Stream 2 — but is also built on a number of assumptions. In this section we discuss the possible relaxation of these assumptions and a sensitivity analysis to a wide range of parameters.
6.1. Relaxing assumptions
We have started our analysis with a series of simplifying assump- tions in Section3.3. Now we return to these to check if these could be relaxed — in the next subsection we also test the sensitivity to some of the assumed parameters.
Transportation costs. The differences between transportation costs is one of the arguments in support of Nord Stream 2 and yet we consider homogeneous costs. We are also aware of the differences between old pipelines and those still in the financing stage. Such differences could be accounted for artificially by an appropriate adjustment of pipeline length; a generalization to heterogeneous transportation costs is also feasible. For Nord Stream 2, an optimistic estimate of a 20%
cut of transportation costs is equivalent to an 3.6 m$/bcm saving on transportation costs, which is not a dealmaker for any of the countries vis-à-vis the Ukraine route. Sensitivity analysis reveals that such a change would alter the bargaining positions by a few decimal points.
Sourcing costs. In our model we assume uniform sourcing costs for all consumers.Weiner(2016) reports a substantial variance between the Russian export prices which cannot be explained by the difference of transportation costs alone.Hinchey(2018) concludes that alternative options, such as LNG, increase the consumers’ ability to lower prices and so, in practice, deals with different consumers may vary consider- ably. From a cooperative game theoretic point of view, however, it does not matter which country is successful in the price negotiations. The value of a coalition remains the same no matter whether the supplier or the consumer manages to impose his will. The final transactional price will only decide how this value is shared among the cooperating parties.
Our model, where any consumer can buy gas from consumers at the advertised price is somewhat different from reality. Consumers purchase gas in two different ways: At commodity exchanges at major pipeline hubs or – more commonly – via direct long-term contracts for undisclosed prices. For such contracts the supplier takes responsibility
6 https://www.bloomberg.com/news/articles/2018-11-16/here-s-one- measure-that-shows-sanctions-on-russia-are-working.
7 Russia’s GDP in 2013 was $2297 bn (source: https://data.worldbank.
org/).
Fig. 4. Relative benefits per region versus the baseline scenario.
Table 3
Relative benefits per region versus the baseline scenario.
Base Relative change to base
(m$) Ukraine Nord Stream 2 Combined
Suppliers
S1 Russia, Belarus, Central Asia, Finland, Baltics 33 592 −12.1% 7.5% 0.8%
S2 Norway, Denmark 17 026 28.5% −14.6% −2.0%
S3 Algeria, Libya 8 518 31.6% −5.2% 3.6%
S4 LNG 7 673 33.2% −7.0% −0.5%
Western Europe
W1 Germany, Switzerland 18 295 0.0% 13.8% 23.8%
W2 UK, Ireland, Benelux 13 605 −2.8% 3.3% 0.7%
W3 France 6 859 −13.2% 8.4% 5.0%
W4 Spain, Portugal 6 423 −6.6% 1.6% 0.1%
W5 Italy 11 114 −9.2% 3.5% −0.5%
Central Eastern Europe
E1 Ukraine 5 683 −71.8% −30.3% −69.9%
E2 Poland 4 040 39.4% −18.2% 0.7%
E3 Czech, Slovakia 2 996 −75.0% −22.0% −50.9%
E4 Austria, Hungary, Croatia, Serbia, Slovenia 3 206 −60.3% 5.5% −29.3%
E5 Turkey, Greece, Bulgaria, Romania, Moldova 11 040 12.6% −1.1% 8.0%
for the delivery reserving transportation capacities. Undisclosed prices mean that producers may apply favouritism and price discrimination between consumers. The European Union is moving towards a more transparent market similar to the one modelled in this paper.
In Section6.2, we look at an alternative scenario, where all sourcing costs (except LNG and backstop source) are set to 220 m$/bcm to check robustness.
6.2. Robustness analysis
We have performed a sensitivity analysis to see how much the obtained results depend on our modelling assumptions by looking at seven alternative setups:
•All sourcing costs equal to 220;
•Price of the backstop source is increased/decreased by 20%;
•Transportation costs are increased/decreased by 20%;
•Countries are ordered by consumption from the smallest to the largest one (i.e. in reverse order compared to the baseline);
• Transporting on Nord Stream 2 is 20% cheaper than the uniform transportation cost.
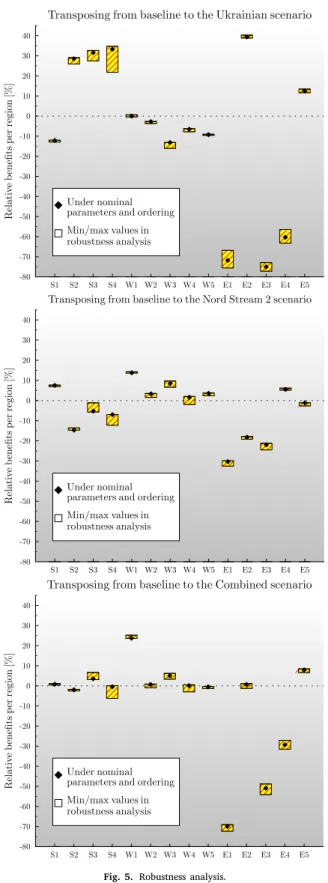
Rather than presenting figures for these artificial scenarios, inFig. 5, we compare the changes in Shapley-values between scenarios under the nominal parameters (black marker; data fromTable 3) to their range under varied parameters (box).
We have found that our results are robust: while each parameter has a measurable impact on the Shapley-value small variations do not change our main conclusion. In other words, the drastic shift in the bargaining power of the players is due to the changes in the network, namely the construction of Nord Stream 2 and the possible closure of the Ukrainian route.
6.3. Shapley value or nucleolus?
There are several approaches to ‘‘solve’’ cooperative games. We use the Shapley-value to calculate the power of the stakeholders. The nucleolus (Schmeidler,1969) is also a possible choice for measuring power (Montero,2013). The nucleolus is obtained through a lexico- graphic optimization process, where the profit of the poorest coalitions
Fig. 5. Robustness analysis.
are maximized first. In this sense the nucleolus implements a kind of social justice while the Shapley-value rewards productivity, as the players’ payoffs depend on their marginal contributions. Thus, it is not surprising that the Shapley-value proves to be a more reliable indicator of power in distribution networks (Hubert and Ikonnikova, 2011;Hubert and Coblani,2015).
Thecoreof a cooperative game shares the savings in a way that makes all coalitions happy, too: the total payoff of any coalition is greater than or equal to its characteristic value. The Shapley-value is commonly criticized for not – always – being a core allocation even if the core is non-empty. In such a case part of the network would refuse cooperation and would form a detached subnetwork reducing the overall saving. In practice, such a secession is not possible due to the complex legal framework supporting the pipeline network, but we may want to eliminate such risks or tensions anyway.
The nucleolus always lies inside the core — provided that the core is nonempty. There are various heuristics that make its computation simpler than that of the Shapley-value (Solymosi and Sziklai, 2016).
For the sake of completeness, we have also computed the nucleoli (Ap- pendix B,Table B.6) using a novel algorithm ofBenedek et al.(2020).
The result has been verified using the Kohlberg-criteria (Kohlberg, 1971).
Much likeHubert and Coblani(2015), we have found it difficult to interpret the numbers: Russia gains power when the Ukrainian route gets closed down, then loses power when the Nord Stream 2 is built?
It is also hard to imagine that Norway becomes twelve times more powerful in the Ukrainian scenario.
In two out of the four scenarios the advantage of the nucleolus vanishes as the core of the game is empty, but even if the core is nonempty it may produce counter-intuitive results: The cooperative game that depicts the gas trade is very similar to a so-called glove game. In a glove game owners of left (say suppliers) and right-hand gloves (consumers) form valuable pairs (trade to reduce costs). In such games, the core is strangely biased: The side with the fewer gloves gets all the value. In our story, as the Ukrainian route and Nord Stream 2 gets switched on and off, the model alternates between over- and undersupply, which in turn might swing any core-based solution from one extreme to the other.
Another possible explanation is that the nucleolus focuses on the satisfaction of coalitions without considering their size. For instance, the satisfaction of Poland, and its complement coalition (the rest of the countries) are treated equally important. Variants of the nucleolus, the so-calledper-capita nucleolus (Grotte,1970), which considers the satisfactions of coalitions normalized by their sizes or theproportional nucleolus (Young et al., 1982), which considers relative satisfaction, might be more suitable for such games if one insist on having a core based solution.
7. Conclusion and policy implications
One interpretation of our result is that each country in Europe is governed by self interest. The past positions/actions taken by the countries strengthen this analysis.Jirušek(2020) inspects the attitude of Visegrád countries towards the Nord Stream 2 project and concludes that despite the declared unity, the Visegrád Group members pursue their own goals determined by economic interests or long-standing foreign policy stance.
Russia and Germany are the main beneficiaries and supporters of the Nord Stream 2 project. Northeast Europe, namely, Poland, Ukraine, Czech Republic and Slovakia oppose it because they will lose their advantage as transit countries. Central- and Eastern Europe fear that the construction of Nord Stream 2 will ultimately result in closing down the Ukrainian route in which case there will be a shortage of cheap Russian gas in the region. The Southeastern part is less affected thanks to the re- cently commissioned Turkstream pipeline. Without Turkstream, Turkey and neighbouring countries would have been in a much more difficult position in the case of a supply disruption via Ukraine. Network flows show, that even if Nord Stream 2 would provide significantly cheaper gas, the benefits would never reach the Eastern part of Europe. A way to maintain solidarity would be to introduce a compensation scheme or to support the construction of a pipeline in the direction of the cancelled Nabucco or South Stream pipelines.