-
Contents lists available atsciencedirect.com Journal homepage:www.elsevier.com/locate/vhriEconomic Evaluation
Productivity Loss in Patients With Chronic Diseases: A Pooled Economic Analysis of Hungarian Cost-of-Illness Studies
Omar Rashdan, MSc (Pharm),1,2,*Valentin Brodszky, MD, PhD2
1Doctoral School of Business and Management, Corvinus University of Budapest, Budapest, Hungary;2Department of Health Economics, Corvinus University of Budapest, Budapest, Hungary
A B S T R A C T
Objectives:To assess productivity loss (PL) variations across a set of chronic diseases and analyze significant PL drivers (demographics, health status, healthcare resource use) in Hungary.
Methods:Data from 11 cost-of-illness studies (psoriasis, dementia, systemic sclerosis, multiple sclerosis, benign prostatic hyperplasia, Parkinson’s disease, psoriatic arthritis, rheumatoid arthritis, schizophrenia, epilepsy, and diabetes) were pooled, and patient-level data were analyzed. A weighted multiple linear regression analysis was run to identify significant PL indicators. All costs were adjusted to 2018 euro rates and PL was further presented as a proportion of gross domestic product/capita, facilitating results comparability and transferability.
Results:The dataset comprised 1888 patients from 11 chronic diseases. The average indirect cost/(gross domestic product/
capita) ratio was highest in schizophrenia (72.4%) and rheumatoid arthritis (71.3%) and lowest in benign prostatic hyperplasia (1.6%). Correlation results infer that a higher EuroQol 5-dimension 3-level index score was significantly associated with lower PL. The number of hospital admissions was the main contributor toward increasing PL among resource use indicators. Age and sex showed inconsistent and insignificant correlations with PL. In regression analysis, a better EuroQol 5-dimension 3-level index score and higher education were consistently associated with decreasing PL in all models.
Conclusions:This article will enable health decision makers to understand the importance of adopting a societal perspective for chronic disease reimbursement decisions. The correlation between PL and health status supports that timely started effective treatments may prevent patients from losing their workability.
Keywords: benign prostatic hyperplasia, diabetes, dementia, epilepsy, Hungary, productivity loss, indirect cost, multiple sclerosis, psoriasis, systemic sclerosis, Parkinson’s disease, psoriatic arthritis, rheumatoid arthritis, schizophrenia.
VALUE IN HEALTH REGIONAL ISSUES. 2020; 22(C):75–82
Introduction
As a basic term, productivity is simply a measure of output per unit of input. For health professionals, the term productivity loss (PL) is defined as the output loss due to health issues corre- sponding to reduced work output by the productive person, whether paid or unpaid.1Direct treatment costs of chronic dis- eases are rapidly increasing and are only expected to keep increasing with the continuous development of the new costly yet effective biologic agents.2 This has been placing an increasing pressure on policy makers to reimburse the most socially sus- tainable health interventions. Therefore, considerable attention to the adoption of a societal perspective in health economic evalu- ations is starting to emerge.3Although a societal perspective in
health economic evaluation is often not mandatory, the inclusion of such costs into health economic evaluations can maximize so- cial welfare in the long run.4In 2016, The Netherlands released its updated pharmacoeconomic guidelines mandating the conduc- tion of health economic analysis from a societal perspective. These guidelines also go further to specify the use of friction cost as the prescribed productivity cost estimation method.5,6More countries are expected to imitate The Netherlands’ pharmacoeconomic guidelines and start mandating a societal perspective in health economic evaluations.
One prevalent issue in PL evaluations is the weak international transferability of the results owing to the fragile standardization of current indirect costs reporting methodologies. Knies et al7 investigated the weak PL transferability issue and found that the
Conflict of interest: The authors have nothing to disclose.
* Address correspondence to: Omar Rashdan, MSc (Pharm), Doctoral School of Business and Management, Corvinus University of Budapest, Fövám tér 8, 1093 Budapest, Hungary. Email:ph.rashdan@gmail.com
2212-1099 - see front matterª2020 ISPOR–The professional society for health economics and outcomes research. Published by Elsevier Inc. This is an open access article under the CC BY-NC-ND license (http://creativecommons.org/licenses/by-nc-nd/4.0/).
https://doi.org/10.1016/j.vhri.2020.07.572
complication starts from the absence of international consensus on the inclusion of the societal perspective in health economic evaluations. Moreover, whenever a societal perspective is to be adopted, differences in PL measurement and valuation methods further contribute to the results transferability complexity. For example, either costs or quality-adjusted life-years are usually adopted for PL valuation; this alone imposes a major hurdle on results transferability and could result in many complications and errors, such as double counting when converting the results be- tween costs and quality-adjusted life-years and vice versa.
The objective of this article is to assess the PL variations across a set of chronic diseases and analyze PL drivers (demographics, health status, healthcare resource use) in Hungarian patients. Such economic analysis can aid health policy makers in visualizing the PL impact on chronic disease patients, by directly demonstrating
the monetary value of adopting a societal perspective for reim- bursement decisions. Moreover, to enhance the transferability of ourfindings, all costs were calculated and presented in unified, adjusted monetary terms (ie, PL as a percentage of gross domestic product [GDP]/capita in 2018), facilitating comparison with similar international cost-of-illness (COI) studies.
Methods
Data Sources and Tools
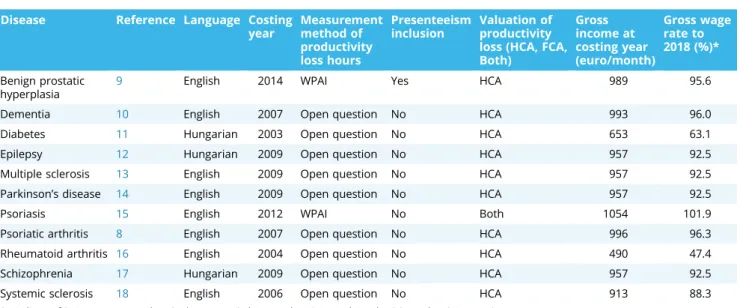
This study uses data from 11 noninterventional, cross- sectional, retrospective COI studies conducted in different medi- cal centers in Hungary between 2003 and 2015. Our analysis encompassed the following 11 chronic diseases: psoriatic Table 1. Characteristics of the included COI studies: language, costing year, PL methods, gross income, and wage rate.
Disease Reference Language Costing year
Measurement method of productivity loss hours
Presenteeism inclusion
Valuation of productivity loss (HCA, FCA, Both)
Gross income at costing year (euro/month)
Gross wage rate to 2018 (%)*
Benign prostatic hyperplasia
9 English 2014 WPAI Yes HCA 989 95.6
Dementia 10 English 2007 Open question No HCA 993 96.0
Diabetes 11 Hungarian 2003 Open question No HCA 653 63.1
Epilepsy 12 Hungarian 2009 Open question No HCA 957 92.5
Multiple sclerosis 13 English 2009 Open question No HCA 957 92.5
Parkinson’s disease 14 English 2009 Open question No HCA 957 92.5
Psoriasis 15 English 2012 WPAI No Both 1054 101.9
Psoriatic arthritis 8 English 2007 Open question No HCA 996 96.3
Rheumatoid arthritis 16 English 2004 Open question No HCA 490 47.4
Schizophrenia 17 Hungarian 2009 Open question No HCA 957 92.5
Systemic sclerosis 18 English 2006 Open question No HCA 913 88.3
FCA indicates friction cost approach; HCA, human capital approach; WPAI, Work Productivity and Activity Impairment.
*Average nominal gross wage in 2018 in Hungary was 1034.5 euros (Source: Hungarian Statistical Office website23).
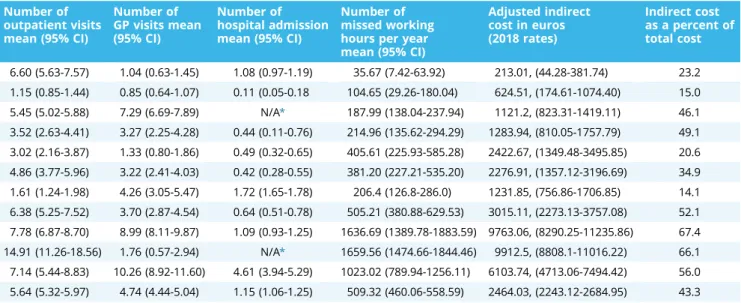
Table 2. Disease-specific demographics, resource use, health status, adjusted indirect cost, and indirect cost as a percent of total cost.
Disease name Total number of patients
Number of patients below 64
Age mean (95% CI)
Higher education patients N (%)
Female N (%) EQ-5D-3L index (95% CI)
Disease duration in years (95% CI) Benign prostatic
hyperplasia
246 49 70.59 (69.56-71.61) 74 (30%) 0 (0.0) 0.85 (0.83-0.88) 5.56 (4.95-6.18)
Dementia 88 6 77.55 (75.75-79.37) 12 (14%) 52 (59.1) 0.39 (0.32-0.46) 4.32 (3.11-5.53)
Diabetes 480 331 52.56 (51.08-54.05) N/A* 267 (55.6) 0.77 (0.74-0.79) 15.60 (13.72-15.48) Epilepsy 100 97 36.65 (34.16-39.14) 18 (18%) 58 (58.0) 0.78 (0.74-0.86) 15.45 (13.04-17.87) Multiple sclerosis 68 67 37.96 (35.74-40.17) 28 (42%) 48 (70.6) 0.67 (0.60-74) 7.02 (5.55-8.48) Parkinson’s disease 110 55 63.28 (61.15-6541) 40 (36%) 36 (32.7) 0.58 (0.52-0.63) 8.22 (7.10-9.33) Psoriasis 200 157 50.66 (48.83-52.50) 40 (20%) 64 (32.0) 0.69 (0.65-74) 21.44 (19.80-23.08) Psoriatic arthritis 183 149 50.15 (48.25-52.04) 43 (24%) 105 (57.4) 0.47 (0.42-52) 9.24 (7.89-10.59) Rheumatoid arthritis 255 182 55.45 (53.93-56.97) 42 (17%) 218 (85.5) 0.46 (0.42-0.50) 9.10 (7.92-10.27)
Schizophrenia 78 73 44.24 (41.30-47.19) 9 (12%) 36 (46.2) 0.64 (0.57-0.71) N/A*
Systemic sclerosis 80 56 57.39 (55.25-59.52) 16 (20%) 72 (90.0) 0.58 (0.52-0.64) 7.16 (5.69-8.64)
Total 1888 1222 55.17 (54.44-55.91) 248 956 (50.6) 0.66 (0.64-0.67) 11.40 (10.92-11.88)
arthritis,8 benign prostatic hyperplasia (BPH),9 dementia,10dia- betes,11 epilepsy,12 multiple sclerosis,13 Parkinson’s disease,14 psoriasis,15rheumatoid arthritis,16schizophrenia,17and systemic sclerosis.18Patient-level raw data on demographics, health-related quality of life, resource use, and productivity loss for each disease were collected directly from the patients (or caregivers in case of dementia) by the department of health economics at Corvinus University of Budapest, and were later combined for this work.
EuroQol 5-dimension 3-level (EQ-5D-3L) index scores were measured using the validated Hungarian version. The EQ-5D-3L is a group of instruments used to provide a perception of health state, has been used and validated in many disease areas over the past 30 years,19and is the health status tool of choice recom- mended by many health technology assessment organizations.20 Local ethical approvals were obtained if the COI was conducted in a single institution, while national ethical approval was ac- quired in case the study was conducted in different medical centers within the country. All patients signed an informed con- sent form. Specific information on each included COI study, such as costing year, gross wage, productivity loss measurement method (Work Productivity and Activity Impairment [WPAI] or open question), and the adopted costing approach (ie, human capital or friction cost) were extracted by the authors from the relevant publications. The WPAI questionnaire is an instrument developed to measure a patient’s impairment owing to a health condition, for both paid (absenteeism and presenteeism) and unpaid work.21The human capital approach (HCA) and the friction cost approach are the 2 dominating methods used for the valua- tion of PL in paid work and are preferred given their simple, direct monetary results. Both methods have specific limitations and advantages and are discussed elsewhere.22
Costing
Cost-of-illness calculations were performed from a societal perspective (including direct medical, direct nonmedical, and in- direct costs). All COI studies applied similar methods to measure time off work and resource use. Patients (or caregivers in de- mentia) were asked about sick leaves and their employment sta- tus, including whether they were entitled to disability pension owing to the disease. Indirect costs for each disease were
calculated separately by multiplying the number of lost productive hours with the national gross wage in the corresponding study year. Adjusted indirect costs were then calculated for each disease to reflect the value in 2018 euro rates by dividing the average gross wage for 2018 by the average gross wage for the study year to obtain a specific conversion factor, which was then multiplied with the corresponding disease indirect cost to obtain the adjusted PL costs in unified 2018 euro rates. Furthermore, indirect costs were expressed as a percentage of GDP per capita for 2018 (indirect costs[GDP/capita]) by dividing each disease’s adjusted indirect cost by the national GDP/capita in Hungary for 2018. The average national gross wage in Hungary for 2018 was acquired from the Hungarian Central Statistical Office website,23 which amounted to Hungarian forint 329 900 = 1034.5 euros (318.9 Hungarian forint = 1 euro). Similarly, the 2018 Hungarian GDP/
capita (13 686 euros) was obtained from the Hungarian Central Statistical Office website.24
Statistical Methods and Study Variables
SPSS 23 software (SPSS Inc, Chicago, IL, USA) was used for data management and statistical analysis. The attributes investigated in our analysis fall into 4 categories: PL variables (ie, number of missed working hours and indirect costs), demographic variables (ie, age, sex, and education level), resource use variables (ie, number of general practitioner [GP] visits, number of outpatient visits, number of hospital admissions, and informal care use), and health status variables (disease duration, EQ-5D-3L index). Dis- ease dummy variables for each disease were also created to address the association (if any) between any specific disease and PL. To measure the sex (male/female), educational level (univer- sity degree/no university degree), and informal care (received/did not receive) impact on PL, analysis of variance was used to compare disease group means of lost productive hours for each subgroup, whereas Spearman’s rho was employed to identify significant correlations between resource use, health status, and age variables and PL.
Weighted linear regression analysis was also run to identify significant PL indicators and construct a predictive model for PL in chronic disease patients in Hungary. A weighting variable was calculated to account for the differences in the sample size
Number of outpatient visits mean (95% CI)
Number of GP visits mean (95% CI)
Number of hospital admission mean (95% CI)
Number of missed working hours per year mean (95% CI)
Adjusted indirect cost in euros (2018 rates)
Indirect cost as a percent of total cost
6.60 (5.63-7.57) 1.04 (0.63-1.45) 1.08 (0.97-1.19) 35.67 (7.42-63.92) 213.01, (44.28-381.74) 23.2 1.15 (0.85-1.44) 0.85 (0.64-1.07) 0.11 (0.05-0.18 104.65 (29.26-180.04) 624.51, (174.61-1074.40) 15.0 5.45 (5.02-5.88) 7.29 (6.69-7.89) N/A* 187.99 (138.04-237.94) 1121.2, (823.31-1419.11) 46.1 3.52 (2.63-4.41) 3.27 (2.25-4.28) 0.44 (0.11-0.76) 214.96 (135.62-294.29) 1283.94, (810.05-1757.79) 49.1 3.02 (2.16-3.87) 1.33 (0.80-1.86) 0.49 (0.32-0.65) 405.61 (225.93-585.28) 2422.67, (1349.48-3495.85) 20.6 4.86 (3.77-5.96) 3.22 (2.41-4.03) 0.42 (0.28-0.55) 381.20 (227.21-535.20) 2276.91, (1357.12-3196.69) 34.9 1.61 (1.24-1.98) 4.26 (3.05-5.47) 1.72 (1.65-1.78) 206.4 (126.8-286.0) 1231.85, (756.86-1706.85) 14.1 6.38 (5.25-7.52) 3.70 (2.87-4.54) 0.64 (0.51-0.78) 505.21 (380.88-629.53) 3015.11, (2273.13-3757.08) 52.1 7.78 (6.87-8.70) 8.99 (8.11-9.87) 1.09 (0.93-1.25) 1636.69 (1389.78-1883.59) 9763.06, (8290.25-11235.86) 67.4 14.91 (11.26-18.56) 1.76 (0.57-2.94) N/A* 1659.56 (1474.66-1844.46) 9912.5, (8808.1-11016.22) 66.1 7.14 (5.44-8.83) 10.26 (8.92-11.60) 4.61 (3.94-5.29) 1023.02 (789.94-1256.11) 6103.74, (4713.06-7494.42) 56.0 5.64 (5.32-5.97) 4.74 (4.44-5.04) 1.15 (1.06-1.25) 509.32 (460.06-558.59) 2464.03, (2243.12-2684.95) 43.3
EQ-5D-3L indicates EuroQol 5-dimension 3-level index; GP, general practitioner.
*N/A: Data missing from the original database.
Table 2. Continued
between diseases, by dividing 100 by the number of patients in each disease group to obtain a disease-specific value. The result- ing weight value for each disease was then incorporated into our models as the regression weighting variable, omitting the effect of sample size in our models. Owing to some missing information in our database; 4 regression models were constructed in which the number of missed working hours per year was the dependent variable, and BPH was the reference variable (constant), given that it imposes the lowest PL among investigated diseases. The dif- ference among the 4 models is as follows: the first 2 models (models 1 and 2) included all the 1 disease populations with the following independent variables—age, disease duration, EQ-5D-3L index, sex, number of GP visits, and number of outpatient visits— whereas the latter 2 models (models 3 and 4) excluded diabetes patients while using 2 additional independent variables (ie, informal care and education level). Models 1 and 3 used the full patient population, while models 2 and 4 only used patient populations under 64 years old, which is the average retirement
age in Hungary,25simulating the working population within our sample.
Results
Characteristics of Studies
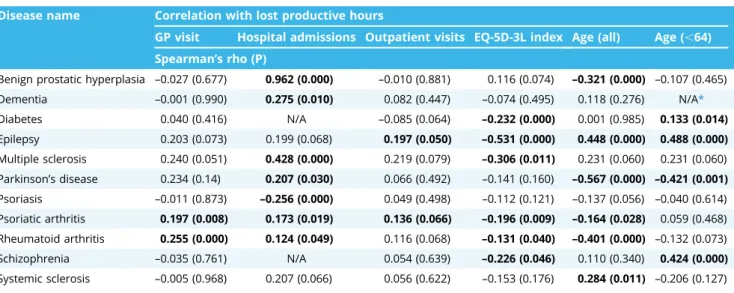
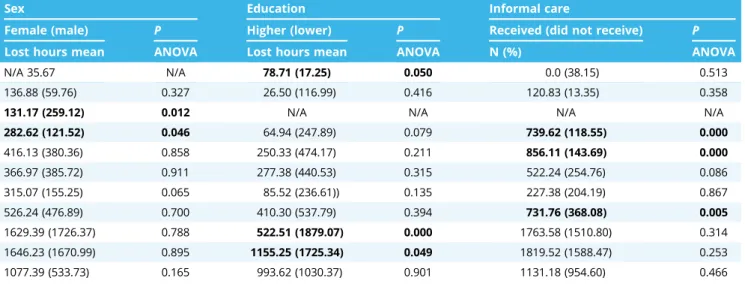
Three of the 11 COI studies were published in Hungarian lan- guage and 8 in English. Patient sample sizes ranged between 68 (multiple sclerosis) and 480 (diabetes), whereas the total popu- lation comprised 1888 patients, including 1222 patients who were of working age (under 64). The predominant productivity valua- tion approach adopted was the HCA, with 1 article using both HCA and friction cost approach together. For all 11 studies, opportunity cost method was employed using the national gross average wage for the study year. Simple open question was the dominant PL measurement method, with only 2 COI studies using the WPAI Table 3. Disease-specific relationship of PL (hours lost/year) with demographics, resource use, and health status indicators.
Disease name Correlation with lost productive hours
GP visit Hospital admissions Outpatient visits EQ-5D-3L index Age (all) Age (,64) Spearman’s rho (P)
Benign prostatic hyperplasia –0.027 (0.677) 0.962 (0.000) –0.010 (0.881) 0.116 (0.074) –0.321 (0.000) –0.107 (0.465) Dementia –0.001 (0.990) 0.275 (0.010) 0.082 (0.447) –0.074 (0.495) 0.118 (0.276) N/A*
Diabetes 0.040 (0.416) N/A –0.085 (0.064) –0.232 (0.000) 0.001 (0.985) 0.133 (0.014)
Epilepsy 0.203 (0.073) 0.199 (0.068) 0.197 (0.050) –0.531 (0.000) 0.448 (0.000) 0.488 (0.000) Multiple sclerosis 0.240 (0.051) 0.428 (0.000) 0.219 (0.079) –0.306 (0.011) 0.231 (0.060) 0.231 (0.060) Parkinson’s disease 0.234 (0.14) 0.207 (0.030) 0.066 (0.492) –0.141 (0.160) –0.567 (0.000) –0.421 (0.001) Psoriasis –0.011 (0.873) –0.256 (0.000) 0.049 (0.498) –0.112 (0.121) –0.137 (0.056) –0.040 (0.614) Psoriatic arthritis 0.197 (0.008) 0.173 (0.019) 0.136 (0.066) –0.196 (0.009) –0.164 (0.028) 0.059 (0.468) Rheumatoid arthritis 0.255 (0.000) 0.124 (0.049) 0.116 (0.068) –0.131 (0.040) –0.401 (0.000) –0.132 (0.073) Schizophrenia –0.035 (0.761) N/A 0.054 (0.639) –0.226 (0.046) 0.110 (0.340) 0.424 (0.000) Systemic sclerosis –0.005 (0.968) 0.207 (0.066) 0.056 (0.622) –0.153 (0.176) 0.284 (0.011) –0.206 (0.127)
Figure 1.Indirect cost per patient as a percentage of (GDP/capita) for each investigated chronic disease.
BPH indicates benign prostatic hyperplasia.
questionnaire. The characteristics of the investigated COI studies are summarized inTable 1.
Descriptive Results by Disease
Table 2 summarizes the demographics, health status, and healthcare resource use for each disease. Overall, patients average age ranged between 36 and 77 years. Female population comprised roughly half of the total population, with the highest percentage among systemic sclerosis patients and lowest in pso- riasis (apart from BPH). Higher education levels were noticed among multiple sclerosis patients, while schizophrenia patients reported the lowest educational levels. Health status score was highest in BPH and lowest in dementia patients, while psoriasis patients had the longest disease duration. In resource use, schizophrenia patients visited outpatient clinics more frequently than other chronic diseases, while systemic sclerosis patients were highest in GP visits, and were admitted to hospitals more frequently than other chronic disease patients.
Regarding disease-specific PL, highest mean of lost productive hours was attributed to schizophrenia with a yearly average of 1660 lost hours per patient, followed closely by musculoskeletal diseases (ie, rheumatoid arthritis and systemic sclerosis). Benign prostatic hyperplasia, on the other hand, caused the lowest lost productive hours per year among the investigated chronic ill- nesses. This reflected on the yearly indirect cost means with schizophrenia on top (9912 euros) followed closely by rheumatoid arthritis, whereas BPH embarked the lowest indirect costs across the investigated chronic diseases. Similarly, the average indirect cost as a percent of GDP/capita was highest in schizophrenia and rheumatoid arthritis, but lowest in BPH. Lost productive hours and cost means are summarized inTable 2, andFigure 1shows a bar chart of indirect cost as a percentage of GDP/capita for each investigated chronic disease.
Determinants of PL
Table 3 shows the association of PL with demographic, resource use, and health status variables. Analysis of variance of disease PL means revealed that sex differences were significant only in diabetes and epilepsy, whereas higher education levels
resulted in significant PL in patients with BPH, rheumatoid arthritis, and schizophrenia. In resource use, we found that a higher number of hospital admissions significantly increases PL in BPH, dementia, multiple sclerosis, Parkinson’s disease, psoriasis, psoriatic arthritis, and rheumatoid arthritis patients, but it significantly decreases PL in psoriasis patients. A higher frequency of GP visits was a significant driver for PL in Parkinson’s patients, whereas the number of outpatient visits was a significant PL driver in epilepsy and psoriatic arthritis patients. Similarly, patients who received informal care reported significant PL in epilepsy, multiple sclerosis, and psoriatic arthritis. Similar but not significant differ- ences were observed in all other diseases for informal care use.
Overall, resource use variables, where significant, correlated positively toward lost productive hours, with the number of hospital admissions as the dominant resource use, indirect cost driver.
In health status, the EQ-5D-3L index significantly correlated negatively with PL in diabetes, epilepsy, multiple sclerosis, psori- atic arthritis, and rheumatoid arthritis, imposing lower PL with higher scores. As for age impact on PL, patient populations under 64 correlated positively with PL in diabetes, epilepsy, and schizophrenia, but they correlated negatively with Parkinson’s disease patients (owing to high average age). On the other hand, when the whole patient population of all ages was considered, age correlated positively with epilepsy and systemic sclerosis, whereas it correlated negatively with BPH, Parkinson’s disease, psoriatic arthritis, and rheumatoid arthritis patients.
Weighted Regression Modeling
Four predictive models were constructed with resulting R squared values of 0.354, 0.404, 0.367, and 0.420 for models 1 through 4, respectively. The resulting unstandardized beta co- efficients and their corresponding significance for our models are presented inTable 4. In model 1, older age and better health status (EQ-5D-3L index) significantly decrease PL. Patients with diabetes, epilepsy, or psoriasis also significantly contribute to decreasing PL.
On the other hand, longer disease duration and more frequent GP visits, along with being a BPH, rheumatoid arthritis, schizophrenia, or a systemic sclerosis patient, all significantly contribute to
Sex Education Informal care
Female (male) P Higher (lower) P Received (did not receive) P
Lost hours mean ANOVA Lost hours mean ANOVA N (%) ANOVA
N/A 35.67 N/A 78.71 (17.25) 0.050 0.0 (38.15) 0.513
136.88 (59.76) 0.327 26.50 (116.99) 0.416 120.83 (13.35) 0.358
131.17 (259.12) 0.012 N/A N/A N/A N/A
282.62 (121.52) 0.046 64.94 (247.89) 0.079 739.62 (118.55) 0.000
416.13 (380.36) 0.858 250.33 (474.17) 0.211 856.11 (143.69) 0.000
366.97 (385.72) 0.911 277.38 (440.53) 0.315 522.24 (254.76) 0.086
315.07 (155.25) 0.065 85.52 (236.61)) 0.135 227.38 (204.19) 0.867
526.24 (476.89) 0.700 410.30 (537.79) 0.394 731.76 (368.08) 0.005
1629.39 (1726.37) 0.788 522.51 (1879.07) 0.000 1763.58 (1510.80) 0.314
1646.23 (1670.99) 0.895 1155.25 (1725.34) 0.049 1819.52 (1588.47) 0.253
1077.39 (533.73) 0.165 993.62 (1030.37) 0.901 1131.18 (954.60) 0.466
Note.Significant variables in bold font. N/A, data missing from the original database.
ANOVA indicates analysis of variance; EQ-5D-3L, EuroQol 5-dimension 3-level index; GP, general practitioner.
*Only 6 patients are under 64. Spearman correlation could not be performed.
Table 3. Continued
increasing PL. In contrast, for model 2 (under 64), longer disease duration, more frequent GP and outpatient visits, along with being a rheumatoid arthritis, schizophrenia, or a systemic sclerosis pa- tient, all significantly contribute to increasing PL, whereas only higher health status scores (EQ-5D-3L index) decrease PL in the working population.
In model 3, older age, higher education, and better health status (EQ-5D-3L index), in addition to patients with epilepsy, multiple sclerosis, or psoriatic arthritis, all significantly contribute to decreasing PL. On the other hand, longer disease duration, informal care utilization, along with being a BPH, rheumatoid arthritis, schizophrenia, or a systemic sclerosis patient all significantly in- crease PL. In contrast, in model 4 (under 64), longer disease duration, informal care utilization, in addition to being a rheumatoid arthritis, schizophrenia, or a systemic sclerosis patient, significantly contribute to increasing PL, while only higher education and health status scores (EQ-5D-3L index) decrease PL in the working population.
Discussion
In 2012, the World Health Organization announced chronic diseases as one of the major challenges facing nations worldwide
in the current century.26,27This article presents the largest set of chronic disease indirect cost results in the Central and Eastern Europe region. Productivity loss data from 11 COI studies have been pooled, adjusted, and compared to reflect each disease’s current total and indirect cost estimates, and were further pre- sented using internationally transferrable monetary terms. Sig- nificant healthcare resource use, health status, and demographic variables driving PL in chronic disease patients were also identi- fied and quantified. Currently, the responsibility of providing healthcare services in Hungary for primary care, outpatient care, and inpatient care lies within the government, whereas the direct responsibility forfinancing healthcare services is managed by the National Health Insurance Fund Administration.28It is mandatory for all citizens living in Hungary to take the national health in- surance; however, private insurance policies can be bought as well.29The current Hungarian health economic guideline recom- mends the analysis to be conducted from the healthcare system perspective, and later mentions that a societal perspective is only optional.30
Our PL correlation results infer that a better health status score was the only indicator with a consistent negative impact on PL (although not always significant). On the other hand, in resource use, the number of hospital admissions was the highest Table 4. Weighted linear regression models 1 through 4.
Linear regression
Model 1 (all patients) Model 2 (patients,64) Model 3 (all patients) Model 4 (patients,64) Unstandardized
coefficients P Unstandardized
coefficients P Unstandardized
coefficients P Unstandardized coefficients P
B B B B
Constant 1238.037 .000 364.536 .145 1367.792 .000 386.283 .181
Age –12.788 .000 2.530 .361 –15.064 .000 2.047 .542
Sex 53.515 .273 60.597 .320 66.489 .250 67.942 .349
Disease duration 11.971 .000 15.406 .000 11.965 .000 14.627 .001
High education - - - - –166.925 .006 –255.823 .001
Number of GP visits per year
9.920 .020 11.619 .021 5.506 .280 7.938 .186
Number of outpatient visits per year
3.954 .169 7.767 .026 4.181 .200 7.510 .058
Received informal care - - - - 209.539 .001 273.607 .001
EQ-5D-3L index –473.004 .000 –521.625 .000 –390.339 .000 –408.674 .000
Dementia –54.327 .624 –523.890 .126 –198.042 .126 –705.805 .066
Diabetes –322.717 .006 –208.146 .295 - - - -
Epilepsy –427.851 .001 –135.420 .499 –541.018 .000 –211.540 .356
Multiple sclerosis –183.109 .135 103.524 .591 –318.283 .026 13.168 .952
Parkinson’s disease 90.051 .385 375.498 .052 35.475 .762 314.245 .146
Psoriasis –383.147 .001 –282.779 .150 –430.304 .002 –308.265 .167
Psoriatic arthritis –55.996 .619 126.273 .503 –141.194 .270 61.999 .770
Rheumatoid arthritis 1190.580 .000 1550.241 .000 1102.364 .000 1453.579 .000
Schizophrenia 1061.936 .000 1308.953 .000 932.835 .000 1196.595 .000
Systemic sclerosis 529.563 .000 919.060 .000 466.638 .000 846.501 .000
R squared 0.354 0.404 0.367 0.420
Adjusted R squared 0.347 0.395 0.358 0.407
Note.Variables unstandardized B coefficients and their corresponding significance values. BPH was used as the reference variable for all models (lowest indirect cost).
Significant variables are in bold font. Results are significant atP,.005.
BPH indicates benign prostatic hyperplasia; EQ-5D-3L, EuroQol 5-dimension 3-level index; GP, general practitioner.
contributor toward increased PL in most of the investigated chronic diseases. This is mainly attributed to the fact that a hos- pital admission is indicating a more severe disease than other resource use indicators employed in our analysis (ie, GP visit, outpatient visit). Age, on the other hand, had mixed PL impacts, depending on the disease type as well as the age group investi- gated (under or above 64 years). Although the difference in sex PL means was apparent in most diseases, it was inconsistent for a specific sex (eg, diabetes and epilepsy).
Regression modeling revealed that only health status score (ie, ED-5D-3L) had a consistent, significant negative impact on PL (decreasing lost productive hours) across all 4 models. Similarly, in models where education level was accounted for (ie, models 3, 4), a significant decrease in PL was observed with higher educational levels. This was addressed by Zimmerman et al,31 who investi- gated higher education impact on overall health and proposed a hypothesis that adults with relatively higher levels of education tend to have greater socioeconomic resources to pursue a healthy lifestyle, and that they can also be better equipped with the health literacy level required to draw on later in their lives. As for the role of sex in PL modeling, none of our 4 predictive modelsflagged sex as a significant PL variable. Rather, the main contributor in all of our 4 models was being a patient of 1 of the 3 most cost-intensive diseases (ie, schizophrenia and musculoskeletal diseases).
As demonstrated in our article, indirect costs can comprise a large chunk of the total economic burden of chronic diseases.
Health policy makers often disregard indirect costs for various reasons, such as the scarcity and complexity of available local evidence to adopt a societal perspective. Moreover, the weak in- ternational transferability of health economic evaluations further imposes more challenges. Heterogeneity of COI reporting is a major issue in results transferability, mainly arising from the lack of methodological consensus on perspective, measurement in- struments, study designs, and valuation methodologies, among other reasons.32Devising one universal reporting method for all diseases can be farfetched given the diverse nature of diseases.
One the other hand, proposals for the standardization of COI reporting methodologies for a specific disease, although still scarce, are starting to emerge. Jin and Mosweu,33 for instance, proposed a specific set of recommendations for schizophrenia COI reporting and valuation methods. This was done by conducting a systematic review in which they gathered and analyzed a suffi- cient number of schizophrenia COI results from multiple authors and countries tofinally come to a consensus for a standard COI reporting methodology for schizophrenia.
Although indirect cost as a proportion of total cost has been often employed in health economic evaluations,34,35this measure has proven to be inadequate to facilitate the international trans- ferability of results. For instance, Jin and Mosweu,33who extracted this ratio for schizophrenia from multiple COI studies, demon- strated how the results varied greatly across different countries, and even within the same country occasionally; schizophrenia’s indirect cost percentage of total costfluctuated from as low as 36%
(in Norway) as reported by Evensen et al36to up to 83% in South Korea as reported by Chang et al.37While our costs for schizo- phrenia resulted in 66% indirect cost proportion from total cost.
Similarly, Blahova et al38published a COI study for multiple scle- rosis costs in the Czech Republic with a resulting proportion of 45% indirect costs out of total costs compared with our reported 20%. Hence, it is apparent that the measure indirect cost/total cost concludes major international discrepancy and can render the transferability of the results unfeasible.
To address this issue, and building on the assumption that higher-income countries typically possess a higher capacity to spend on their health systems and vice versa, it can be beneficial
for indirect costs to be formulated taking into consideration a national GDP perspective. The measure of indirect cost proportion out of the national GDP/capita can potentially prove more bene- ficial for PL results transferability than indirect cost/total cost. To further simplify the indirect cost/(GDP/capita) utilization, a 3-level categorization system is proposed; high PL (above 50%), moderate PL (15%-50%), and low PL (below 15%). To give perspective, our findings demonstrated that schizophrenia and rheumatoid arthritis both fall within the high PL disease category. Systemic sclerosis, multiple sclerosis, Parkinson’s disease, and psoriatic arthritis all fall within the moderate PL category, whereas de- mentia, diabetes, epilepsy, psoriasis, and BPH patients fell into the low PL category. In a similar methodological approach, Zhao et al39 conducted a cross-country secondary analysis for the COI studies that reported indirect costs using the HCA for a few chronic dis- eases, one of which was schizophrenia. Their analysis comprised 9 schizophrenia COI studies, and the GDP-adjusted indirect costs were quantitatively synthesized so that the indirect costs are presented as a percentage of the national gross domestic product per capita “indirect cost/(GDP/capita).” Three different indirect cost/(GDP/capita) means (95% CI) were reported (ie, 66.5% (66.0- 67.0), 79.2% (54.0-104.3), and 79.2% (52.4-117.8), based on 3 modeling approaches (ie, fixed-effect model, random-effect model, and bootstrapping estimation), respectively. All 3 re- ported indirect cost/(GDP/capita) means are fairly close to our reported result for schizophrenia (72.4%), and all are falling into the high PL category. This demonstrates the usefulness of the national GDP association with indirect costs for international PL results transferability.
Some limitations of this study should be mentioned. First, disease severity and comorbidity data were not taken into consideration. Second, in our PL modeling for working patient populations (models 2 and 4), some moderate PL diseases (eg, dementia and Parkinson’s disease) could be underrepresented in these models given their late age disease nature. Third, most of the studies were conducted in tertiary clinical centers, and systematic selection bias owing to center effects could have been present.
Thus, the results may not be representative of the entire disease populations. Finally, study data were collected retrospectively using self-completed questionnaires and, with such data, there is always a risk of recall bias.
Conclusion
Results of our study provide useful monetary insights on PL impact and drivers in chronic disease patients in Hungary. This article will enable health decision makers to understand the importance of adopting a societal perspective for chronic disease reimbursement decisions. The significant correlation between PL and health status (ie, EQ-5D-3L index) supports that timely started effective treatments may prevent people from losing their work- ability. Schizophrenia and musculoskeletal disease patients had the highest PL, whereas BPH patients’PL was the lowest. We also demonstrated that indirect costs (GDP/capita) can enhance the international PL comparability and transferability.
Acknowledgments
The department of health economics at Corvinus University of Buda- pest kindly provided the raw data for this project. We also extend grateful acknowledgment to Márta Péntek, László Gulácsi, Fanni Rencz, Petra Baji, and Zsombor Zrubka, who helped with their comments to scale this work.
No direct funding was provided for the compilation and analysis of this work. Open access publishing license was possible thanks to the publish and read agreement between the hungarian electronic information service national consortium (EISZ) and Elsevier.
REFERENCES
1. Zhang W, Bansback N, Anis AH. Measuring and valuing productivity loss due to poor health: a critical review.Soc Sci Med. 2011;72(2):185–192.
2. Cheng J, Feldman SR. The cost of biologics for psoriasis is increasing.Drugs Context. 2014;17(3):212266.
3. Brennan P, Perola M, van Ommen G-J, Riboli E, Consortium EC. Chronic dis- ease research in Europe and the need for integrated population cohorts.Eur J Epidemiol. 2017;32(9):741–749.
4. Krol M, Brouwer W. How to estimate productivity costs in economic evalu- ations.Pharmacoeconomics. 2014;32(4):335–344.
5. Versteegh M, Knies S, Brouwer W. From good to better: new Dutch guidelines for economic evaluations in healthcare. Pharmacoeconomics.
2016;34(11):1071–1074.
6. Koopmanschap MA, Rutten FF, van Ineveld BM, Van Roijen L. The friction cost method for measuring indirect costs of disease. J Health Econ.
1995;14(2):171–189.
7. Knies S, Severens JL, Ament AJ, Evers SM. The transferability of valuing lost productivity across jurisdictions. Differences between national pharmacoe- conomic guidelines.Value Health. 2010;13(5):519–527.
8. Brodszky V, Bálint P, Géher P, et al. Disease burden of psoriatic arthritis compared to rheumatoid arthritis, Hungarian experiment.Rheumatol Int.
2009;30(2):199–205.
9. Rencz F, Kovács Á, Brodszky V, et al. Cost of illness of medically treated benign prostatic hyperplasia in Hungary.Int Urol Nephrol. 2015;47(8):1241–1249.
10. Érsek K, Kovács T, Wimo A, et al. Costs of dementia in Hungary.J Nutr Health Aging. 2010;14(8):633–639.
11. Jermendy G, Gaál Z, Ger}o L, et al. Egészségügyi szakmai irányelv—a diabetes mellitus kórismézésér}ol, a cukorbetegek antihyperglykaemiás kezelésér}ol és gondozásáról feln}ottkorban.Diabetol Hung. 2017;25:3–77.
12. Pentek M, Bereczki D, Gulacsi L, et al. Survey of adults living with epilepsy in Hungary: health-related quality of life and costs.Ideggyogy Sz. 2013;66(7- 8):251–261.
13. Pentek M, Gulacsi L, Rozsa C, et al. Health status and costs of ambulatory pa- tients with multiple sclerosis in Hungary.Ideggyogy Sz. 2012;65(9-10):316–324.
14. Tamás G, Gulácsi L, Bereczki D, et al. Quality of life and costs in Parkinson’s disease: a cross sectional study in Hungary.PLoS One. 2014;9(9), e107704.
15. Balogh O, Brodszky V, Gulácsi L, et al. Cost-of-illness in patients with mod- erate to severe psoriasis: a cross-sectional survey in Hungarian dermato- logical centres.Eur J Health Econ. 2014;15(1):101–109.
16. Péntek M, Kobelt G, Czirják L, et al. Costs of rheumatoid arthritis in Hungary.
J Rheumatol. 2007;34(6), 1437-1437.
17. Péntek M, Harangozó J, Egerházi A, et al. Health related quality of life and disease burden of patients with schizophrenia in Hungary.Psychiatr Hung.
2012;27(1):4–17.
18. Minier T, Péntek M, Brodszky V, et al. Cost-of-illness of patients with sys- temic sclerosis in a tertiary care centre. Rheumatology (Oxford).
2010;49(10):1920–1928.
19. Devlin NJ, Brooks R. EQ-5D and the EuroQol group: past, present and future.
Appl Health Econ Health Policy. 2017;15(2):127–137.
20. Mukuria C, Rowen D, Hernández-Alava M, Dixon S, Ara R. Predicting pro- ductivity losses from health-related quality of life using patient data.Appl Health Econ Health Policy. 2017;15(5):597–614.
21. Reilly MC, Zbrozek AS, Dukes EM. The validity and reproducibility of a work productivity and activity impairment instrument. Pharmacoeconomics.
1993;4(5):353–365.
22. Pike J, Grosse SD. Friction cost estimates of productivity costs in cost-of- illness studies in comparison with human capital estimates: a review.Appl Health Econ Health Policy. 2018;16(6):765–778.
23. Hungarian Central Statistical Office. Average gross earnings.https://www.
ksh.hu/docs/eng/xftp/gyor/ker/eker1812.html. Accessed October 21, 2019.
24. Hungarian Central Statistical Office. Per capita gross domestic product.
https://www.ksh.hu/docs/eng/xstadat/xstadat_annual/i_qpt016.html.
Accessed October 21, 2019.
25. Simonovits A. The mandatory private pension pillar in Hungary: an obituary.
Int Soc Secur Rev. 2011;64(3):81–98.
26. Bloom D, Cafiero E, Jané-Llopis E, Abrahams-Gessel S, Bloom L, Fathima S.The global economic burden of non-communicable diseases report. The World Economic Forum and the Harvard School of Public Health; 2011.
27. Third Copenhagen Consensus Outcome Document. Copenhagen Consensus Center; 2012.
28. Gulácsi L, Brodszky V, Péntek M, Varga S, Vas G, Boncz I. History of health technology assessment in Hungary. Int J Technol Assess Health Care.
2009;25(S1):120–126.
29. Nolte E, Knai C, Saltman R.Assessing Chronic Disease Management in European health Systems: Concepts and Approaches. World Health Organization; 2015.
30. Szende Á, Mogyorosy Z, Muszbek N, Nagy J, Pallos G, Dózsa C. Methodological guidelines for conducting economic evaluation of healthcare interventions in Hungary: a Hungarian proposal for methodology standards.Eur J Health Econ.
2002;3(3):196–206.
31. Zimmerman EB, Woolf SH, Haley A.Understanding the Relationship Between Education and Health: A Review of the Evidence and an Examination of Com- munity Perspectives. Rockville, MD: Agency for Healthcare Research and Quality; 2015.
32. Onukwugha E, McRae J, Kravetz A, Varga S, Khairnar R, Mullins CD. Cost-of- illness studies: an updated review of current methods.Pharmacoeconomics.
2016;34(1):43–58.
33. Jin H, Mosweu I. The societal cost of schizophrenia: a systematic review.
Pharmacoeconomics. 2017;35(1):25–42.
34. Thienpont E, Paternostre F, Van Wymeersch C. The indirect cost of patient- specific instruments.Acta Orthop Belg. 2015;81(3):462–470.
35. Le KD, Vuong LN, Ho TM, et al. A cost-effectiveness analysis of freeze-only or fresh embryo transfer in IVF of non-PCOS women. Hum Reprod.
2018;33(10):1907–1914.
36. Evensen S, Wisløff T, Lystad JU, Bull H, Ueland T, Falkum E. Prevalence, employment rate, and cost of schizophrenia in a high-income welfare soci- ety: a population-based study using comprehensive health and welfare registers.Schizophr Bull. 2015;42(2):476–483.
37. Chang SM, Cho S-J, Jeon HJ, et al. Economic burden of schizophrenia in South Korea.J Korean Med Sci. 2008;23(2):167–175.
38. Blahova Dusankova J, Kalincik T, Dolezal T, Kobelt G, Havrdova E. Cost of multiple sclerosis in the Czech Republic: the COMS study. Mult Scler.
2012;18(5):662–668.
39. Zhao F-L, Xie F, Hu H, Li S-C. Transferability of indirect cost of chronic dis- ease: a systematic review and meta-analysis. Pharmacoeconomics.
2013;31(6):501–508.