https://doi.org/10.1007/s10198-019-01061-2 ORIGINAL PAPER
Validity and reliability of the 9‑item Shared Decision Making Questionnaire (SDM‑Q‑9) in a national survey in Hungary
Fanni Rencz1,2 · Béla Tamási3 · Valentin Brodszky1 · László Gulácsi1 · Miklós Weszl1 · Márta Péntek1
Received: 25 March 2019 / Accepted: 14 April 2019 / Published online: 20 May 2019
© The Author(s) 2019
Abstract
Background The nine-item Shared Decision Making Questionnaire (SDM-Q-9) is one of the most frequently applied instru- ments for assessing patients’ involvement in medical decision-making. Our objectives were to develop a Hungarian version of SDM-Q-9, to evaluate its psychometric properties and to compare its performance between primary and specialised care settings.
Methods In 2019, a sample of adults (n = 537) representative of the Hungarian general population in terms of age, gender and geographic region completed an online survey with respect to a recent health-related decision. Outcome measures included SDM-Q-9 and Control Preferences Scale-post (CPSpost). Item characteristics, internal consistency reliability and the factor structure of SDM-Q-9 were determined.
Results The overall ceiling and floor effects for SDM-Q-9 total scores were 12.3% and 2.2%, respectively. An excellent internal consistency reliability (Cronbach’s alpha 0.925) was demonstrated. Exploratory factor analysis resulted in a one- factor model explaining 63.5% of the variance of SDM-Q-9. A confirmatory factor analysis supported the acceptability of this model. Known-groups validity was confirmed with CPSpost categories; mean SDM-Q-9 total scores were higher in the ‘Shared decision’ category (72.6) compared to both ‘Physician decided’ (55.1, p = 0.0002) and ‘Patient decided’ (57.2, p = 0.0086) categories. In most aspects of validity and reliability, there was no statistically significant difference between primary and specialised care.
Conclusions The overall good measurement properties of the Hungarian SDM-Q-9 make the questionnaire suitable for use in both primary and specialised care settings. SDM-Q-9 may be useful for health policies targeting the implementation of shared decision-making and aiming to improve efficiency and quality of care in Hungary.
Keywords Shared decision-making · SDM-Q-9 · Primary care · Specialised care · Psychometrics JEL Classification I10
Introduction
In many countries, increasing patient engagement in health- care is advocated by health policy [1]. Shared decision-mak- ing (SDM) is defined as a process by which health-related
decisions are made jointly by the physician and the patient.
Steps of SDM include an open communication about a deci- sion that needs to be made, informing the patient about the choices available, eliciting patients’ preferences regarding the decision, providing help for the patient to weigh the risks versus benefits and ultimately supporting the patient to play an active role in making the decision [2]. SDM has the poten- tial to provide numerous benefits including increased patient knowledge, improved health outcomes, reductions in costs and greater alignment of care with patients’ values [3–7].
Patient participation in medical decision-making is increas- ingly recognised as a tool to reduce health inequalities and a quality indicator of healthcare systems [8, 9]. While in many European countries SDM has become a health policy priority
* Fanni Rencz
fanni.rencz@uni-corvinus.hu
1 Department of Health Economics, Corvinus University of Budapest, Fővám tér 8, Budapest 1093, Hungary
2 Premium Postdoctoral Research Programme, Hungarian Academy of Sciences, Nádor u. 7, Budapest 1051, Hungary
3 Department of Dermatology, Venereology
and Dermatooncology, Faculty of Medicine, Semmelweis University, Mária u. 41, Budapest 1085, Hungary
in the past two decades, the literature about the involvement of patients in medical decisions in Hungary is scarce [10–12].
A recent systematic literature review identified 16 exist- ing patient questionnaires pertaining to SDM [13]. The nine- item Shared Decision Making Questionnaire is one of the most frequently applied instruments for assessing the extent to which clinicians involve patients in decision-making. It consists of a patient (SDM-Q-9) and a physician (SDM- Q-Doc) version that allow to assess the patients’ involve- ment in decision-making from two perspectives [14, 15]. It has been widely used in various clinical settings including primary and specialised care along with clinical trials and national surveys [16, 17]. Studies have shown that SDM- Q-9 is a useful measure in a number areas of medicine, such as anaesthesiology [18], cardiovascular diseases [19, 20], dermatology [21], mental illnesses [22–24], oncology [25–27], otolaryngology [28], and traumatology [29]. Since its development in 2009 it has been translated to over 20 lan- guages. It demonstrated a good internal consistency and con- struct validity in numerous studies [14, 24, 30–34]. Recent research, however, indicates that still there is a clear need for quality improvement in validation studies, for example, in terms of sample sizes, methodological quality, finding ways to quantify known-groups validity and to compare its measurement properties across different levels of healthcare system [13, 30].
To date, no Hungarian version of SDM-Q-9 has been available. Therefore, the primary objective of the present study was to develop a Hungarian version of SDM-Q-9 and to evaluate its psychometric properties as a part of a large national survey on SDM practices in Hungary. A set of measurement properties of the instrument is analysed including internal consistency reliability, factor structure and known-groups validity. Our secondary aim was to compare the performance of SDM-Q-9 in primary and specialised care.
Methods
Study design and participants
In early 2019, an internet-based questionnaire was admin- istered to a national sample of adults in Hungary. Recruit- ment for the study was conducted through a specialised survey company (Big Data Scientist Ltd.). Volunteers enlisted with this company were invited to participate in the study. The study invitation was sent via the company to the selected volunteers. Participation was anonymous and no compensation of any kind was provided to the respond- ents. The study received approval from the National Scien- tific and Ethical Committee (reference no. 47654-2/2018/
EKU) prior to data collection. Inclusion criteria to the
study were (i) aged ≥ 18 years and (ii) signed an informed consent form.
A stratified random sampling was applied to recruit 1000 respondents stratified on age, gender, education level, place of residence and geographic region that reflects the compo- sition of the Hungarian general population according to the Hungarian Central Statistical Office (KSH) [35]. Given the lower use of internet among individuals aged ≥ 65 [36], the sampling aimed to reflect the distribution of each stratum between the age of 18 and 65, but not in the over-65 age groups. Data of participants reported having a consultation with a physician within the past 6 months for a health-related decision on any levels of healthcare (primary or specialised care) were considered. The recall period was set at the pre- ceding 6 months, because it was considered short enough to remember a consultation with a physician, but long enough not to exclude a large number of respondents. This is consist- ent with large national surveys on SDM in other countries that used various time frames ranging from 3 to 12 months [17, 37–39].
The questionnaire
The questionnaire was a part of a longer survey covering many topics asked in three separate modules (e.g. electronic health literacy, SDM and patient-reported experience meas- ures). In the SDM module of the questionnaire, participants were first asked whether they had a health-related decision in a consultation with a physician within the past 6 months.
Respondents were also questioned about the level of care (i.e. primary or specialised) with reference to the decision made. Then, they completed a Control Preferences Scale- post (CPSpost) and SDM-Q-9. Demographics and partici- pants’ general health status were also recorded. The Mini- mum European Health Module was administered to assess self-perceived health, chronic morbidity and activity limita- tions [40, 41]. All questions of the survey were set at manda- tory, so respondents could not proceed to the next question without answering the previous one.
Measures SDM‑Q‑9
The SDM-Q-9 is self-reported questionnaire designed to assess patients’ views on SDM occurred in a consultation with a healthcare provider [14]. It contains two open-ended questions [‘Please indicate which health complaint/prob- lem/illness the consultation was about’ and ‘Please indicate which decision was made’] followed by nine closed ques- tions. Each closed question is represented by a statement featuring various aspects of SDM, rated on a 6-point bal- anced scale ranging from 0 (= ‘completely disagree’) to 5
(= ‘completely agree’). The total score, calculated by sum- ming the score of the nine items, is expressed on a scale ranging between 0 and 45, where a higher score represents a greater level of perceived SDM. Following earlier stud- ies, we rescaled the raw total scores to a 0–100 range [14, 30]. Completion time of SDM-Q-9 was recorded for all participants.
Translation of the questionnaire
The permission to translate and use SDM-Q-9 was obtained from the developer core team of the questionnaire (Uni- versity Medical Center Hamburg-Eppendorf, Germany).
The translation and cross-cultural adaptation process fol- lowed the guidelines of Beaton et al. [42]. Two Hungarian researchers independently translated the original German version of SDM-Q-9 into Hungarian. The two translations have been harmonised through discussion until the first con- sensus version was agreed upon. The consensus version has been back-translated to German by a third independent trans- lator blind to the original version. The back translation was sent to the developers of the questionnaire who commented on that. This led to certain changes in the first consensus version to reach the second consensus version, approved by the developer team. Similarly to the English translation of SDM-Q-9, we preferred to use a passive voice for the sec- ond open-ended question ‘What decision was made?’ (Hun- garian: ‘Milyen döntést hoztak?’). Moreover, we decided to use ‘told’ (Hungarian: ‘elmondta’) as the translation of the German verb ‘mitgeteilt’ (English: ‘informed’ or ‘com- municated’) often has a negative connotation in Hungarian (‘közölte’). A cognitive debriefing interview of the second consensus version was carried out with five individuals.
Based on these interviews, no modification was required to the second consensus version, which resulted in the final Hungarian version of SDM-Q-9. The SDM-Q-Doc has also been translated as a part of the translation process; how- ever, it was not used in the present study. The SDM-Q-9 and SDM-Q-Doc are complement to one another but can be validated separately [15, 43].
Content coding of decisions
Responses on the two open-ended questions of SDM-Q-9 were analysed using a content analysis framework [44].
Analyst triangulation was used to ensure credibility of the results [45]. The categories were proposed by the lead researcher (F.R.), following a discussion with the team members and bearing in mind comparability with previous large national surveys on shared decision-making in other countries [17, 37, 46]. Responses were coded according to categories by two researchers independently (F.R. and B.T.).
Disagreements were resolved through discussion with a third
researcher (M.P.) If a respondent indicated several reasons for the consultation, only those that were associated with a clear decision were included. Respondents indicating an unspecified illness/symptom/problem for the reason of con- sultation but providing a clear specification of the type of decision made were included in the analysis (e.g. reason for visit: ‘bleeding’, type of decision: ‘surgery’).
CPSpost
The questionnaire involved a modified version of Control Preferences Scale (CPS) [47], the CPSpost [48] to assess known-groups validity of SDM-Q-9. The CPSpost is a single- item measure to evaluate patients’ perceived participation in health-related decisions. Evidence suggests that the CPSpost is a valid and reliable measure of patient involvement in medical decisions [30, 48, 49]. It has five response options describing the role of the patient in the physician–patient- interaction: 1 (= ‘I made my decision alone’), 2 (= ‘I made my decision alone considering what my doctor said’), 3 (= ‘I shared the decision with my doctor’), 4 (= ‘My doctor decided considering my preferences’), and 5 (= ‘My doctor made the decision’).
Statistical analyses
The following exclusion criteria were specified a priori based on the two open-ended questions of SDM-Q-9:
1. The decision was made during a visit at the dentist, psy- chologist, nutritionist, physiotherapist or veterinarian.
2. The respondent provided nonsensical responses to any of the open-ended questions.
Descriptive characteristics of the sample were computed.
Item analysis of SDM-Q-9 questionnaire involved the esti- mation of the distribution of responses to each item, item difficulties, discrimination and internal consistency. Ceiling and floor effects, expressed as the proportion of ‘completely agree’ and ‘completely disagree’ responses per item, were considered to be present if ≥ 15% of respondents achieved the highest or lowest possible score, respectively [50].
The difference in the presence of ceiling and floor effects between the primary and specialised care sample was tested using Fisher’s exact test. Item difficulties were determined by calculating the mean total score of each item. In line with former validation studies, a mean score below the midpoint (2.5 on a scale ranging between 0 and 5) was interpreted as a generally difficult aspect of SDM in a consultation [30]. Per- ceived difficulty and SDM-Q-9 total scores between primary and specialised care were compared using Student’s t test.
Discrimination (i.e. how efficient the items individually contribute to the scale) was assessed by computing corrected
item-total correlations and the value of Cronbach’s alpha (α) if the item was deleted. Internal consistency reliability of the SDM-Q-9 scale as a whole was assessed using Cron- bach’s α [51]. Internal consistency was considered good if 0.8 ≤ α < 0.9 and excellent if α > 0.9 [52]. The Cronbach’s α values of primary and specialised care subsamples were compared using Feldt’s test [53].
Construct validity of SDM-Q-9 was examined by explora- tory factor analysis (EFA) and confirmatory factor analy- sis (CFA). Regarding EFA, the eigenvalue > 1 rule and the scree plot were used to determine the number of factors.
The appropriateness of the factor model was assessed by the Kaiser–Meyer–Olkin (KMO) measure of sampling adequacy [54] and the significance of the Bartlett’s test of sphericity. The recommended value for the KMO was ≥ 0.5 [55]. The quality of items was judged based on estimating factor loadings, inter-item correlations and communalities (h2). Factor loadings were interpreted as acceptable if ≥ 0.3, practically significant if ≥ 0.5 and indicative of a well- defined structure if ≥ 0.7. The desired value for inter-item
correlation coefficients was being lower than 0.85 [56]. A h2 was deemed acceptable if > 0.5 [55].
In the second stage of factor analyses, a CFA was con- ducted. Following the Dutch and Spanish validation studies, four single-factor model specifications were tested: all nine items (Model 1); excluding item 1 (Model 2), excluding item 9 (Model 3) and excluding items 1 and 9 (Model 4) [30, 31].
Due to the non-normal distribution of data, we used both maximum likelihood and robust estimators (Satorra-Bentler) [57]. Multiple criteria were employed to assess goodness- of-fit of the models: Chi-square statistic (χ2), comparative fit index (CFI), root mean square error of approximation (RMSEA) and standardized root mean square residual (SRMR). The desired threshold values were > 0.90 for CFI and ≤ 0.8 for both RMSEA and SRMR [58].
Known-groups validity of the SDM-Q-9 with CPSpost was evaluated by comparing the differences in SDM-Q-9 total scores across the five categories of CPSpost. Analysis of variance (ANOVA) and Games–Howell post hoc test were employed. We hypostatised the highest mean SDM-Q-9 scores on the CPSpost for the ‘Shared decision’ category.
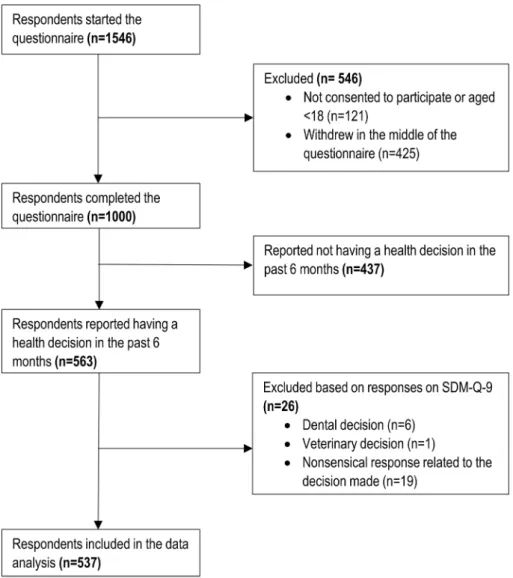
Fig. 1 Study flow chart. SDM- Q-9 9-item Shared Decision Making Questionnaire
A p value of < 0.05 was considered statistically significant for all analyses. CFA was carried out using Stata 14 (College Station, TX: StataCorp LP.), the Feldt’s test was carried out
in R using ‘cocron’ command [59] and all other statistical analyses were performed using SPSS 25.0 (Armonk, NY:
IBM Corp.)
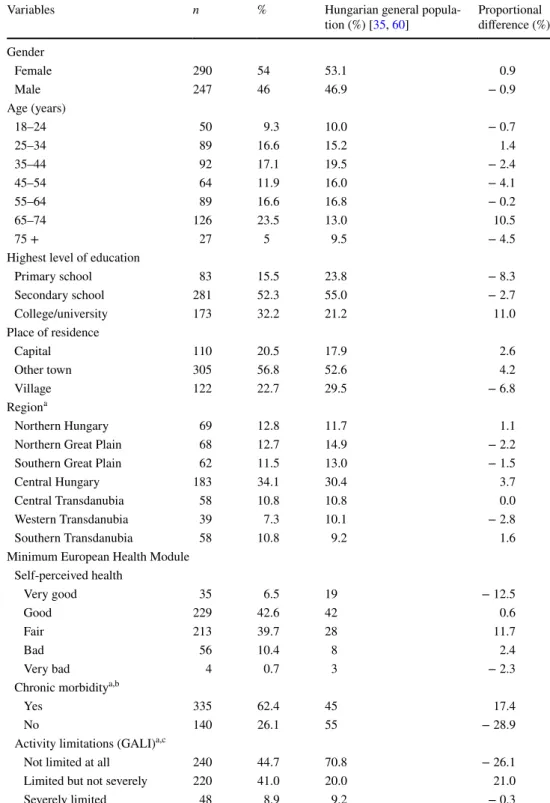
Table 1 Characteristics of the study population (n = 537)
GALI global activity limitation indicator
a General population percentages are reported for the 15 + population
bn = 62 (11.5%) did not know or refused to answer
cn = 29 (5.4%) did not know or refused to answer
Variables n % Hungarian general popula-
tion (%) [35, 60] Proportional difference (%) Gender
Female 290 54 53.1 0.9
Male 247 46 46.9 − 0.9
Age (years)
18–24 50 9.3 10.0 − 0.7
25–34 89 16.6 15.2 1.4
35–44 92 17.1 19.5 − 2.4
45–54 64 11.9 16.0 − 4.1
55–64 89 16.6 16.8 − 0.2
65–74 126 23.5 13.0 10.5
75 + 27 5 9.5 − 4.5
Highest level of education
Primary school 83 15.5 23.8 − 8.3
Secondary school 281 52.3 55.0 − 2.7
College/university 173 32.2 21.2 11.0
Place of residence
Capital 110 20.5 17.9 2.6
Other town 305 56.8 52.6 4.2
Village 122 22.7 29.5 − 6.8
Regiona
Northern Hungary 69 12.8 11.7 1.1
Northern Great Plain 68 12.7 14.9 − 2.2
Southern Great Plain 62 11.5 13.0 − 1.5
Central Hungary 183 34.1 30.4 3.7
Central Transdanubia 58 10.8 10.8 0.0
Western Transdanubia 39 7.3 10.1 − 2.8
Southern Transdanubia 58 10.8 9.2 1.6
Minimum European Health Module Self-perceived health
Very good 35 6.5 19 − 12.5
Good 229 42.6 42 0.6
Fair 213 39.7 28 11.7
Bad 56 10.4 8 2.4
Very bad 4 0.7 3 − 2.3
Chronic morbiditya,b
Yes 335 62.4 45 17.4
No 140 26.1 55 − 28.9
Activity limitations (GALI)a,c
Not limited at all 240 44.7 70.8 − 26.1
Limited but not severely 220 41.0 20.0 21.0
Severely limited 48 8.9 9.2 − 0.3
Results
Sample characteristics
Out of the 1546 respondents who started the online question- naire (consisting on three modules, as described above), a total of 546 were excluded. Out of these, 121 participants declined to consent to the study or aged <18 years, and fur- ther 425 decided to withdraw in the middle of the survey.
The valid sample consisted of 1000 respondents, 563 of whom reported having a health-related decision in the past 6 months. A total of 26 respondents were excluded according to the exclusion criteria related to the quality of responses on SDM-Q-9 (Fig. 1). The most common reason for exclu- sion was providing a nonsensical response to the open-ended questions (e.g. ‘I don’t know’ or ‘this is a private matter’).
Thus, data of 537 respondents were analysed in the present study.
Sociodemographic characteristics and general health sta- tus of the participants are presented in Table 1. Mean age was 49.4 (SD 18.0, range 18–90) years. The sample well rep- resented the Hungarian general population for gender, age (except for the over-65 age groups), place of living and geo- graphical region. Higher educated respondents were some- what overrepresented, and respondents with lower educa- tional background were underrepresented in the sample. The presence of chronic morbidities and activity limitations were more prevalent among respondents compared with the gen- eral population. Of the 537 participants included, responses of 211 (39.3%) and 320 (59.6%) referred to a decision made in primary and specialised care settings, respectively, while 6 (0.9%) respondents indicated other level of care.
Content coding of the two open‑ended questions of SDM‑Q‑9
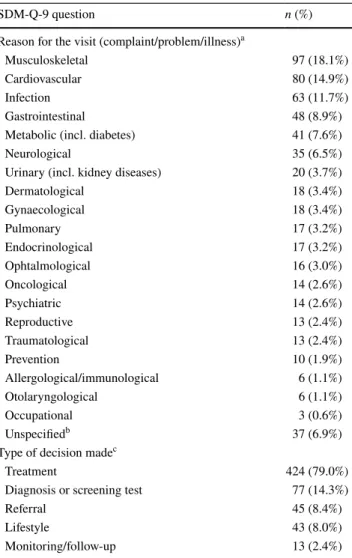
Completion rate was 100% for all items of SDM-Q-9, as all questions were mandatory in the online survey. Median (Q1–Q3) completion time of SDM-Q-9 including the two open-ended questions was 2.17 (1.45–3.10) min. Coding of the two open-ended questions of SDM-Q-9 is demonstrated in Table 2. Overall, 20 groups of medical specialties and an ‘unspecified’ category were developed to classify the text responses with regard to the reason for consultation. A total of 586 problems were reported by the respondents. The most frequent reasons for consultation were musculoskeletal problems (n = 97; 18.1%), followed by cardiovascular prob- lems (n = 80; 14.9%) and infection (n = 63; 11.7%). With regard to the type of decision, a total of 602 decisions were reported by the respondents, the most common of which
were treatment (n = 424; 79.0%), diagnosis or screening test (n = 77; 14.3%) and referral (n = 45; 8.4%).
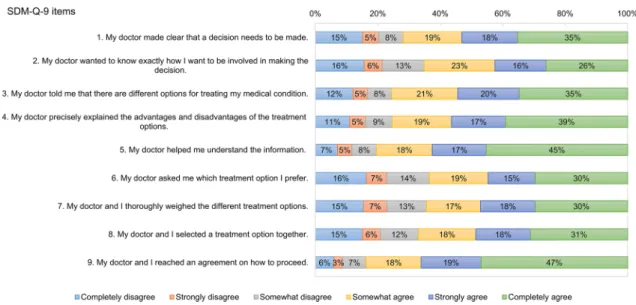
Descriptive statistics of the nine items of SDM‑Q‑9 In the total sample, mean (SD) SDM-Q-9 total score was 66.1 (26.7). No ceiling (12.3%) or floor effects (2.2%) were detected for total scores. Participants having a specialised care consultation indicated higher SDM-Q-9 total scores (mean 67.9 vs. 63.4, p = 0.0564). Figure 2 reports the fre- quency distribution of each item of SDM-Q-9. Overall, 117 (21.8%) respondents were ‘straight-liners’ selecting the same
Table 2 Content coding for the two open-ended questions of SDM- Q-9
a A total of 586 problems were reported by 537 respondents. Alto- gether 492 (91.6%), 41 (7.6%) and 4 (0.7%) respondents reported 1, 2 and 3 separate health problems, respectively
b Responses that cannot be clearly classified into the existing groups (e.g. ‘bleeding’)
c A total of 602 decisions were reported by 537 respondents. There were 465 (86.6%) respondents with 1 decision and 72 (13.4%) indi- cating 2 types of decision made
SDM-Q-9 question n (%)
Reason for the visit (complaint/problem/illness)a
Musculoskeletal 97 (18.1%)
Cardiovascular 80 (14.9%)
Infection 63 (11.7%)
Gastrointestinal 48 (8.9%)
Metabolic (incl. diabetes) 41 (7.6%)
Neurological 35 (6.5%)
Urinary (incl. kidney diseases) 20 (3.7%)
Dermatological 18 (3.4%)
Gynaecological 18 (3.4%)
Pulmonary 17 (3.2%)
Endocrinological 17 (3.2%)
Ophtalmological 16 (3.0%)
Oncological 14 (2.6%)
Psychiatric 14 (2.6%)
Reproductive 13 (2.4%)
Traumatological 13 (2.4%)
Prevention 10 (1.9%)
Allergological/immunological 6 (1.1%)
Otolaryngological 6 (1.1%)
Occupational 3 (0.6%)
Unspecifiedb 37 (6.9%)
Type of decision madec
Treatment 424 (79.0%)
Diagnosis or screening test 77 (14.3%)
Referral 45 (8.4%)
Lifestyle 43 (8.0%)
Monitoring/follow-up 13 (2.4%)
response option for each item. The majority of straight-lin- ers marked positive responses: ‘completely agree’ (35.2%),
‘somewhat agree’ (18.8%) and ‘strongly agree’ (17.9%).
Item 9 displayed the highest ceiling effect and the lowest floor effect (46.9% and 6.0%), followed by item 5 (45.3% and 7.1%) and item 4 (39.1% and 11.0%). A higher overall ceiling effect (p = 0.0942) parallel to a lower floor effect (p = 0.0303) was observed for the specialised care subsample (Table 3).
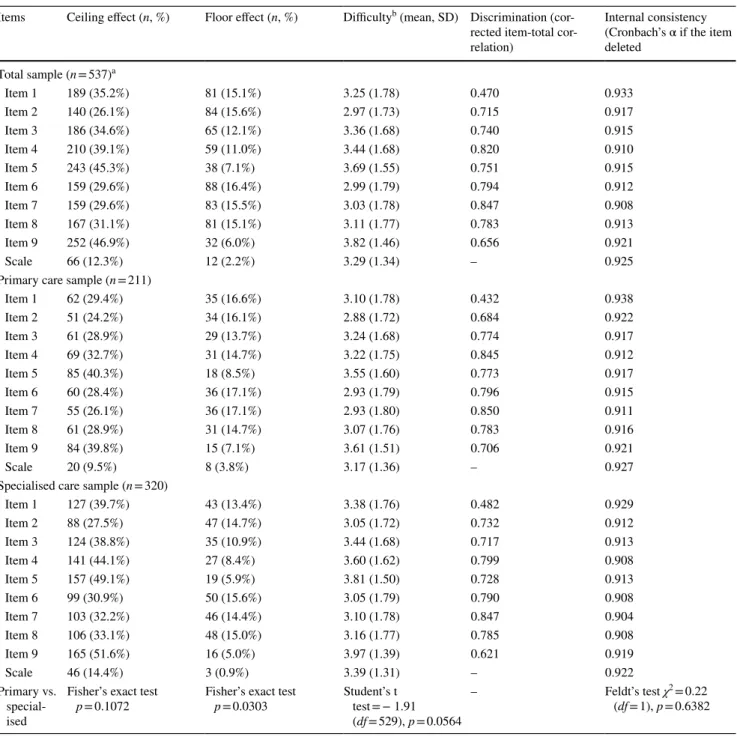
Item difficulty, discrimination and internal consistency
Item characteristics including difficulty, discrimina- tion and internal consistency reliability are presented in Table 3. All item difficulty values were above the mid- point of 2.5 with the highest means observed for item 8 and item 5, while the lowest for items 2 and 6. Compared to primary care, specialised care consultations were eval- uated as being less difficult (mean item difficulty 3.39 vs.
3.17, p = 0.0564). In the total sample, corrected item-total correlations did not meet the threshold of > 0.70 for items 1 and 9. The overall internal consistency reliability was excellent (Cronbach’s α = 0.925). With respect to Cron- bach’s α, there was no statistically significant difference between primary and specialised care (0.927 vs. 0.922;
p = 0.6382).
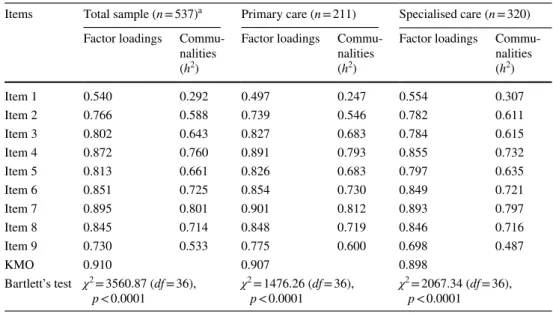
Construct validity
Exploratory factor analysis (EFA)
EFA resulted in one main factor with an eigenvalue > 1 for all three samples studied. The scree plot also indicated that one factor was responsible for the majority (63.49%) of the variance in SDM-Q-9. The explained variances were very similar for primary and specialised care (64.61% vs.
62.45%). The KMO measure verified an excellent sam- pling adequacy (0.910 for the total sample, 0.907 for pri- mary care and 0.898 for specialised care). The Bartlett’s test for sphericity confirmed the statistical relevance of the models (p < 0.0001).
Table 4 shows the factor loadings and communalities for all items. For the total sample, individual loadings were high (i.e. ≥ 0.7) for all but one items. Item 1 pro- duced a mediocre item loading of 0.540. In line with this, communalities of item 1 fell behind the required value of > 0.5. A very similar pattern was identified for primary care, whereas for specialised care com- munalities of items 1 and 9 were below the threshold.
Regarding inter-item correlations, all values were below the recommended upper limit of 0.85 (total sample 0.311–0.826, primary care 0.259–0.839 and specialised care 0.333–0.821) indicating that there was no overlap between items.
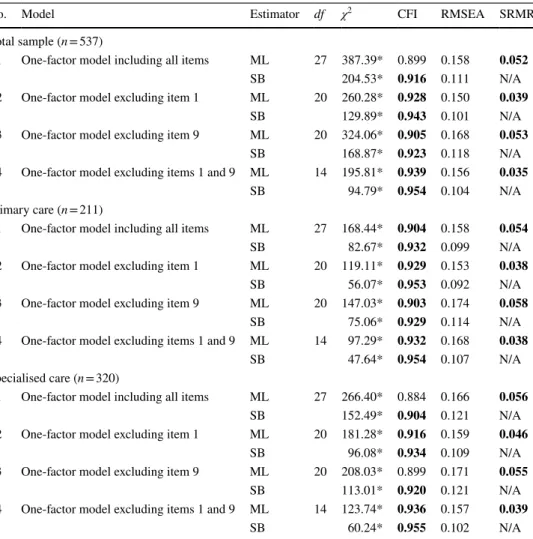
Confirmatory factor analysis
Table 5 presents the results of the CFA. The overall perfor- mance of the four models was very similar. Almost every
Fig. 2 Distribution of responses on the nine items of SDM-Q-9. SDM-Q-9 9-item Shared Decision Making Questionnaire
model met the cut-off criteria of χ2, CFI and SRMR, but none achieved an acceptable RMSEA value. Model 1 (all nine items included) demonstrated a more or less accept- able performance with CFI = 0.899, RMSEA = 0.158 and SRMR = 0.052. For the total sample as well as the two subsamples, the best performing model in terms of fit indices was model 4 whereby both items 1 and 9 were excluded.
Known‑groups validity
Figure 3 shows the mean SDM-Q-9 total scores according to the five CPSpost categories. As expected, the ANOVA found significant differences in SDM-Q-9 total scores across CPSpost categories (total sample and primary care p < 0.0001, specialised care p = 0.0021). In the total sam- ple, ‘Shared decision’ was associated with significantly higher mean SDM-Q-9 total score (72.6) compared to both
Table 3 Item characteristics of SDM-Q-9
a Data about the level of care were indicated as ‘other’ for n = 6 respondents
b Difficulty is measured on a 0–5 scale
Items Ceiling effect (n, %) Floor effect (n, %) Difficultyb (mean, SD) Discrimination (cor- rected item-total cor- relation)
Internal consistency (Cronbach’s α if the item deleted
Total sample (n = 537)a
Item 1 189 (35.2%) 81 (15.1%) 3.25 (1.78) 0.470 0.933
Item 2 140 (26.1%) 84 (15.6%) 2.97 (1.73) 0.715 0.917
Item 3 186 (34.6%) 65 (12.1%) 3.36 (1.68) 0.740 0.915
Item 4 210 (39.1%) 59 (11.0%) 3.44 (1.68) 0.820 0.910
Item 5 243 (45.3%) 38 (7.1%) 3.69 (1.55) 0.751 0.915
Item 6 159 (29.6%) 88 (16.4%) 2.99 (1.79) 0.794 0.912
Item 7 159 (29.6%) 83 (15.5%) 3.03 (1.78) 0.847 0.908
Item 8 167 (31.1%) 81 (15.1%) 3.11 (1.77) 0.783 0.913
Item 9 252 (46.9%) 32 (6.0%) 3.82 (1.46) 0.656 0.921
Scale 66 (12.3%) 12 (2.2%) 3.29 (1.34) – 0.925
Primary care sample (n = 211)
Item 1 62 (29.4%) 35 (16.6%) 3.10 (1.78) 0.432 0.938
Item 2 51 (24.2%) 34 (16.1%) 2.88 (1.72) 0.684 0.922
Item 3 61 (28.9%) 29 (13.7%) 3.24 (1.68) 0.774 0.917
Item 4 69 (32.7%) 31 (14.7%) 3.22 (1.75) 0.845 0.912
Item 5 85 (40.3%) 18 (8.5%) 3.55 (1.60) 0.773 0.917
Item 6 60 (28.4%) 36 (17.1%) 2.93 (1.79) 0.796 0.915
Item 7 55 (26.1%) 36 (17.1%) 2.93 (1.80) 0.850 0.911
Item 8 61 (28.9%) 31 (14.7%) 3.07 (1.76) 0.783 0.916
Item 9 84 (39.8%) 15 (7.1%) 3.61 (1.51) 0.706 0.921
Scale 20 (9.5%) 8 (3.8%) 3.17 (1.36) – 0.927
Specialised care sample (n = 320)
Item 1 127 (39.7%) 43 (13.4%) 3.38 (1.76) 0.482 0.929
Item 2 88 (27.5%) 47 (14.7%) 3.05 (1.72) 0.732 0.912
Item 3 124 (38.8%) 35 (10.9%) 3.44 (1.68) 0.717 0.913
Item 4 141 (44.1%) 27 (8.4%) 3.60 (1.62) 0.799 0.908
Item 5 157 (49.1%) 19 (5.9%) 3.81 (1.50) 0.728 0.913
Item 6 99 (30.9%) 50 (15.6%) 3.05 (1.79) 0.790 0.908
Item 7 103 (32.2%) 46 (14.4%) 3.10 (1.78) 0.847 0.904
Item 8 106 (33.1%) 48 (15.0%) 3.16 (1.77) 0.785 0.908
Item 9 165 (51.6%) 16 (5.0%) 3.97 (1.39) 0.621 0.919
Scale 46 (14.4%) 3 (0.9%) 3.39 (1.31) – 0.922
Primary vs.
special- ised
Fisher’s exact test
p = 0.1072 Fisher’s exact test
p = 0.0303 Student’s t test = − 1.91 (df = 529), p = 0.0564
– Feldt’s test χ2 = 0.22
(df = 1), p = 0.6382
‘Physician decided’ (55.1), ‘Physician decided considering patient’s preferences’ (67.0) and ‘Patient decided’ (57.2) cat- egories (p < 0.05). The difference between the ‘Shared deci- sion’ and ‘Patient decided considering physician’s opinion’
(64.2, p = 0.0840) categories also showed a trend towards statistical significance.
In the primary care sample, mean SDM-Q-9 total scores of ‘Physician decided’ category (43.1) were significantly lower compared to both the ‘Shared decision’ (72.4) and
‘Patient decided considering physician’s opinion’ (70.5). In the specialised care subsample, mean SDM-Q-9 total score of the ‘Shared decision’ category (73.5) was significantly higher than that of ‘Patient decided considering physician’s opinion’ (59.9).
Discussion
In this study a Hungarian version of the SDM-Q-9 ques- tionnaire was developed and psychometrically tested. The overall data quality was reasonably acceptable; however, over one-fifth of the population provided response patterns.
No ceiling or floor effects were observed for SDM-Q-9 total scores. In accordance with former validation studies, an appropriate difficulty was observed for all items. The results regarding internal consistency reliability (Cronbach’s α = 0.925) are comparable to the first psychometric testing of the original German questionnaire (0.938) and that of the Danish (0.94), Dutch (0.88), Romanian (0.95) and Spanish (0.885) versions [14, 30, 31, 33, 34].
Results of the factor analyses supported the single-factor construct of the original German SDM-Q-9 [14]. The one- structure model explained 63.5% of the variance of SDM- Q-9 in Hungary versus 62.4% in Germany. In contrast the Dutch, Romanian and Spanish versions revealed a two- component structure of the instrument [30, 31, 33]. In our one-factor model, supporting the results of the discrimina- tion and item-level reliability, items 1 (‘My doctor made clear that a decision needs to be made’) and 9 (‘My doctor and I reached an agreement on how to proceed’) contrib- uted the least to the variance. Thus, we decided to test the effect of eliminating these items in a CFA. It was found that by removing these items, all fit indices slightly improved.
Nonetheless, to be consistent with all other language ver- sions of SDM-Q-9, it was decided to keep all nine items in the Hungarian version.
The SDM-Q-9 demonstrated an excellent known-groups validity in distinguishing between groups of patients based on their CPSpost categories. Perception of a more autono- mous role of the respondent on CPSpost was associated with a higher mean SDM-Q-9 score corresponding to a higher involvement in the decision made. The differences were particularly marked between the ‘Shared decision’ (72.6),
‘Patient decided’ (57.2) and ‘Physician decided’ (55.1) cat- egories. Known-groups validity has earlier been analysed by the same method in the Dutch validation study that enrolled both primary and specialised care patients. In their study mean SDM-Q-9 total scores across the five CPSpost groups were similar to those found in our study: ‘Patient decided’ (73.1), ‘Patient decided, considering physician’s opinion (80.1), ‘Shared decision’ (81.1), ‘Physician decided,
Table 4 Results of the exploratory factor analysis (EFA)
KMO Kaiser–Meyer–Olkin measure
a Data about the level of care were indicated as ‘other’ for n = 6 respondents
Items Total sample (n = 537)a Primary care (n = 211) Specialised care (n = 320) Factor loadings Commu-
nalities (h2)
Factor loadings Commu- nalities (h2)
Factor loadings Commu- nalities (h2)
Item 1 0.540 0.292 0.497 0.247 0.554 0.307
Item 2 0.766 0.588 0.739 0.546 0.782 0.611
Item 3 0.802 0.643 0.827 0.683 0.784 0.615
Item 4 0.872 0.760 0.891 0.793 0.855 0.732
Item 5 0.813 0.661 0.826 0.683 0.797 0.635
Item 6 0.851 0.725 0.854 0.730 0.849 0.721
Item 7 0.895 0.801 0.901 0.812 0.893 0.797
Item 8 0.845 0.714 0.848 0.719 0.846 0.716
Item 9 0.730 0.533 0.775 0.600 0.698 0.487
KMO 0.910 0.907 0.898
Bartlett’s test χ2 = 3560.87 (df = 36),
p < 0.0001 χ2 = 1476.26 (df = 36),
p < 0.0001 χ2 = 2067.34 (df = 36), p < 0.0001
considering patient’s preferences (64.9) and ‘Physician decided’ (39.4) [30].
The inter-country variations in psychometrics of the SDM-Q-9 may be attributable to the differences across studies in terms of patient characteristics (diagnosis, mean age, decisions assessed), levels of care (primary, specialised or both), data collection methods (paper-based or online), nuances in language versions of the questionnaire and cul- tural variations in patient–physician relationships. Taking as a whole, measurement properties of the Hungarian SDM- Q-9 are very close to those of the original German version.
The large sample size of the study allowed to explore the potential differences in properties of SDM-Q-9 between primary and specialised care subsamples. Only small vari- ations were found between the two settings, and the over- all good performance of the measure was true for both
subsamples. The questionnaire showed a decreased ceil- ing effect and improved internal consistency and factor structure in primary care, whereas discrimination and item difficulty were slightly better for specialised care. Interest- ingly, compared to specialised care, much lower SDM-Q-9 total scores were found in primary care for the two catego- ries referring to a passive patient role. This may imply that patients have different expectations regarding the SDM pro- cess in primary and specialised care. It seems that a greater involvement of physicians may be acceptable in specialised care settings.
The first strength of our study was using a large nationally representative sample of the general population for the vali- dation. This enabled to reach a variety of groups of patients with different diagnoses including acute and chronic condi- tions. To our knowledge, we were the first to compare the
Table 5 Results of the confirmatory factor analysis (CFA)
Recommended values: CFI > 0.90, RMSEA and SRMR ≤ 0.08. Values meeting the cut-off criteria are indi- cated in bold
CFI comparative fit index, ML maximum likelihood, N/A not applicable, RMSEA root mean square error of approximation, SB Satorra-Bentler, SRMR standardized root mean square residual
*p < 0.0001
No. Model Estimator df χ2 CFI RMSEA SRMR
Total sample (n = 537)
1 One-factor model including all items ML 27 387.39* 0.899 0.158 0.052
SB 204.53* 0.916 0.111 N/A
2 One-factor model excluding item 1 ML 20 260.28* 0.928 0.150 0.039
SB 129.89* 0.943 0.101 N/A
3 One-factor model excluding item 9 ML 20 324.06* 0.905 0.168 0.053
SB 168.87* 0.923 0.118 N/A
4 One-factor model excluding items 1 and 9 ML 14 195.81* 0.939 0.156 0.035
SB 94.79* 0.954 0.104 N/A
Primary care (n = 211)
1 One-factor model including all items ML 27 168.44* 0.904 0.158 0.054
SB 82.67* 0.932 0.099 N/A
2 One-factor model excluding item 1 ML 20 119.11* 0.929 0.153 0.038
SB 56.07* 0.953 0.092 N/A
3 One-factor model excluding item 9 ML 20 147.03* 0.903 0.174 0.058
SB 75.06* 0.929 0.114 N/A
4 One-factor model excluding items 1 and 9 ML 14 97.29* 0.932 0.168 0.038
SB 47.64* 0.954 0.107 N/A
Specialised care (n = 320)
1 One-factor model including all items ML 27 266.40* 0.884 0.166 0.056
SB 152.49* 0.904 0.121 N/A
2 One-factor model excluding item 1 ML 20 181.28* 0.916 0.159 0.046
SB 96.08* 0.934 0.109 N/A
3 One-factor model excluding item 9 ML 20 208.03* 0.899 0.171 0.055
SB 113.01* 0.920 0.121 N/A
4 One-factor model excluding items 1 and 9 ML 14 123.74* 0.936 0.157 0.039
SB 60.24* 0.955 0.102 N/A
validity and reliability of SDM-Q-9 in primary and special- ised care settings. Furthermore, this is the first study in the literature evaluating pattern answering and completion time of the SDM-Q-9.
Our study has some limitations. First, recall bias could have arisen as participants were asked to retrospectively recall health-related decisions using a 6-month time frame.
It is very likely, however, that the time between the deci- sion and the completion of the survey was much shorter, especially when one takes into account the proportion of respondents with chronic diseases in the sample. Second, as opposed to previous validation studies, the assessment of the acceptance rates of the questionnaire items was not possible, as all questions of SDM-Q-9 were mandatory in the online survey.
In conclusion, the present study is the first national survey on SDM practices in Hungary. The overall good measurement properties of the Hungarian SDM-Q-9 make the questionnaire suitable for use both in primary and spe- cialised care settings. The results may facilitate the under- standing of the SDM process in the Hungarian context and aspire to ground health policies targeting the implementa- tion of SDM practices in Hungary.
Acknowledgements Open access funding provided by Corvinus Uni- versity of Budapest (BCE). This research was supported by the Higher Education Institutional Excellence Program of the Ministry of Human Capacities in the framework of the ‘Financial and Public Services’
research project (20764-3/2018/FEKUTSTRAT) at Corvinus Univer- sity of Budapest. The authors are grateful to the developer team of SDM-Q-9 at the University Medical Center Hamburg-Eppendorf in Germany for their contribution to the translation process and to Balázs Jenei (MSc student at Corvinus University of Budapest) for the excel- lent research assistance.
Compliance with ethical standards
Conflict of interest In connection with writing this article, FR has re- ceived grant support from the Higher Education Institutional Excel- lence Program of the Ministry of Human Capacities in the framework of the ‘Financial and Public Services’ research project (20764-3/2018/
FEKUTSTRAT) at Corvinus University of Budapest. The other au- thors declare that they have no conflict of interest.
Ethical standards All procedures performed in studies involving human participants were in accordance with the ethical standards of the institu- tional and/or national research committee and with the 1964 Helsinki declaration and its later amendments or comparable ethical standards.
Informed consent Informed consent was obtained from all participants included in the study.
Open Access This article is distributed under the terms of the Crea- tive Commons Attribution 4.0 International License (http://creat iveco mmons .org/licen ses/by/4.0/), which permits unrestricted use, distribu- tion, and reproduction in any medium, provided you give appropriate credit to the original author(s) and the source, provide a link to the Creative Commons license, and indicate if changes were made.
References
1. Langberg, E.M., Dyhr, L., Davidsen, A.S.: Development of the concept of patient-centredness—a systematic review.
Patient Educ. Couns. 5, 6 (2019). https ://doi.org/10.1016/j.
pec.2019.02.023
2. Elwyn, G., Frosch, D., Thomson, R., Joseph-Williams, N., Lloyd, A., Kinnersley, P., Cording, E., Tomson, D., Dodd, C., Rollnick, S., Edwards, A., Barry, M.: Shared decision making: a model for clinical practice. J. Gen. Intern. Med. 27(10), 1361–1367 (2012).
https ://doi.org/10.1007/s1160 6-012-2077-6
3. Djulbegovic, B., Guyatt, G.H.: Progress in evidence-based medi- cine: a quarter century on. Lancet (London, England) 390(10092), 415–423 (2017). https ://doi.org/10.1016/s0140 -6736(16)31592 -6 Fig. 3 Known-groups validity:
mean total SDM-Q-9 scores by CPSpost category. Note that p values indicate Games-Howell post hoc test. CPSpost Control Preferences Scale post, SDM- Q-9 9-item Shared Decision Making Questionnaire
4. Fried, T.R.: Shared decision making-finding the sweet spot. N.
Engl. J. Med. 374(2), 104–106 (2016). https ://doi.org/10.1056/
NEJMp 15100 20
5. Oshima Lee, E., Emanuel, E.J.: Shared decision making to improve care and reduce costs. N. Engl. J. Med. 368(1), 6–8 (2013). https ://doi.org/10.1056/NEJMp 12095 00
6. Spatz, E.S., Krumholz, H.M., Moulton, B.W.: Prime time for shared decision making. JAMA 317(13), 1309–1310 (2017). https ://doi.org/10.1001/jama.2017.0616
7. Stiggelbout, A.M., Van der Weijden, T., De Wit, M.P., Frosch, D., Legare, F., Montori, V.M., Trevena, L., Elwyn, G.: Shared deci- sion making: really putting patients at the centre of healthcare.
BMJ 344, e256 (2012). https ://doi.org/10.1136/bmj.e256 8. Durand, M.A., Carpenter, L., Dolan, H., Bravo, P., Mann, M.,
Bunn, F., Elwyn, G.: Do interventions designed to support shared decision-making reduce health inequalities? A system- atic review and meta-analysis. PLoS One 9(4), e94670 (2014).
https ://doi.org/10.1371/journ al.pone.00946 70
9. Boncz, I., Sebestyen, A.: Financial deficits in the health services of the UK and Hungary. Lancet (London, England) 368(9539), 917–918 (2006). https ://doi.org/10.1016/s0140 -6736(06)69369 10. Málovics, É., Vajda, B., Kuba, P.: Paternalizmus vagy közös -0
döntés? Páciensek az orvos–beteg kommunikációról. In: Hetesi, E., Majó, Z., Lukovics, M. (eds.) A szolgáltatások világa, pp.
250–264. JATE Press, Szeged (2009)
11. Vajda, B., Horváth, S., Málovics, É.: Közös döntéshozatal, mint innováció az orvos-beteg kommunikációban. In: Bajmócy, Z., Lengyel, I., Málovics, G. (eds.) Regionális innovációs képesség, versenyképesség és fenntarthatóság, pp. 336–353. JATE Press, Szeged (2012)
12. Rotar, A.M., Van Den Berg, M.J., Schafer, W., Kringos, D.S., Klazinga, N.S.: Shared decision making between patient and GP about referrals from primary care: does gatekeeping make a differ- ence? PLoS One 13(6), e0198729 (2018). https ://doi.org/10.1371/
journ al.pone.01987 29
13. Gartner, F.R., Bomhof-Roordink, H., Smith, I.P., Scholl, I., Stiggelbout, A.M., Pieterse, A.H.: The quality of instruments to assess the process of shared decision making: a systematic review.
PLoS One 13(2), e0191747 (2018). https ://doi.org/10.1371/journ al.pone.01917 47
14. Kriston, L., Scholl, I., Holzel, L., Simon, D., Loh, A., Harter, M.: The 9-item Shared Decision Making Questionnaire (SDM-Q- 9). Development and psychometric properties in a primary care sample. Patient Educ. Couns. 80(1), 94–99 (2010). https ://doi.
org/10.1016/j.pec.2009.09.034
15. Scholl, I., Kriston, L., Dirmaier, J., Buchholz, A., Harter, M.:
Development and psychometric properties of the Shared Decision Making Questionnaire–physician version (SDM-Q-Doc). Patient Educ. Couns. 88(2), 284–290 (2012). https ://doi.org/10.1016/j.
pec.2012.03.005
16. Doherr, H., Christalle, E., Kriston, L., Harter, M., Scholl, I.: Use of the 9-item Shared Decision Making Questionnaire (SDM-Q-9 and SDM-Q-Doc) in intervention studies-A systematic review.
PLoS One 12(3), e0173904 (2017). https ://doi.org/10.1371/journ al.pone.01739 04
17. Glass, K.E., Wills, C.E., Holloman, C., Olson, J., Hechmer, C., Miller, C.K., Duchemin, A.M.: Shared decision making and other variables as correlates of satisfaction with health care decisions in a United States national survey. Patient Educ. Couns. 88(1), 100–105 (2012). https ://doi.org/10.1016/j.pec.2012.02.010 18. Stubenrouch, F.E., Mus, E.M.K., Lut, J.W., Hesselink, E.M.,
Ubbink, D.T.: The current level of shared decision-making in anesthesiology: an exploratory study. BMC Anesthesiol. 17(1), 95 (2017). https ://doi.org/10.1186/s1287 1-017-0386-3
19. Tinsel, I., Buchholz, A., Vach, W., Siegel, A., Durk, T., Buch- holz, A., Niebling, W., Fischer, K.G.: Shared decision-mak- ing in antihypertensive therapy: a cluster randomised con- trolled trial. BMC Fam. Pract. 14, 135 (2013). https ://doi.
org/10.1186/1471-2296-14-135
20. Santema, T.B., Stubenrouch, F.E., Koelemay, M.J., Vahl, A.C., Vermeulen, C.F., Visser, M.J., Ubbink, D.T.: Shared decision making in vascular surgery: an exploratory study. Eur. J. Vasc.
Endovasc. Surg. 51(4), 587–593 (2016). https ://doi.org/10.1016/j.
ejvs.2015.12.010
21. Albrecht, K.J., Nashan, D., Meiss, F., Bengel, J., Reuter, K.:
Shared decision making in dermato-oncology: preference for involvement of melanoma patients. Melanoma Res. 24(1), 68–74 (2014). https ://doi.org/10.1097/cmr.00000 00000 00003 0 22. De Las Cuevas, C., Penate, W., Perestelo-Perez, L., Serrano-Agu-
ilar, P.: Shared decision making in psychiatric practice and the primary care setting is unique, as measured using a 9-item Shared Decision Making Questionnaire (SDM-Q-9). Neuropsychiatr. Dis.
Treat. 9, 1045–1052 (2013). https ://doi.org/10.2147/ndt.S4902 1 23. Verwijmeren, D., Grootens, K.P.: Shared decision making in
pharmacotherapy decisions, perceived by patients with bipo- lar disorder. Int. J. Bipolar Disord. 6(1), 21 (2018). https ://doi.
org/10.1186/s4034 5-018-0129-5
24. Zisman-Ilani, Y., Roe, D., Scholl, I., Harter, M., Karnieli-Miller, O.: Shared decision making during active psychiatric hospitali- zation: assessment and psychometric properties. Health Com- mun. 32(1), 126–130 (2017). https ://doi.org/10.1080/10410 236.2015.10995 04
25. Calderon, C., Jimenez-Fonseca, P., Ferrando, P.J., Jara, C., Lor- enzo-Seva, U., Beato, C., Garcia-Garcia, T., Castelo, B., Ram- chandani, A., Munoz, M.M., Martinez de Castro, E., Ghanem, I., Mangas, M., Carmona-Bayonas, A.: Psychometric properties of the Shared Decision-Making Questionnaire (SDM-Q-9) in oncol- ogy practice. Int. J. Clin. Health Psychol. 18(2), 143–151 (2018).
https ://doi.org/10.1016/j.ijchp .2017.12.001
26. Geessink, N.H., Ofstad, E.H., Olde Rikkert, M.G.M., van Goor, H., Kasper, J., Schoon, Y.: Shared decision-making in older patients with colorectal or pancreatic cancer: determi- nants of patients’ and observers’ perceptions. Patient Educ.
Couns. 101(10), 1767–1774 (2018). https ://doi.org/10.1016/j.
pec.2018.06.005
27. Wu, T.Y., Chen, C.T., Huang, Y.J., Hou, W.H., Wang, J.D., Hsieh, C.L.: Rasch analysis of the 9-Item Shared Decision Making Ques- tionnaire in women with breast cancer. Cancer Nurs. (2018). https ://doi.org/10.1097/ncc.00000 00000 00060 7
28. Hong, P., Maguire, E., Purcell, M., Ritchie, K.C., Chorney, J.:
Decision-making quality in parents considering adenotonsil- lectomy or tympanostomy tube insertion for their children.
JAMA 143(3), 260–266 (2017). https ://doi.org/10.1001/jamao to.2016.3365
29. Woltz, S., Krijnen, P., Meylaerts, S.A.G., Pieterse, A.H., Schip- per, I.B.: Shared decision making in the management of midshaft clavicular fractures: nonoperative treatment or plate fixation.
Injury 48(4), 920–924 (2017). https ://doi.org/10.1016/j.injur y.2017.02.032
30. Rodenburg-Vandenbussche, S., Pieterse, A.H., Kroonenberg, P.M., Scholl, I., van der Weijden, T., Luyten, G.P., Kruitwagen, R.F., den Ouden, H., Carlier, I.V., van Vliet, I.M., Zitman, F.G., Stiggelbout, A.M.: Dutch translation and psychometric testing of the 9-Item Shared Decision Making Questionnaire (SDM-Q-9) and Shared Decision Making Questionnaire-Physician Version (SDM-Q-Doc) in primary and secondary care. PLoS One 10(7), e0132158 (2015). https ://doi.org/10.1371/journ al.pone.01321 58 31. Cuevas, C., Perestelo-Perez, L., Rivero-Santana, A., Cebolla- Marti, A., Scholl, I., Harter, M.: Validation of the Spanish ver- sion of the 9-item Shared Decision-Making Questionnaire.
Health Expect. 18(6), 2143–2153 (2015). https ://doi.org/10.1111/
hex.12183
32. Alvarado-Villa, G.E., Moncayo-Rizzo, J.D., Gallardo-Rum- bea, J.A.: Spanish validation endorsement of SDM-Q-9, a new approach. BMC Public Health 19(1), 106 (2019). https ://doi.
org/10.1186/s1288 9-019-6436-7
33. Baicus, C., Balanescu, P., Gurghean, A., Badea, C.G., Padure- anu, V., Rezus, C., Mitu, F., Jurcut, R., Balanescu, A.R., Daha, I., Balanescu, E., Bojinca, M., Pinte, L., Constantin, A.M., Dima, N., Floria, M., Leon-Constantin, M.M., Roca, M., Mitu, M., Chiriac, S., Floria, M., Badescu, C.M., Ionescu, S.D., Mitrea, E., Rosu, G., Ionescu, G.D., Visinescu, A.M., Mihailescu, G., Oprisan, E., Zeh, S., Scholl, I., Harter, M.: Romanian version of SDM-Q-9 valida- tion in Internal Medicine and Cardiology setting: a multicentric cross-sectional study. Rom. J. Intern. Med. (2019). https ://doi.
org/10.2478/rjim-2019-0002
34. Hulbæk, M., Jørgensen, M.J., Mainz, H., Birkelund, R., Niel- son, J.B., Debrabant, B., Primdahl, J.: Danish translation, cul- tural adaptation and validation of the Shared Decision Making Questionnaire-Patient Version (SDM-Q-9-Pat). Eur. J. Pers. Cent.
Healthc. 6(3), 438–446 (2018)
35. Hungarian Central Statistical Office: Microcensus 2016 – 3.
Demographic data. http://www.ksh.hu/mikro cenzu s2016 /?lang=en (2016). Accessed 13/03/2019
36. Eurostat: Individuals regularly using the internet % of indi- viduals aged 16 to 74. https ://ec.europ a.eu/euros tat/tgm/table .do?tab=table &init=1&langu age=en&pcode =tin00 091 (2018).
Accessed 13/03/2019
37. Zikmund-Fisher, B.J., Couper, M.P., Singer, E., Levin, C.A., Fowler Jr., F.J., Ziniel, S., Ubel, P.A., Fagerlin, A.: The DECI- SIONS study: a nationwide survey of United States adults regard- ing 9 common medical decisions. Med. Decis. Mak. 30(5 Suppl), 20s–34s (2010). https ://doi.org/10.1177/02729 89x09 35379 2 38. Zikmund-Fisher, B.J., Couper, M.P., Singer, E., Ubel, P.A., Ziniel,
S., Fowler Jr., F.J., Levin, C.A., Fagerlin, A.: Deficits and varia- tions in patients’ experience with making 9 common medical deci- sions: the DECISIONS survey. Med. Decis. Mak. 30(5 Suppl), 85s–95s (2010). https ://doi.org/10.1177/02729 89x10 38046 6 39. O’Connor, A.M., Drake, E.R., Wells, G.A., Tugwell, P., Laupacis,
A., Elmslie, T.: A survey of the decision-making needs of Cana- dians faced with complex health decisions. Health Expect. 6(2), 97–109 (2003). https ://doi.org/10.1046/j.1369-6513.2003.00215 40. Eurostat: European Health Interview Survey (EHIS wave 2) Meth-.x
odological manual. (2013)
41. Cox, B., van Oyen, H., Cambois, E., Jagger, C., le Roy, S., Robine, J.M., Romieu, I.: The reliability of the minimum European health module. Int. J. Public Health 54(2), 55–60 (2009). https ://doi.
org/10.1007/s0003 8-009-7104-y
42. Beaton, D.E., Bombardier, C., Guillemin, F., Ferraz, M.B.: Guide- lines for the process of cross-cultural adaptation of self-report measures. Spine 25(24), 3186–3191 (2000)
43. Calderon, C., Ferrando, P.J., Carmona-Bayonas, A., Lorenzo-Seva, U., Jara, C., Beato, C., Garcia, T., Ramchandani, A., Castelo, B., Munoz, M.M., Garcia, S., Higuera, O., Mangas-Izquierdo, M., Jimenez-Fonseca, P.: Validation of SDM-Q-Doc Questionnaire to measure shared decision-making physician’s perspective in oncol- ogy practice. Clin. Transl. Oncol. 19(11), 1312–1319 (2017). https ://doi.org/10.1007/s1209 4-017-1671-9
44. Hsieh, H.F., Shannon, S.E.: Three approaches to qualitative con- tent analysis. Qual. Health Res. 15(9), 1277–1288 (2005). https ://doi.org/10.1177/10497 32305 27668 7
45. Patton, M.Q.: Enhancing the quality and credibility of qualitative analysis. Health Serv. Res. 34(5 Pt 2), 1189–1208 (1999) 46. Menear, M., Garvelink, M.M., Adekpedjou, R., Perez, M.M.B.,
Robitaille, H., Turcotte, S., Legare, F.: Factors associated with shared decision making among primary care physicians: findings from a multicentre cross-sectional study. Health Expect. 21(1), 212–221 (2018). https ://doi.org/10.1111/hex.12603
47. Degner, L.F., Sloan, J.A., Venkatesh, P.: The control preferences scale. Can. J. Nurs. Res. 29(3), 21–43 (1997)
48. Brom, L., Hopmans, W., Pasman, H.R., Timmermans, D.R., Widdershoven, G.A., Onwuteaka-Philipsen, B.D.: Congru- ence between patients’ preferred and perceived participa- tion in medical decision-making: a review of the literature.
BMC Med. Inform. Decis. Mak. 14, 25 (2014). https ://doi.
org/10.1186/1472-6947-14-25
49. Kasper, J., Heesen, C., Kopke, S., Fulcher, G., Geiger, F.: Patients’
and observers’ perceptions of involvement differ. Validation study on inter-relating measures for shared decision making. PLoS One 6(10), 26255 (2011). https ://doi.org/10.1371/journ al.pone.00262 50. McHorney, C.A., Tarlov, A.R.: Individual-patient monitoring in 55
clinical practice: are available health status surveys adequate?
Qual. Life Res. 4(4), 293–307 (1995)
51. Cronbach, L.J.: A catastrophe model for developing service sat- isfaction strategies coefficient alpha and the internal structure of tests. Psychometrika 16(3), 297–334 (1951)
52. Bernstein, I.H., Nunnally, J., Oliva, T.A., Oliver, R.L., MacMil- lan, I.C.: A catastrophe model for developing service satisfaction strategies. J. Market. 56, 83–95 (1992)
53. Feldt, L.S., Woodruff, D.J., Salih, F.A.: Statistical inference for coefficient alpha. Appl. Psychol. Meas. 11(1), 93–103 (1987).
https ://doi.org/10.1177/01466 21687 01100 107
54. Kaiser, H.F.: A second generation little jiffy. Psychometrika 35(4), 401–415 (1970)
55. Hair, J.F., Black, W.C., Babin, B.J., Anderson, R.E.: Multivariate data analysis. Prentice Hall, New Jersey (2010)
56. Brown, T.A.: Confirmatory factor analysis for applied research.
Guilford Publications, New York (2014)
57. Satorra, A., Bentler, P.M.: Corrections to test statistics and stand- ard errors in covariance structure analysis. In: von Eye, A.E., Clogg, C.C. (eds.) Latent variables analysis: applications for developmental research, pp. 399–419. Sage Publications, Thou- sand Oaks (1994)
58. Hu, L.T., Bentler, P.M.: Cutoff criteria for fit indexes in covariance structure analysis: conventional criteria versus new alternatives.
Struct. Equ. Modeling 6(1), 1–55 (1999)
59. Diedenhofen, B., Musch, J.: Cocron: a web interface and R pack- age for the statistical comparison of Cronbach’s alpha coefficients.
Int. J. Internet Sci. 11(1), 51–60 (2016)
60. KSH: A 2014-ben végrehajtott Európai lakossági egészségfelmé- rés (ELEF) eredményei. (2018) ISBN: 978-963-235-506-1ö Publisher’s Note Springer Nature remains neutral with regard to jurisdictional claims in published maps and institutional affiliations.